

Abstract
Objectives
While critical care physicians view obesity as an independent poor prognostic marker, growing evidence suggests that obesity is, instead, associated with improved mortality following ICU admission. However, this prior empirical work may be biased by preferential admission of obese patients to ICUs, and little is known about other patient-centered outcomes following critical illness. We sought to determine whether one-year mortality, health care utilization, and functional outcomes following a severe sepsis hospitalization differ by BMI.
Design
Observational cohort study.
Patients
We analyzed 1,404 severe sepsis hospitalizations (1999–2005) among Medicare beneficiaries enrolled in the nationally representative Health & Retirement Study, of which 597 (42.5%) were normal weight, 473 (33.7%) were overweight, and 334 (23.8%) were obese or severely obese, as assessed at their survey prior to acute illness. Underweight patients were excluded a priori.
Interventions
None.
Measurements and Main Results
Using Medicare claims, we identified severe sepsis hospitalizations and measured inpatient health care facility use and calculated total and itemized Medicare spending in the year following hospital discharge. Using the National Death Index, we determined mortality. We ascertained pre- and post-morbid functional status from survey data. Patients with greater BMIs experienced higher 1-year mortality compared to non-obese patients, and there was a dose response relationship such that obese (OR=0.59, 95%CI 0.39, 0.88) and severely obese patients (OR=0.46, 95%CI 0.26, 0.80) had the lowest mortality. Total days in a health care facility and Medicare expenditures were greater for obese patients (p<0.01 for both comparisons), but average daily utilization (p=0.44) and Medicare spending were similar (p=0.65) among normal, overweight and obese survivors. Total function limitations following severe sepsis did not differ by BMI category (p=0.64).
Conclusions
Obesity is associated with improved mortality among severe sepsis patients. Due to longer survival, obese sepsis survivors use more health care and result in higher Medicare spending in the year following hospitalization. Median daily health care utilization was similar across BMI categories.
Keywords: body mass index, critical care, prognosis, utilization, outcomes assessment, sepsis
Introduction
Given the high prevalence of obesity in the United States and growing costs of hospitalization for critical illness (1–4), it is important to understand the effects of obesity on critical illness. Despite population-based studies demonstrating higher general mortality(5–8) and pathophysiologic variations that would predict worse outcomes(9–13), studies examining the impact of obesity on critical illness have yielded mixed results (14–16)—that is, some studies suggest a possible “obesity paradox” wherein obesity is not harmful and may even be protective once one is ill.
Prior work has been criticized, however, for small sample sizes and use of underweight patients as non-obese comparisons(17). Furthermore, studies often use weight ascertained at ICU admission—potentially after fluid resuscitation or prior to diuresis for decompensated edema—rather than the patient’s true outpatient weight. This practice may misclassify the body mass index (BMI) category in as many as 20% of patients (18).
Beyond these problems of non-representative samples and misclassification of the key exposure variable, much of the existing research has assessed in-hospital mortality following ICU admission. This study design is susceptible to bias for two reasons. First, discharge practices vary across hospitals and have been shown to alter in-hospital mortality(19–21). Second, ICU admission thresholds vary markedly across institutions (22, 23), and may be systematically different in obese patients due to their greater nursing needs (16).
Because of the limitations of the existing literature on mortality and lack of information on other patient-centered outcomes, we sought to investigate the association of obesity with one-year mortality, health care utilization, and functional limitations in Medicare beneficiaries following a hospitalization for severe sepsis. We selected these additional outcome measures because of the high value patients place on living and functioning independently(24). We focused on severe sepsis because it is a very common diagnosis(25) that can be treated both within and outside the ICU.
METHODS
Study Population
The Health and Retirement Study (HRS) is an ongoing, nationally representative, cohort study of older Americans. Started in 1992, the HRS has enrolled nearly 30,000 participants, of whom 16,772 have agreed to link their data with Medicare(26). The cohort is re-interviewed every two years, with a follow-up rate consistently over 90%(26). Patients provided informed consent on enrollment in the HRS and again for linkage to Medicare. We studied all respondents with a baseline assessment in 1998–2004 for whom there were claims-based data on a subsequent severe sepsis hospitalization during 1998–2005. These patients were identified previously for inclusion in a study of cognitive and functional disability among sepsis survivors(27). This work was approved by the University of Michigan Institutional Review Board.
We used a commonly employed, validated claims-based definition of severe sepsis(28, 29). For patients with more than one severe sepsis hospitalization, each hospitalization was included. Patients were followed for one year after their hospital discharge.
Data Abstraction
Characteristics of the hospitalizations were abstracted from Medicare claims, including acute dysfunction of the cardiovascular, neurologic, hematologic, hepatic, renal, and respiratory systems and the medical co-morbidities included in the Charlson comorbidity index(30). Because diabetes may be associated with better outcomes in sepsis(31), we calculated an adjusted Charlson co-morbidity score excluding diabetes, so that diabetes could be entered into multivariate analyses separately from other co-morbidities. We determined critical care use from MedPAR files indicating admission to either an intensive or coronary care unit. We identified mechanical ventilation use by the presence of ICD-9-CM code 96.7 (including 96.7x) in any MedPAR procedure code field, a method that is validated(32) and has been used in epidemiologic studies of mechanical ventilation(33). Health-related limitations in the 6 activities of daily living (ADLs) and 5 instrumental ADLS were abstracted from the HRS survey immediately prior to and following the index hospitalization(34). Date of death was determined from the National Death Index and confirmed by HRS interviewers and the Medicare Denominator File.
We abstracted self-reported height and weight from the HRS surveys immediately proceeding and following incident hospitalization. We calculated body mass index (BMI) using the equation: BMI (kg/m2) = weight (kg)/height2 (m2). Because HRS surveys occur biennially and are random in relation to sepsis hospitalization, there was a variable time lag between baseline measurements and hospitalization (median, 1.1 years).
We also determined self-reported race and wealth from the HRS survey prior to hospitalization. For our measure of wealth, we used the sum of all household assets and debts—including real estate(35). We standardized net assets to 2011 U.S. dollars using the Annual Gross Domestic Product Price Index(36) and made a 6-category wealth variable where category one is net negative or zero assets, and categories 2 through 6 are quintiles of positive wealth(37).
Outcomes
The primary outcomes of interest were mortality, health care utilization, and functional status. We measured mortality in-hospital, at 90 days, and at 1 year. To assess health care utilization, we calculated inpatient facility use and Medicare spending in the year following hospital discharge. To measure inpatient facility use, we determined each patient’s daily location in the year following hospital discharge with CMS MedPAR files. We then calculated the total days spent in an acute care hospital, long-term acute hospital (LTAC), skilled nursing facility (SNF), and home. We also determined the incidence of transitions of care location, discharge to LTAC, and repeat hospital admissions. Finally, we calculated the Medicare spending associated with the acute sepsis hospitalization as well as total Medicare spending in the year following hospital discharge, including inpatient and outpatient care. To adjust for inflation, all Medicare spending was standardized to 2011 U.S. dollars using the Annual Gross Domestic Product Price Index(36). To evaluate functional outcomes, we compared changes in total ADL and IADL limitation scores obtained from the HRS surveys immediately preceding and following incident sepsis hospitalization in survivors by BMI category.
Patients were assumed to be at home for any day they were known to be alive and not admitted to an acute care hospital, LTAC, or SNF based on MedPAR records. Because Medicare does not pay for long-term custodial care provided by nursing facilities, patients residing in a nursing home on a permanent basis cannot be identified on a daily basis through MedPAR records(38, 39). Thus, while our results accurately count inpatient facility care funded by Medicare, they are conservative with respect to total service use.
Statistical Analysis
We present categorical data as numbers (%) and continuous data as means (SDs) or medians (IQR) depending on the distribution. We evaluated the relationship between BMI and outcome variables using BMI both as a continuous variable and as a categorical variable using World Health Organization classifications (kg/m2): normal, 18.5–24.9; overweight, 25–29.9; obese 30.0–34.9; and severely obese ≥ 35.0 (40). Due to the small number of patients with a BMI ≥ 35.0, we did not further sub-divide these patients into those with BMI ≥ 40.0. For all analyses, we excluded underweight (BMI < 18.5) patients due to previous research suggesting a “U” shaped relationship between BMI and mortality such that inclusion of underweight patients may bias results(16, 41, 42). For many of the analyses, we explored two separate samples (Supplemental Figure 1): the 1,404 severe sepsis hospitalizations, which we refer to as “sepsis patients”; and the 1,087 hospitalizations who survived to hospital discharge, which we refer to as “sepsis survivors”.
To compare baseline demographics, hospital characteristics, health care resource use, and functional limitations across BMI categories, we used Kruskal Wallis test for continuous variables and χ2 for categorical variables. To evaluate for trends across BMI categories, we also used a non-parametric trend test (43).
We used multivariable logistic regression to determine independent associations between BMI and mortality, rate of discharge to LTAC, 30-day readmission, and 90-day readmission. For each multivariate model, we included all available covariates that we deemed potentially important based on clinical judgment and past research (specific covariates are detailed in Table 2 and Supplemental Table 1).
Table 2.
Multivariable Associations of Body Mass with Patient Outcomes for Sepsis Patientsa
| Variable | Adjusted Odds Ratio (95% CI)b
|
||
|---|---|---|---|
| Hospital Mortality | 90-Day Mortality | One-Year Mortality | |
| BMI, continuous, 1 unit increment | 0.96 (0.93, 0.99) | 0.95 (0.93, 0.98) | 0.96 (0.93, 0.99) |
| BMI category, referent is normal BMI | |||
| Overweight | 0.69 (0.50, 0.96) | 0.62 (0.46, 0.83) | 0.65 (0.48, 0.88) |
| Obese | 0.64 (0.40, 1.01) | 0.53 (0.35, 0.79) | 0.59 (0.39, 0.88) |
| Severely Obese | 0.54 (0.31, 0.95) | 0.43 (0.25, 0.74) | 0.46 (0.26, 0.80) |
| Obesity, dichotomous | 0.71 (0.49, 1.02) | 0.61 (0.44, 0.85) | 0.66 (0.48, 0.92) |
Bolded values are statistically significant.
Underweight patients were excluded a priori.
Odds ratios are adjusted for age, race, gender, marital status, wealth, acute organ dysfunctions, ICU use, mechanical ventilation use, diabetes, other co-morbidities, baseline cognitive status, and functional limitations.
All analyses were conducted with Stata software version 12 (StataCorp, College Station, Texas). We used hospitalization as the unit of analysis, adjusting for the non-independence of observations within patients using Stata’s vce(cluster) command. We used two-sided significance testing and considered a p value <0.05 to be significant.
RESULTS
Study Population
There were 1,524 severe sepsis hospitalizations in the HRS-Medicare cohort, of which 34 (2.2%) were excluded from the analysis for missing height and/or weight measurements and 86 (5.6%) were excluded for being underweight (Supplemental Figure 1). Of the 1,404 severe sepsis hospitalizations included in the analysis, 597 (42.5%) were normal weight, 473 (33.7%) were overweight, and 334 (23.8%) were obese or severely obese.
Baseline demographic and hospitalization characteristics of the sepsis patients are provided in Table 1. The obese were, on average, younger (p < 0.001), more likely to be non-white (p = 0.001), more likely to be female (p < 0.001), and more likely to have diabetes (p < 0.001). They were also less wealthy (p < 0.001), experienced more acute renal dysfunction (p = 0.001), and had more baseline ADL limitations (p = 0.02).
Table 1.
Demographic Information and Hospitalization Characteristics for Obese and Non-Obese Sepsis Patientsb
| Demographic or Hospitalization Characteristic | Normal n = 597 |
Overweight n = 473 |
Obese n = 202 |
Severely Obese n = 132 |
|---|---|---|---|---|
| Age (years), mean (SD)a | 81.3 (8.6) | 78.7 (8.6) | 75.3 (8.1) | 72.8 (8.0) |
| Male, N (%)a | 277 (46.6) | 274 (57.9) | 93 (46.0) | 37 (28.0) |
| Self Reported Race/Ethnicity, N (%)a | ||||
| White, non-Hispanic | 457 (76.6) | 324 (68.5) | 138 (68.2) | 90 (68.1) |
| Black | 96 (16.1) | 103 (21.8) | 47 (23.3) | 37 (28.0) |
| White, Hispanic | 35 (5.9) | 29 (6.1) | 14 (6.9) | 0 (0.0) |
| Other | 9 (1.5) | 17 (3.6) | 3 (1.5) | 5 (3.8) |
| Married or Partnered, N (%)a | 233 (39.0) | 239 (50.6) | 97 (48.0) | 54 (40.9) |
| Wealth, N (%)a | ||||
| Net negative on zero assets | 77 (12.9) | 59 (12.5) | 33 (16.3) | 15 (11.4) |
| Quintile 1 | 87 (14.6) | 81 (17.1) | 34 (16.8) | 50 (37.9) |
| Quintile 2 | 102 (17.1) | 76 (16.1) | 31 (15.4) | 27 (20.5) |
| Quintile 3 | 100 (16.8) | 90 (19.0) | 39 (19.3) | 10 (7.6) |
| Quintile 4 | 109 (18.3) | 86 (18.2) | 39 (19.3) | 10 (7.6) |
| Quintile 5 | 122 (20.4) | 81 (17.1) | 26 (12.9) | 15 (11.4) |
| Adjusted Charlsonscorec, mean (SD)a | 1.8 (1.7) | 1.9 (1.6) | 1.9 (1.8) | 2.2 (1.7) |
| Diabetes, N (%)a | 62 (10.4) | 94 (19.9) | 48 (23.8) | 31 (23.5) |
| Total Acute Organ Dysfunctions, mean (SD) | 1.3 (0.6) | 1.2 (0.6) | 1.2 (0.5) | 1.3 (0.7) |
| Individual Acute Organ Dysfunctions, N (%) | ||||
| Cardiovascular | 178 (29.8) | 120 (25.4) | 48 (23.8) | 37 (28.0) |
| Hematologic | 113 (18.9) | 94 (19.9) | 36 (17.8) | 19 (14.4) |
| Hepatic | 7 (1.2) | 5 (1.1) | 1 (0.5) | 0 (0.0) |
| Neurologic | 53 (8.9) | 40 (8.5) | 9 (4.5) | 10 (7.6) |
| Renala | 233 (39.0) | 205 (43.3) | 106 (52.5) | 70 (53.0) |
| Respiratory | 168 (28.1) | 127 (26.9) | 52 (25.7) | 41 (31.1) |
| Hospital Length of Stay (days), mean (SD) | 10.4 (9.6) | 11.5 (12.0) | 11.5 (10.3) | 12.5 (13.3) |
| Used an intensive care unit, N (%) | 283 (47.7) | 232 (49.1) | 101 (50.0) | 73 (55.3) |
| Used Mechanical Ventilation, N (%) | 168 (28.1) | 127 (26.9) | 52 (25.7) | 41 (31.1) |
| Cognitive Impairment, N (%)a | ||||
| Normal | 491 (82.2) | 418 (88.4) | 170 (84.2) | 122 (92.4) |
| Mild Impairment | 51 (8.5) | 30 (6.3) | 15 (7.4) | 5 (3.8) |
| Moderate/Severe Impairment | 55 (9.2) | 25 (5.3) | 17 (8.4) | 5 (3.8) |
| Physical Function Deficiencies, mean (SD) | ||||
| Basic ADL, mean (SD)a | 1.6 (2.0) | 1.6 (1.9) | 1.6 (1.9) | 2.1 (1.9) |
| Instrumental ADL, mean (SD) | 1.3 (1.7) | 1.1 (1.6) | 1.1 (1.5) | 1.2 (1.4) |
Demographic or hospitalization characteristic is significantly different across BMI categories.
Underweight patients were excluded a priori.
Adjusted Charlson Co-morbidity Index score does not include diabetes.
Mortality
In unadjusted analyses, higher BMIs were associated with lower in-hospital, 90-day, and 1-year mortality. One-year mortality was 44.7% in severely obese, 46.0% in obese, 53.1% in overweight, and 62.0% in normal weight patients (p < 0.001 for trend). Kaplan Meier survival curves are shown in Figure 1. Examining just the 1,087 patients who survived their acute hospitalization, higher BMIs were still associated with better 1-year mortality (p < 0.001 for trend).
Figure 1.

Survival of Sepsis Patients by BMI Category
The association between BMI and in-hospital, 90-day, and 1-year mortality remained significant in a multivariate logistic regression models accounting for potential confounders (Table 2). Compared to normal weight patients, obese (OR=0.59, 95%CI 0.39, 0.88) and severely obese patients (OR=0.46, 95%CI 0.26, 0.80) had lower odds ratios for mortality. Limiting our analysis to the 1,087 sepsis survivors, the odds ratios for mortality were similar (Supplemental Table 1).
To determine whether the lower mortality we observed in obese patients was driven predominantly by older patients in whom obesity is not associated with excess mortality (44–46), we divided our sample into patients younger than and greater than 70 years old. Obesity was associated with lower odds ratios for one-year mortality in both age cohorts (Supplemental Table 2). We also found no evidence of an interaction between age and BMI in our multivariable regression models for predicting one-year mortality (p = 0.949 for model using continuous BMI variable).
Health care utilization
Among sepsis survivors, baseline health care utilization (prior to sepsis admission) did not differ by BMI category (Table 3). In the year following sepsis, however, patients with higher BMIs had more hospital readmissions (p < 0.001 for trend) and spent more days admitted to an inpatient facility (p = 0.01 for trend). However, the mean percentage of days alive spent admitted to a health care facility was not different by BMI category, suggesting that the increased health care utilization observed in obese survivors is due to longer survival rather than greater daily utilization.
Table 3.
Facility-based health care utilization in the year preceeding sepsis and the year following sepsis among patients who survived their sepsis hospitalization
| Outcome Measure | Pre-Sepsis (n=1,1087)
|
Post-Sepsis (n=1,087)
|
||||||||
|---|---|---|---|---|---|---|---|---|---|---|
| Normal n=436 |
Overweight n=377 |
Obese n=166 |
Severely Obese n=108 |
pa | Normal n=436 |
Overweight n=377 |
Obese n=166 |
Severely Obese n=108 |
pa | |
| Days Alive, Mean (SD) | 365 (0) | 365 (0) | 365 (0) | 365 (0) | 1.00 | 230 (153) | 256 (147) | 278 (134) | 289 (126) | <0.01 |
| Days at Home, Mean (SD) | 343 (44) | 336 (55) | 339 (52) | 341 (42) | 0.19 | 199 (152) | 227 (148) | 245 (138) | 247 (143) | <0.01 |
| Transitions of Care, Mean (SD) | 2.9 (3.4) | 3.8 (5.1) | 3.4 (4.2) | 3.4 (3.6) | 0.47 | 3.0 (3.3) | 3.3 (3.8) | 3.6 (3.3) | 4.5 (4.2) | <0.01 |
| Hospitalizations, Mean (SD) | 1.3 (1.5) | 1.6 (2.2) | 1.5 (1.8) | 1.5 (1.6) | 0.42 | 1.2 (1.4) | 1.4 (1.7) | 1.5 (1.5) | 1.9 (2.1) | <0.01 |
| Days in a Health Care Facility, Mean (SD) | 22 (41) | 27 (47) | 25 (38) | 22 (28) | 0.37 | 33 (45) | 31 (44) | 36 (43) | 45 (47) | <0.01 |
| Days in a Hospital, Mean (SD) | 10 (15) | 14 (21) | 15 (22) | 14 (16) | 0.13 | 11 (13) | 14 (22) | 15 (20) | 20 (23) | <0.01 |
| Days in a LTAC, Mean (SD) | 1 (7) | 1 (6) | 1 (6) | 1 (6) | 0.71 | 2 (10) | 2 (8) | 2 (10) | 5 (12) | 0.31 |
| Days in a SNF, Mean SD) | 11 (31) | 13 (34) | 9 (23) | 7 (17) | 1.00 | 21 (39) | 16 (33) | 19 (33) | 21 (33) | 0.13 |
| Percentage of Days Alive in a Health Care Facility, Mean (SD) | 6.1 (0.1) | 7.5 (0.1) | 6.7 (0.1) | 6.1 (0.1) | 0.37 | 29.0 (3.5) | 23.9 (3.3) | 21.6 (29.8) | 26.4 (3.2) | 0.07 |
Bolded values indicate significant within group differences from from pre-sepsis baseline (p < 0.5 using wilcoxon singed rank sum test).
P values for differences across BMI categories using kruskall-wallis test.
Two comparisons are being made in this table. Interpretive example: days spent in a skilled nursing facility are greater post-sepsis than pre-sepsis (so post-sepsis values are bolded). However, differences in skilled nursing facility days are note different across BMI categories pre-sepsis (p = 1.00) or post-sepsis (p = 0.13).
Similar to inpatient facility use, median Medicare spending in the year following hospital discharge—both overall and for each sub-category of Medicare spending (except hospice service)—was greater in patients with higher BMIs (Table 4). Unlike facility use, median daily Medicare spending was different by BMI category. However, the difference was driven entirely by the severely obese patients whose median daily expenditures were $125 higher than normal weight patients (p = 0.01). Median daily spending was not different between normal, overweight, and obese patients (p = 0.65). Exploring costs as means did not substantively change the results.
Table 4.
Medicare spending on the incident hospitalization and health care in the year after hospital discharge.
| Outcome Measure | Normal n=436 |
Overweight n=377 |
Obese n=166 |
Severely Obese n=108 |
pa |
|---|---|---|---|---|---|
| Cost of Incident Hospitalization, median (IQR) | 7,885 (5,384, 15,124) | 8,895 (5,721, 16,451) | 8,680 (5,343, 18,711) | 8,051 (5,457, 17,122) | 0.48 |
| Total Medicare spending in 1 year after hospital discharge, median (IQR)* | 28,896 (10,415, 67,041) | 31,210 (9,823, 77,362) | 41,047 (14,207, 86,354) | 74,717 (28,231, 190,702) | <0.001 |
| Inpatient Facility, median (IQR) | 16,462 (4,006, 47,083) | 17,124 (3,126, 48,577) | 26,645 (3,823, 53,451) | 46,053 (14,026, 30,144) | <0.001 |
| Physicial Services, median (IQR) | 4,143 (1,373, 9,226) | 4,743 (1,539, 11,551) | 6,146 (2,719, 13,200) | 10,674 (4,405, 30,144) | <0.001 |
| Outpatient Faciility, median (IQR) | 473 (0, 1,683) | 860 (33, 2,582) | 826 (165, 3,123) | 1,858 (146, 5,828) | <0.001 |
| Home Health Services, median (IQR) | 0 (0, 4,075) | 0 (0, 4,815) | 52 (0, 6,335) | 3,176 (0, 15,703) | <0.001 |
| Durable Medical Equipment, median (IQR) | 0 (0, 1,074) | 98 (0, 2,015) | 566 (0, 2633) | 778 (0, 5,745) | <0.001 |
| Hospice Services, median (IQR) | 0 (0, 0) | 0 (0, 0) | 0 (0, 0) | 0 (0, 0) | 0.48 |
| Health care spending per day alive in the 1 year after hospital discharge, median (IQR) | 201 (70, 600) | 172 (69, 549) | 188 (77, 559) | 326 (109, 853) | 0.02b |
All costs are standardized to 2011 US dollar. Total costs are the costs in the year following hospitalization, excluding the cost of the incident hospitalization.
P value for difference across BMI categories using kruskallwallis test.
Comparing just normal weight, overweight, and obese patients, there was no difference in costs per day alive (p = 0.65)
We did not identify differences in the odds ratios for discharge to an LTAC (OR = 1.03 (95% CI: 0.98, 1.07), 30-day readmission (OR = 1.02 (0.99, 1.05)), or 90-day readmission (OR = 1.01 (0.99, 1.04) by BMI among survivors (Supplemental Table 1).
Functional Disability
There were 588 individuals who survived long enough to receive a follow-up functional assessment as part of the biennial HRS surveys, of which 215 (36.6%) were normal weight, 206 (35.0%) were overweight, 98 (16.7%) were obese, and 69 (11.7%) were severely obese. Mean baseline functional limitations were similar between normal weight (2.4), overweight (2.1), and obese patient’s (1.8) (p = 0.24) (Figure 2). However, severely obese patients had more baseline limitations, at 2.9 (p = 0.05). Severely obese patients had fewer mean newly acquired limitations (1.1) than normal weight (1.9), overweight (1.6), or obese patients (2.1), although the differences across BMI category did not meet statistical significance in this relatively small population (p = 0.15). Total limitations following severe sepsis admission were not significantly different by BMI category (p = 0.64).
Figure 2. Functional Limitations Before and After Sepsis Hospitalization.
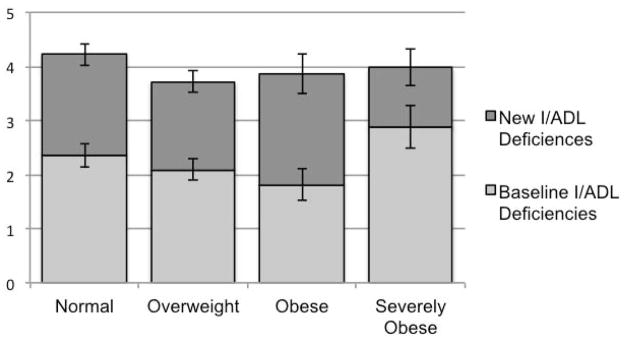
Mean number of functional limitations (±SE) as measured by deficiencies in activities and instrumental activities of daily living (I/ADLs) are depicted. There were differences in baseline limitations (p = 0.05), but no differences in newly acquired or total limitations across BMI categories (p = 0.15 and 0.64, respectively).
DISCUSSION
In this study, we have demonstrated that obesity is common among older Americans with severe sepsis, with nearly a quarter obese or severely obese in our sample. In this nationally representative population, obesity was independently associated with decreased mortality up to one year after hospitalization for sepsis. Obese patients who survive their sepsis hospitalization use more health care resources and require greater Medicare spending in the year following hospital discharge—but this apparent increase in resource use is the result of greater survival, not increased use per day alive. Obese patients were no more likely to experience declines in functional limitations following sepsis hospitalization than were non-obese patients.
While our findings are in concert with several prior studies showing obesity is associated with decreased longer-term mortality in ICU patients(18, 47–49), these results are in direct contradiction to what physicians predict for obese patients(50). With survey data from the HRS, we were able to show that the association between obesity and decreased mortality persists after adjustment for age and important potential confounders unavailable in administrative databases and past work, such as wealth, baseline cognitive status, and baseline functional limitations. Also, by studying a patient population defined by hospital admission for a specific diagnosis and not just a common admission location, we showed that the association is not due to a differential threshold for ICU admission in obese patients (although the possibility of differential threshold for hospital admission still exists). Our results were robust to different classifications of obesity, and were present with prospectively measured BMI, assessed prior to the onset of current illness.
Beyond mortality, obesity was associated with neither better nor worse outcomes in our study. Obese sepsis survivors acquired new functional limitations at a rate similar to normal weight patients. Obese survivors used inpatient health care facilities at a rate similar to normal weight patients—although, as a result of their better mortality, obese patients used significantly more total health care resources in the year following hospital discharge. This last finding may have important public finance implications given the growing prevalence of obesity in new Medicare beneficiaries.
There are many potential reasons for the association between obesity and decreased mortality in sepsis and other critical illnesses. First, it may be due to a true protective effect of excess body weight. This may be the result of an altered inflammatory response to critical illness, as suggested by the attenuated pro-inflammatory cytokine levels in obese ARDS patients(51). Alternatively, obese patients could have a greater capacity to tolerate the extensive weight loss and deconditioning associated with critical illness(52).
The epidemiology and treatment of severe sepsis may also differ by BMI. A recent study by Arabi et al demonstrated that obese patients with septic shock have a lower proportion of gram negative infections, lower proportion of pneumonia, and greater proportion of skin and soft tissue infection(49). Several studies have also shown obesity is associated with greater incidence of renal failure in critical illness(53–55)—a finding present in our dataset as well. While this organ failure meets criteria for severe sepsis, it is associated with relatively better outcomes than respiratory, cardiovascular, or neurologic failures(56). Finally, several studies have shown that obese patients receive different—in some cases better, and in other cases worse—treatment than normal weight patients(49, 57, 58).
We hypothesize that epidemiologic and treatment differences partially explain the survival advantage in obese patients—and that biologic differences may explain the remaining portion of the survival advantage. Further examination of the epidemiologic, treatment, and biologic differences by BMI is certainly warranted with clinically nuanced datasets, but was not possible using our administrative dataset.
There are some potential limitations to our analysis. We used self-reported height and weight which may be under and over-reported, respectively, contributing to a underestimation of BMI (59). Prior analysis of HRS data suggests that reporting errors are small and less problematic when BMI is evaluated as a continuous variable(59). Because HRS surveys occur biennially, there was as much as a 2-year lag between baseline survey and incident sepsis admission (median, 1.1 years). Thus, measures of height, weight, wealth, cognitive status, and functional status may not precisely reflect patient status at the time of sepsis admission. Similarly, there was up to a 2-year lag between hospital discharge and follow-up functional assessment, relevant to the analyses in Figure 2. Many patients did not survive long enough to complete a follow-up assessment. We used a claims-based definition of severe sepsis that, while not as accurate as prospective clinical assessment, has a high positive predictive value and better sensitivity than other claims-based definitions(29). As a result of studying a Medicare population, our patients were mostly over 65 years (mean, 79.0 years). This age group captures only about 60% of adult sepsis admissions nationally (25). Furthermore, because the detrimental effects of obesity may wane with age (44–46), our findings may not apply for younger sepsis patients, although our sensitivity analysis did not suggest that the relationship between BMI and mortality varied by age. We did not include severity of illness measures, such as APACHE scores, as they were not available through our administrative databases— although we instead included presence of acute organ dysfunctions (56). Because our data is from 1999–2005, it may not accurately represent the distribution of BMI in current Medicare beneficiaries hospitalized with sepsis.
Conclusions
In summary, we have shown that obesity is associated with improved short and longer-term mortality in older patients with severe sepsis. Daily health care utilization and newly acquired functional limitations are no worse in obese survivors than those with normal weight. However, as a result of their decreased mortality, obese sepsis survivors use more health care and produce higher Medicare spending in the year following hospitalization.
Supplementary Material
Acknowledgments
Funding: This work was supported by grants K08 HL091249, R01 AG030155, and U01 AG09740 from the National Institutes of Health, and IIR 11-109 from the Department of Veterans Affairs Health Services Research & Development Service. The views expressed in this article are those of the authors and do not necessarily reflect the position or policy of the Department of Veterans Affairs, the National Institutes of Health, or the US government.
The Health and Retirement Study is performed at the Institute for Social Research, University of Michigan. We appreciate the expert programming of Mohammed Kabeto, MS and Laetitia Shapiro, MS, at the University of Michigan. Dr. Prescott has had full access to all the data in the study and takes responsibility for the integrity of the data and the accuracy of the data analysis.
Footnotes
The authors have no relevant potential conflicts of interest to disclose.
References
- 1.Mokdad AH, Serdula MK, Dietz WH, Bowman BA, Marks JS, Koplan JP. The spread of the obesity epidemic in the United States, 1991–1998. JAMA : the journal of the American Medical Association. 1999;282(16):1519–22. doi: 10.1001/jama.282.16.1519. Epub 1999/11/05. [DOI] [PubMed] [Google Scholar]
- 2.Wang Y, Beydoun MA. The obesity epidemic in the United States--gender, age, socioeconomic, racial/ethnic, and geographic characteristics: a systematic review and meta-regression analysis. Epidemiologic reviews. 2007;29:6–28. doi: 10.1093/epirev/mxm007. Epub 2007/05/19. [DOI] [PubMed] [Google Scholar]
- 3.Wang YC, Colditz GA, Kuntz KM. Forecasting the obesity epidemic in the aging U.S. population. Obesity (Silver Spring) 2007;15(11):2855–65. doi: 10.1038/oby.2007.339. Epub 2007/12/12. [DOI] [PubMed] [Google Scholar]
- 4.Iwashyna TJ, Cooke CR, Wunsch H, Kahn JM. Population burden of long-term survivorship after severe sepsis in older Americans. J Am Geriatr Soc. 2012;60(6):1070–7. doi: 10.1111/j.1532-5415.2012.03989.x. Epub 2012/05/31. [DOI] [PMC free article] [PubMed] [Google Scholar]
- 5.Thompson D, Edelsberg J, Colditz GA, Bird AP, Oster G. Lifetime health and economic consequences of obesity. Archives of internal medicine. 1999;159(18):2177–83. doi: 10.1001/archinte.159.18.2177. Epub 1999/10/20. [DOI] [PubMed] [Google Scholar]
- 6.Flegal KM, Graubard BI, Williamson DF, Gail MH. Excess deaths associated with underweight, overweight, and obesity. JAMA : the journal of the American Medical Association. 2005;293(15):1861–7. doi: 10.1001/jama.293.15.1861. Epub 2005/04/21. [DOI] [PubMed] [Google Scholar]
- 7.Flegal KM, Kit BK, Orpana H, Graubard BI. Association of all-cause mortality with overweight and obesity using standard body mass index categories: a systematic review and meta-analysis. JAMA : the journal of the American Medical Association. 2013;309(1):71–82. doi: 10.1001/jama.2012.113905. Epub 2013/01/03. [DOI] [PMC free article] [PubMed] [Google Scholar]
- 8.Mehta NK, Chang VW. Mortality attributable to obesity among middle-aged adults in the United States. Demography. 2009;46(4):851–72. doi: 10.1353/dem.0.0077. Epub 2010/01/21. [DOI] [PMC free article] [PubMed] [Google Scholar]
- 9.Kahn BB, Flier JS. Obesity and insulin resistance. The Journal of clinical investigation. 2000;106(4):473–81. doi: 10.1172/JCI10842. Epub 2000/08/23. [DOI] [PMC free article] [PubMed] [Google Scholar]
- 10.Yang R, Barouch LA. Leptin signaling and obesity: cardiovascular consequences. Circulation research. 2007;101(6):545–59. doi: 10.1161/CIRCRESAHA.107.156596. Epub 2007/09/18. [DOI] [PubMed] [Google Scholar]
- 11.Caballero AE. Endothelial dysfunction in obesity and insulin resistance: a road to diabetes and heart disease. Obesity research. 2003;11(11):1278–89. doi: 10.1038/oby.2003.174. Epub 2003/11/25. [DOI] [PubMed] [Google Scholar]
- 12.Yudkin JS, Stehouwer CD, Emeis JJ, Coppack SW. C-reactive protein in healthy subjects: associations with obesity, insulin resistance, and endothelial dysfunction: a potential role for cytokines originating from adipose tissue? Arteriosclerosis, thrombosis, and vascular biology. 1999;19(4):972–8. doi: 10.1161/01.atv.19.4.972. Epub 1999/04/09. [DOI] [PubMed] [Google Scholar]
- 13.Singer G, Granger DN. Inflammatory responses underlying the microvascular dysfunction associated with obesity and insulin resistance. Microcirculation. 2007;14(4–5):375–87. doi: 10.1080/10739680701283158. Epub 2007/07/07. [DOI] [PubMed] [Google Scholar]
- 14.Akinnusi ME, Pineda LA, El Solh AA. Effect of obesity on intensive care morbidity and mortality: a meta-analysis. Critical care medicine. 2008;36(1):151–8. doi: 10.1097/01.CCM.0000297885.60037.6E. Epub 2007/11/17. [DOI] [PubMed] [Google Scholar]
- 15.Oliveros H, Villamor E. Obesity and mortality in critically ill adults: a systematic review and meta-analysis. Obesity (Silver Spring) 2008;16(3):515–21. doi: 10.1038/oby.2007.102. Epub 2008/02/02. [DOI] [PubMed] [Google Scholar]
- 16.Hogue CW, Jr, Stearns JD, Colantuoni E, Robinson KA, Stierer T, Mitter N, et al. The impact of obesity on outcomes after critical illness: a meta-analysis. Intensive care medicine. 2009;35(7):1152–70. doi: 10.1007/s00134-009-1424-5. Epub 2009/02/04. [DOI] [PubMed] [Google Scholar]
- 17.Hogue CW, Jr, Stearns JD, Colantuoni E, Robinson KA, Stierer T, Mitter N, et al. The impact of obesity on outcomes after critical illness: a meta-analysis. Intensive Care Med. 2009;35(7):1152–70. doi: 10.1007/s00134-009-1424-5. Epub 2009/02/04. [DOI] [PubMed] [Google Scholar]
- 18.O’Brien JM, Jr, Philips GS, Ali NA, Aberegg SK, Marsh CB, Lemeshow S. The association between body mass index, processes of care, and outcomes from mechanical ventilation: a prospective cohort study. Critical care medicine. 2012;40(5):1456–63. doi: 10.1097/CCM.0b013e31823e9a80. Epub 2012/03/21. [DOI] [PubMed] [Google Scholar]
- 19.Hall WB, Willis LE, Medvedev S, Carson SS. The implications of long-term acute care hospital transfer practices for measures of in-hospital mortality and length of stay. American journal of respiratory and critical care medicine. 2012;185(1):53–7. doi: 10.1164/rccm.201106-1084OC. Epub 2011/09/24. [DOI] [PMC free article] [PubMed] [Google Scholar]
- 20.Vasilevskis EE, Kuzniewicz MW, Dean ML, Clay T, Vittinghoff E, Rennie DJ, et al. Relationship between discharge practices and intensive care unit in-hospital mortality performance: evidence of a discharge bias. Medical care. 2009;47(7):803–12. doi: 10.1097/MLR.0b013e3181a39454. Epub 2009/06/19. [DOI] [PubMed] [Google Scholar]
- 21.Kahn JM, Werner RM, Carson SS, Iwashyna TJ. Variation in long-term acute care hospital use after intensive care. Medical care research and review : MCRR. 2012;69(3):339–50. doi: 10.1177/1077558711432889. Epub 2012/02/09. [DOI] [PMC free article] [PubMed] [Google Scholar]
- 22.Gershengorn HB, Iwashyna TJ, Cooke CR, Scales DC, Kahn JM, Wunsch H. Variation in use of intensive care for adults with diabetic ketoacidosis*. Critical care medicine. 2012;40(7):2009–15. doi: 10.1097/CCM.0b013e31824e9eae. Epub 2012/05/09. [DOI] [PMC free article] [PubMed] [Google Scholar]
- 23.Seymour CW, Iwashyna TJ, Ehlenbach WJ, Wunsch H, Cooke CR. Hospital-level variation in the use of intensive care. Health services research. 2012;47(5):2060–80. doi: 10.1111/j.1475-6773.2012.01402.x. Epub 2012/09/19. [DOI] [PMC free article] [PubMed] [Google Scholar]
- 24.Fried TR, Bradley EH, Towle VR, Allore H. Understanding the treatment preferences of seriously ill patients. The New England journal of medicine. 2002;346(14):1061–6. doi: 10.1056/NEJMsa012528. Epub 2002/04/05. [DOI] [PubMed] [Google Scholar]
- 25.Elixhauser A, Friedman B, Stranges E Agency for Healthcare Research and Quality, Thomson Reuters. Septicemia in US Hospitals, 2009. HCUP Statistical Brief #122. Agency for Healthcare Research and Quality; Rockville, MD: Oct, 2011. [cited 2013 Jan. 23]; Available from: http://www.hcup-us.ahrq.gov/reports/statbriefs/sb122.pdf. [Google Scholar]
- 26.Health and Retirement Study. 2012 Oct 18; Available from: http://hrsonline.isr.umich.edu/
- 27.Iwashyna TJ, Ely EW, Smith DM, Langa KM. Long-term cognitive impairment and functional disability among survivors of severe sepsis. JAMA. 2010;304(16):1787–94. doi: 10.1001/jama.2010.1553. Epub 2010/10/28. [DOI] [PMC free article] [PubMed] [Google Scholar]
- 28.Angus DC, Linde-Zwirble WT, Lidicker J, Clermont G, Carcillo J, Pinsky MR. Epidemiology of severe sepsis in the United States: analysis of incidence, outcome, and associated costs of care. Crit Care Med. 2001;29(7):1303–10. doi: 10.1097/00003246-200107000-00002. Epub 2001/07/11. [DOI] [PubMed] [Google Scholar]
- 29.Iwashyna TJ, Odden A, Rohde J, Bonham C, Kuhn L, Malani P, et al. Identifying Patients With Severe Sepsis Using Administrative Claims: Patient-Level Validation of the Angus Implementation of the International Consensus Conference Definition of Severe Sepsis. Med Care. 2012 doi: 10.1097/MLR.0b013e318268ac86. Epub 2012/09/25. [DOI] [PMC free article] [PubMed] [Google Scholar]
- 30.Deyo RA, Cherkin DC, Ciol MA. Adapting a clinical comorbidity index for use with ICD-9-CM administrative databases. Journal of clinical epidemiology. 1992;45(6):613–9. doi: 10.1016/0895-4356(92)90133-8. Epub 1992/06/01. [DOI] [PubMed] [Google Scholar]
- 31.Esper AM, Moss M, Martin GS. The effect of diabetes mellitus on organ dysfunction with sepsis: an epidemiological study. Crit Care. 2009;13(1):R18. doi: 10.1186/cc7717. Epub 2009/02/17. [DOI] [PMC free article] [PubMed] [Google Scholar]
- 32.Quan H, Parsons GA, Ghali WA. Validity of procedure codes in International Classification of Diseases, 9th revision, clinical modification administrative data. Med Care. 2004;42(8):801–9. doi: 10.1097/01.mlr.0000132391.59713.0d. Epub 2004/07/20. [DOI] [PubMed] [Google Scholar]
- 33.Wunsch H, Linde-Zwirble WT, Angus DC, Hartman ME, Milbrandt EB, Kahn JM. The epidemiology of mechanical ventilation use in the United States. Crit Care Med. 2010;38(10):1947–53. doi: 10.1097/CCM.0b013e3181ef4460. Epub 2010/07/20. [DOI] [PubMed] [Google Scholar]
- 34.Fonda S, Herzog AR. Documentation of Physical Functionaing Measured in the Health and Retirement Study and the Asset and Health Dynamics amonth the Oldest Old Study. Ann Arbor, MI: 2004. [Google Scholar]
- 35.RAND Income and Wealth Imputation Files. RAND Center for the Study of Aging; [cited 2013 March 12]; Available from: http://hrsonline.isr.umich.edu/modules/meta/rand/README_incwlth.pdf. [Google Scholar]
- 36.US Department of Commerce Bureau of Economic Analysis Website. 2012 [updated October 26, 2012; cited 2012 November 27, 2012]; Available from: http://www.bea.gov/iTable/iTable.cfm?ReqID=9&step=1.
- 37.Hajat A, Kaufman JS, Rose KM, Siddiqi A, Thomas JC. Do the wealthy have a health advantage? Cardiovascular disease risk factors and wealth. Soc Sci Med. 2010;71(11):1935–42. doi: 10.1016/j.socscimed.2010.09.027. Epub 2010/10/26. [DOI] [PMC free article] [PubMed] [Google Scholar]
- 38.Iwashyna TJ. On the Detection of Nursing Home Use in Medicare Claims. Health Serv Outcomes Res Methodol. 2003;4(3):187–96. [Google Scholar]
- 39.Yun H, Kilgore ML, Curtis JR, Delzell E, Gary LC, Saag KG, et al. Identifying types of nursing facilities using medicare claims data: an algorithm and validation. Health Serv Outcomes Res Method. 2010;10:100–10. [Google Scholar]
- 40.BMI Classification. World Health Organization; 2013. [cited 2013 March 5]; Available from: http://apps.who.int/bmi/index.jsp?introPage=intro_3.html. [Google Scholar]
- 41.Finkielman JD, Gajic O, Afessa B. Underweight is independently associated with mortality in post-operative and non-operative patients admitted to the intensive care unit: a retrospective study. BMC emergency medicine. 2004;4(1):3. doi: 10.1186/1471-227X-4-3. Epub 2004/10/07. [DOI] [PMC free article] [PubMed] [Google Scholar]
- 42.O’Brien JM, Jr, Phillips GS, Ali NA, Lucarelli M, Marsh CB, Lemeshow S. Body mass index is independently associated with hospital mortality in mechanically ventilated adults with acute lung injury. Critical care medicine. 2006;34(3):738–44. doi: 10.1097/01.CCM.0000202207.87891.FC. Epub 2006/03/08. [DOI] [PMC free article] [PubMed] [Google Scholar]
- 43.Cuzick J. A Wilcoxon-type test for trend. Statistics in medicine. 1985;4(1):87–90. doi: 10.1002/sim.4780040112. Epub 1985/01/01. [DOI] [PubMed] [Google Scholar]
- 44.Diehr P, Bild DE, Harris TB, Duxbury A, Siscovick D, Rossi M. Body mass index and mortality in nonsmoking older adults: the Cardiovascular Health Study. American journal of public health. 1998;88(4):623–9. doi: 10.2105/ajph.88.4.623. Epub 1998/04/29. [DOI] [PMC free article] [PubMed] [Google Scholar]
- 45.Bender R, Jockel KH, Trautner C, Spraul M, Berger M. Effect of age on excess mortality in obesity. JAMA : the journal of the American Medical Association. 1999;281(16):1498–504. doi: 10.1001/jama.281.16.1498. Epub 1999/05/05. [DOI] [PubMed] [Google Scholar]
- 46.Stevens J, Cai J, Pamuk ER, Williamson DF, Thun MJ, Wood JL. The effect of age on the association between body-mass index and mortality. The New England journal of medicine. 1998;338(1):1–7. doi: 10.1056/NEJM199801013380101. Epub 1998/01/01. [DOI] [PubMed] [Google Scholar]
- 47.Peake SL, Moran JL, Ghelani DR, Lloyd AJ, Walker MJ. The effect of obesity on 12-month survival following admission to intensive care: a prospective study. Critical care medicine. 2006;34(12):2929–39. doi: 10.1097/01.CCM.0000248726.75699.B1. Epub 2006/11/01. [DOI] [PubMed] [Google Scholar]
- 48.Abhyankar S, Leishear K, Callaghan FM, Demner-Fushman D, McDonald CJ. Lower short- and long-term mortality associated with overweight and obesity in a large cohort study of adult intensive care unit patients. Crit Care. 2012;16(6):R235. doi: 10.1186/cc11903. Epub 2012/12/20. [DOI] [PMC free article] [PubMed] [Google Scholar]
- 49.Arabi YM, Dara SI, Tamim HM, Rishu AH, Bouchama A, Khedr MK, et al. Clinical characteristics, sepsis interventions and outcomes in the obese patients with septic shock: an international multicenter cohort study. Crit Care. 2013;17(2):R72. doi: 10.1186/cc12680. Epub 2013/04/19. [DOI] [PMC free article] [PubMed] [Google Scholar]
- 50.O’Brien JM, Jr, Aberegg SK, Ali NA, Diette GB, Lemeshow S. Results from the national sepsis practice survey: predictions about mortality and morbidity and recommendations for limitation of care orders. Crit Care. 2009;13(3):R96. doi: 10.1186/cc7926. Epub 2009/06/25. [DOI] [PMC free article] [PubMed] [Google Scholar]
- 51.Stapleton RD, Dixon AE, Parsons PE, Ware LB, Suratt BT. The Association between Body Mass Index and Plasma Cytokine Levels in Patients with Acute Lung Injury. Chest. 2010 doi: 10.1378/chest.10-0014. Epub 2010/05/04. [DOI] [PMC free article] [PubMed] [Google Scholar]
- 52.Herridge MS, Cheung AM, Tansey CM, Matte-Martyn A, Diaz-Granados N, Al-Saidi F, et al. One-year outcomes in survivors of the acute respiratory distress syndrome. The New England journal of medicine. 2003;348(8):683–93. doi: 10.1056/NEJMoa022450. Epub 2003/02/21. [DOI] [PubMed] [Google Scholar]
- 53.Druml W, Metnitz B, Schaden E, Bauer P, Metnitz PG. Impact of body mass on incidence and prognosis of acute kidney injury requiring renal replacement therapy. Intensive care medicine. 2010;36(7):1221–8. doi: 10.1007/s00134-010-1844-2. Epub 2010/03/17. [DOI] [PubMed] [Google Scholar]
- 54.Shashaty MG, Meyer NJ, Localio AR, Gallop R, Bellamy SL, Holena DN, et al. African American race, obesity, and blood product transfusion are risk factors for acute kidney injury in critically ill trauma patients. Journal of critical care. 2012;27(5):496–504. doi: 10.1016/j.jcrc.2012.02.002. Epub 2012/05/18. [DOI] [PMC free article] [PubMed] [Google Scholar]
- 55.Soto GJ, Frank AJ, Christiani DC, Gong MN. Body mass index and acute kidney injury in the acute respiratory distress syndrome. Critical care medicine. 2012;40(9):2601–8. doi: 10.1097/CCM.0b013e3182591ed9. Epub 2012/06/27. [DOI] [PMC free article] [PubMed] [Google Scholar]
- 56.Lone NI, Walsh TS. Impact of Intensive Care Unit Organ Failures on Mortality during the Five Years after a Critical Illness. American journal of respiratory and critical care medicine. 2012;186(7):640–7. doi: 10.1164/rccm.201201-0059OC. Epub 2012/07/28. [DOI] [PubMed] [Google Scholar]
- 57.O’Brien JM, Jr, Philips GS, Ali NA, Aberegg SK, Marsh CB, Lemeshow S. The association between body mass index, processes of care, and outcomes from mechanical ventilation: a prospective cohort study. Crit Care Med. 2012;40(5):1456–63. doi: 10.1097/CCM.0b013e31823e9a80. Epub 2012/03/21. [DOI] [PubMed] [Google Scholar]
- 58.Chang VW, Asch DA, Werner RM. Quality of care among obese patients. JAMA. 2010;303(13):1274–81. doi: 10.1001/jama.2010.339. Epub 2010/04/08. [DOI] [PubMed] [Google Scholar]
- 59.Meng H, He XZ, Dixon D. Self-reported versus measured height and weight in the health and retirement study. Journal of the American Geriatrics Society. 2010;58(2):412–3. doi: 10.1111/j.1532-5415.2009.02713.x. Epub 2010/04/08. [DOI] [PubMed] [Google Scholar]
Associated Data
This section collects any data citations, data availability statements, or supplementary materials included in this article.