

Abstract
INTRODUCTION
Better measures of liver transplant risk stratification are needed. Our previous work noted a strong relationship between psoas muscle area and survival following liver transplantation. The dorsal muscle group is easier to measure but it is unclear if they are also correlated with surgical outcomes.
METHODS
Our study population included liver transplant recipients with a preoperative CT scan. Cross-sectional areas of the dorsal muscle group at the T12 vertebral level were measured. The primary outcomes for this study were 1 and 5-year mortality and 1-year complications. The relationship between dorsal muscle group area and post-transplantation outcome was assessed using univariate and multivariate techniques.
RESULTS
Dorsal muscle group area measurements were strongly associated with psoas area (r = 0.72; p < 0.001). Postoperative outcome was observed from 325 patients. Multivariate logistic regression revealed dorsal muscle group area to be a significant predictor of 1-year mortality (odds ratio [OR] = 0.53, p = 0.001,) and 5-year mortality (OR = 0.53, p < 0.001), and 1-year complications (OR = 0.67, p = 0.007).
CONCLUSION
Larger dorsal muscle group muscle size is associated with improved post-transplantation outcomes. The muscle is easier to measure and may represent a clinically relevant postoperative risk factor.
Keywords: Dorsal muscle group, Psoas muscle, Morphometric measure, Liver transplant, End-stage liver disease, Sarcopenia, Surgical Outcome, Risk stratification
Introduction
Measuring disease severity for patients with end-stage liver disease (ESLD) is a continuous challenge for liver transplant surgeons and there is a critical need for better methods of risk stratification. Currently, the liver allocation system emphasizes a “sickest-first” priority.1 Surgeons rely on a subjective assessment of a patient’s global health status - a method often referred to as the “eyeball test”.2 This judgment is subjective and neither robust nor reliable. In contrast, preoperative imaging can provide objective measures of overall disease burden.
Pre-transplant cross-sectional imaging holds vast amount of patient-specific data that can aid in prognostication. Within this context, our previous work has shown that using analytic morphomic techniques can provide important information regarding post-operative outcomes. Trunk muscle size—specifically the psoas muscle—is an objective measure of surgical risk in multiple surgical specialties.3–7 However, measurement of the psoas muscle is only available on abdominal scans. The central location of the psoas muscle makes ultrasound imaging difficult, hindering prospective and repeated data collection. Alternatively, dorsal muscle group is easier to obtain on both CT and ultrasound imaging and may facilitate prospective studies on sarcopenia.
In this retrospective manuscript, we investigate the relationship between dorsal muscle group cross-sectional area and post-liver transplantation outcomes at a single institution. We hypothesize that larger dorsal muscle cross-sectional area will be correlated with larger psoas area and associated with improved surgical outcomes. Overall, this study investigates the utility of dorsal muscle group size as a clinically relevant postoperative risk factor and the potential alternative to measures of psoas area. Investigation of these measures may improve our understanding of the mechanisms of liver disease and sarcopenia.
Methods
Study Population
Our study cohort included adult (≥18 years old) patients who underwent liver transplantation at the University of Michigan Transplant Center between 2000 and 2011. 90-day perioperative CT scans were collected, and eligible scans had available dorsal muscle group and psoas muscle measurements. Recipient age, race, gender, BMI, preoperative serum albumin, MELD score, hepatitis C virus (HCV) positivity, presence of hepatocellular carcinoma (HCC), presence of diabetes, presence of hypertension, pack years of smoking, and donor age were retrospectively collected for all patients.
Analytic Morphomics
Dorsal muscle group area is defined as any muscle contained within the region posterior to the spine and ribs, and no more lateral than the lateral-most edges of the erector spinae muscles. CT scans were processed by the following steps using semi-automated algorithms in MATLAB v13.0. Initially, scans were labeled at each vertebral level to provide anatomical landmarks for subsequent measurements. Next, a posterior muscle line was drawn on abdominal and thoracic slices separating muscle from subcutaneous fat. Points were placed at the lateral-most clefts of the erector spinae muscle. An area was mapped out between these points, the central point of the spinal canal, and the posterior muscle line. Within this region, dorsal muscle group size was calculated based on density thresholds. Our primary measurement was the dorsal muscle group cross-sectional area at the T12 vertebral level, which is more commonly present in both thoracic and abdominal scans. Total psoas area was also measured as described in our previous work (5). This entailed using a transverse slice of L4 to outline the psoas muscles. This cross-sectional area was computed as the total psoas area. Figure 1 illustrates these analytic morphomics techniques.
Figure 1.
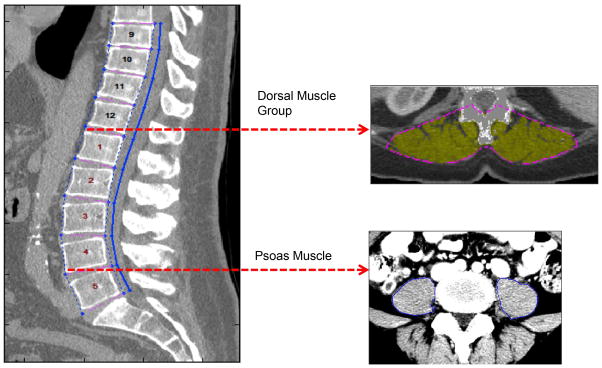
Preoperative CT imaging was used to measure psoas and dorsal muscle group size. After identifying individual vertebral levels, the imaging slices at the inferior aspects of L4 and T12 vertebrae were selected. The total cross-sectional area of the psoas muscles was measured at the L4 level; dorsal muscle group area was measured at the T12 vertebrae.
Outcomes
Primary outcomes were defined as overall post-transplant survival, 1-year post-transplant mortality, and 5-year post-transplant mortality. Patient death was determined using the Social Security Death Master Index. Additional outcomes included postoperative complications within 1 year of liver transplant. These 1-year complications were identified as renal failure, sepsis, bacterial infection (abscess, peritonitis, cholangitis), multiple organ system failure, bleeding, bile leak, pneumonia, respiratory failure, cardiac event (myocardial infarction, arrest, congestive heart failure), biliary stricture, graft failure, thrombosis, Clostridium difficile infection, acute rejection, and pulmonary embolus.
Data Analysis
Descriptive statistics were computed for the study cohort. Continuous variables were summarized by mean, standard deviation, and histograms. Comparisons were made using a Student’s t-test. Categorical variables were summarized with frequency tables and compared using Fisher’s exact test. The relationship between dorsal muscle group and psoas muscle size was assessed using a Pearson correlation.
The covariate-adjusted effect of dorsal muscle group cross-sectional area on overall post-transplant survival was ascertained using the Cox proportional hazards regression model. Patients began follow-up at the time of liver transplantation and were censored at loss of follow-up or subsequent transplantation. Logistic regression was used to assess the covariate-adjusted effect of dorsal muscle group area on 1-year mortality, 5-year mortality, and 1-year incidence of complications. For the Cox and logistic models, backward stepwise selection was used for model selection. For each outcome, univariate regression was used to identify potential predictors of outcome. Candidate predictors (threshold p ≤ 0.25) from the univariate analysis were then entered into their respective models, and backward stepwise selection was used to produce the final subset of adjustment covariates. Age and gender were included in the models regardless of statistical significance. Initially, dorsal muscle group area was the only morphometric factor included in these models. Later, total psoas area was substituted for dorsal muscle group area in each model to enable comparisons between the two measures. The predictive ability of each logistic model was assessed using the area under the receiver operating characteristic (AUROC). Patients were grouped into gender-stratified tertiles of dorsal muscle group area and total psoas area to facilitate comparison between groups.
All analyses were performed using Stata 13.0 (StataCorp LP, College Station, Texas). A two-sided significance of α = 0.05 was used for all analyses. This study was approved by the University of Michigan Institutional Review Board.
Results
A total of 325 met our inclusion criteria. 39.1% of the cohort was female (n = 127), and the mean age at transplant was 52.0 ± 9.6 years. Mean laboratory MELD score at the time of transplantation was 18.3 ± 7.7. Descriptive and clinical characteristics for the study population are displayed in Table 1, stratified by tertiles of dorsal muscle group area. Compared to patients in the largest tertile of dorsal muscle group area, patients in the smallest tertile had a significantly greater MELD score (p = 0.034), greater BMI (p < 0.001), greater total psoas area (p < 0.001), and were significantly more likely to have HCC (p = 0.002).
Table 1.
Patient Characteristics of Study Population (n=325) Stratified by Tertiles of Dorsal Muscle Group Area at T12
| Mean ± SD, or %(N) | ||||
|---|---|---|---|---|
| Smallest Tertile | Middle Tertile | Largest Tertile | p-value (Comparison between largest and smallest tertile) | |
| N | 108 | 108 | 109 | |
| Age at txp | 50.45 ±11.31 | 53.39 ± 9.41 | 51.60 ±8.77 | 0.805 |
| % Non-White | 11.32% (12) | 16.67% (18) | 19.27% (21) | 0.129 |
| Dorsal Muscle (1000 mm2) | 2.09 ± 0.34 | 2.95 ± 0.24 | 4.23 ± 0.75 | < 0.001 |
| Psoas (1000 mm2) | 1.28 ± 0.29 | 1.94 ± 0.19 | 2.79 ±0.43 | < 0.001 |
| BMI (kg/m2) | 26.54 ± 6.55 | 27.63 ± 5.79 | 30.09 ± 5.68 | < 0.001 |
| Diabetes | 25.93% (28) | 28.70% (31) | 30.09% (32) | 0.648 |
| Hypertension | 43.52% (47) | 51.85 (56) | 50.93% (55) | 0.336 |
| Cirrhosis | 43.52% (47) | 38.89% (42) | 38.53% (42) | 0.578 |
| Pack Years Smoking | 9.94 ±16.43 | 14.33 ±19.07 | 12.50 ±16.82 | 0.257 |
| HCC | 27.78% (30) | 40.74% (44) | 48.62% (53) | 0.002 |
| HCV | 14.81% (16) | 29.63% (32) | 41.28% (45) | 0.578 |
| MELD | 19.25 ±7.98 | 18.50 ±7.68 | 17.01 ± 7.27 | 0.034 |
| Preop Albumin | 2.85 ± 0.69 | 2.75 ± 0.57 | 2.85 ± 0.67 | 0.984 |
Dorsal muscle group area was normally distributed across the study cohort (Figure 2). Further, dorsal muscle group area was significantly larger (p < 0.001) in males compared to females (3.39 ± 1.04 1000 mm2 vs 2.53 ± 0.74 1000 mm2, respectively). Linear regression demonstrated a strong positive correlation between dorsal muscle group size and total psoas area (r = 0.72, p < 0.001). Figure 3 presents this significant correlation.
Figure 2.

Histogram of dorsal muscle group area at T12. The distribution was normally distributed among both genders. Male dorsal muscle group area was significantly greater than that of females (p < 0.001).
Figure 3.

The relationship between total psoas area and dorsal muscle group area demonstrates a strong, significant association, with psoas area increasing with dorsal muscle group area.
Overall Survival
Cox regression revealed that covariate-adjusted mortality decreased significantly as dorsal muscle group area increased (hazard ratio [HR] = 0.62 per standard deviation increase in dorsal muscle group area, 95% CI: 0.49–0.77, p < 0.001). Also included in the model were age (hazard ratio [HR] = 1.02 per standard deviation increase in dorsal muscle group area, 95% CI: 1.00–1.05, p = 0.050), diabetes (hazard ratio [HR] = 1.80 per standard deviation increase in dorsal muscle group area, 95% CI: 1.20–2.70, p = 0.004), HCV positivity (hazard ratio [HR] = 2.00 per standard deviation increase in dorsal muscle group area, 95% CI: 1.34–2.98, p = 0.001), and female gender (hazard ratio [HR] = 1.43 per standard deviation increase in dorsal muscle group area, 95% CI: 0.96–2.13, p = 0.075).
Figure 4 shows the covariate adjusted hazard ratios for dorsal muscle group area across its observed range. The reference dorsal muscle group area (HR = 1) is 3.05 (1000 mm2), which is the mean area, standardized by gender. According to the Figure 4, the HR for a patient with dorsal muscle group area = 4.07 (1000 mm2) was HR = 0.62, indicating that patients with dorsal muscle group area that is one standard deviation above the mean have a 38% lower hazards of dying compared to the mean.
Figure 4.

Cox model shows the effect of dorsal muscle group area on mortality following liver transplantation, as quantified with covariate-adjusted hazard ratios (HR). The reference dorsal muscle group area (HR = 1) is 3.05 1000 mm2, which is the mean area, standardized by gender. The hazard ratio for a patient with dorsal muscle group area that is one standard deviation larger than the mean area was HR = 0.617 (p < 0.001), indicating a 38% decrease in post-transplantation mortality rate per standard deviation increase in muscle area.
1-Year Mortality
Multivariate logistic regression was used with 1-year mortality as the binary outcome. Dorsal muscle group area was a significant predictor of outcome (odds ratio [OR] = 0.53 per standard deviation increase in dorsal muscle group area, 95% CI: 0.36–0.78, p = 0.001,). Other covariates in the model included female gender (p = 0.046), age at transplant (p = 0.014), preoperative serum albumin (p = 0.035), and donor age (p = 0.083). The AUROC for this model was 0.74. When total psoas area was substituted for dorsal muscle group using the same model, this measure was also a significant predictor of 1-year mortality (OR = 0.43 per standard deviation increase in psoas area, 95% CI: 0.30–0.62, p < 0.001). The AUROC for this model was 0.77. Including both muscle measurements in the same model had no significant effect on predictive ability (AUROC = 0.75). The covariates from these models were used to calculate adjusted 1-year mortality rates. Figure 5–A displays these rates stratified by tertiles of dorsal muscle group and psoas size. Patients with the largest dorsal muscle group area had a 3.3 fold lower 1-year mortality rate compared to patients with the smallest muscle area (7.6% vs. 34.9%). Similarly, patients with the largest psoas area had a 3.9 fold lower 1-year mortality rate compared to the group with the smallest psoas area (6.7% vs. 26.3%).
Figure 5.

A, 1-year post-liver transplant mortality. The adjusted 1-year mortality rate of the largest dorsal muscle area group was 7.6% compared with 24.9% for the smallest, and was 6.7% for the largest total psoas area group compared with 26.3% for the smallest.
B, 5-year post-liver transplant mortality. The adjusted 5-year mortality rate of the largest dorsal muscle area group was 10.0% compared with 62.3% for the smallest, and was 10.5% for the largest total psoas area group compared with 57.7% for the smallest.
5-Year Mortality
Multivariate logistic regression demonstrated dorsal muscle group area as a significant predictor of 5-year mortality (odds ratio [OR] = 0.53 per standard deviation increase in dorsal muscle group area, 95% CI: 0.38–0.70, p < 0.001); also significant in the model were female gender (p = 0.048), HCV positivity (p = 0.003), and diabetes (p = 0.026). Although transplant age was not significant (p = 0.145), it remained in the model due to its clinical relevance. The AUROC for this model was 0.70. When total psoas area was substituted for dorsal muscle group area using the same model, psoas area was a strong of a predictor of 1-year mortality (odds ratio [OR] = 0.43 per standard deviation increase in psoas area, 95% CI: 0.30–0.62, p < 0.001). The AUROC for this model was 0.71. Including both muscle measurements in the same model had no significant effect on predictive ability (AUROC = 0.71). Figure 5–B displays covariate-adjusted 5-year mortality rates stratified by dorsal muscle group and psoas area. Patients in the with the largest dorsal muscle group area had a 6.2 fold lower 5-year mortality rate than the smallest group (10% vs. 62.3%). Similarly, patients with the largest psoas area had a 5.5 fold lower 5-year mortality rate compared to those with the smallest psoas area (10.5% vs. 57.7%).
Complications
Dorsal muscle group area was also a significant predictor of post-transplant complications within 1 year (odds ratio [OR] = 0.67 per increase in standard deviation of dorsal muscle group area, 95% CI: 0.50–0.90, p = 0.007); also significant in the model were pack years (p = 0.025), HCC (p = 0.001), and donor age (p = 0.045). Neither transplant age (p = 0.719) nor female gender (p = 0.144) were significant but both were kept in the model. The AUROC for this model was 0.72. Total psoas area was substituted for dorsal muscle group area using the same model, revealing psoas area to be a significant predictor of 1-year complications (odds ratio [OR] = 0.48 per increase in standard deviation of psoas area, 95% CI: 0.32–0.72, p < 0.001). The AUROC for the psoas model was 0.73. Including both muscle groups in the model had no significant effect on its predictive ability (AUROC = 0.74). Covariate-adjusted incidence of 1-year complications was stratified into tertiles of both dorsal muscle group and psoas area. The group with the largest dorsal muscle group area had a 1.3 fold lower complication rate compared to the smallest group (69.8% vs. 90.3%). Similarly, patients with the largest psoas area had a 1.4 fold lower 1-year adjusted complicate rate than the group with the smallest psoas area (66.1% vs. 90.5%).
Discussion
In this study, we demonstrate that dorsal muscle group area is a significant independent risk factor in liver transplant recipients. We have demonstrated that patients with larger dorsal muscle group area have improved survival and fewer complications post-transplantation. The correlation between dorsal muscle group area and total psoas area suggests that either of these core muscles may serve as measure of physiologic reserve and a target for risk stratification.
The predictive ability of morphometric assessment is becoming more recognized in scientific literature.3–9 Several studies have shown sarcopenic patients having poorer outcomes when compared to their peers, including in liver transplantation. 3,10 While considered a facet of aging, sarcopenia has also been identified as an independent predictor of surgical outcome.2,3,6,10–12 Sarcopenia is a major feature of ESLD; liver dysfunction results in protein malnutrition, which accelerates muscle loss in cirrhotic patients.10,11 Potentially, morphometric assessment can help better understand the pathophysiology of ESLD.
While total psoas area has been shown to be a robust and reproducible measure of risk, there are limitations to its utility. When measured, psoas cross-sectional area was assessed at the L4 vertebral level. An important consideration in selecting a morphometric measure is its location relative to the area of pathology. Since the L4 vertebra is inferior to the liver, radiographic workups may not always capture the region needed for adequate psoas measurement. This study aims to contribute to the existing body of literature by proposing a potentially novel risk factor that is easier to obtain. Dorsal muscle group measurements were taken at the T12 vertebra, which is often included on both thoracic and abdominal CT scans. In this context, the dorsal muscle group’s proximity to the liver makes it more likely to be included in patient scans.
Considering the risks of CT imaging, ultrasound imaging could serve as a safer alternative. Visibility has made the psoas muscle difficult to capture via ultrasound. However, the dorsal muscle group spans the entire length of the thorax and abdomen, making them easier to image via ultrasound, which could provide a prospective and dynamic assessment of muscle size. Ultrasound measurements of muscle size would have to be compared to that of CT imaging in order to determine its utility as a measure of risk stratification. If dorsal muscle group area were to prove measurable via ultrasound, this method would be a fast, low-risk measure to assess sarcopenia.
There are important limitations of this study. This was a retrospective study and is subject to the inherent biases of that approach. Although this is a single-institution experience and cannot be representative of a larger transplant population, we feel that the methodology of this study validates the introduction of a novel measure of risk stratification. Second, patients undergoing high-risk surgery tend to have higher complication rates. Within this context, liver transplant recipients are often more frail due to disease severity, which in addition to the physiological stresses of transplantation, could have a confounding effect on the incidence of complications.
In the future, morphometric assessment can inform decision regarding candidate appropriateness as well as aid in the selection of patients for pre-transplant optimization programs. Potentially, a further understanding of the mechanisms of liver disease and sarcopenia could help in the design of targeted interventions that delay functional decline, which in specific cases have been associated with improved outcome.13,14 Future studies can generalize our findings by investigating the relationship regarding dorsal muscle group size, patients without chronic illness, and outcomes of other major surgical operations.
Acknowledgments
Dr. M.J.E is supported by NIH-NIDDK (K08 DK0827508) and the Blue Cross Blue Shield of Michigan Foundation.
Footnotes
C.S.L., D.C.C., M.N.T., Dr. S.C.W., and Dr. M.J.E. contributed to the conception of the study. C.S.L., M.N.T., L.M.T., E.V., L.D.C., A.A.M., and P.W.U contributed to the data collection. C.S.L. and D.C.C. contributed to the data analysis and interpretation. C.S.L. did the writing of the article. C.S.L., Dr. M.J.E., D.C.C, M.N.T, and Dr E.T.C. contributed to the critical revision of the article. Dr. S.C.W., Dr C.J.S., and Dr. M.J.E. allocated the funding.
References
- 1.Schaubel DE, Sima CS, Goodrich NP, Feng S, Merion RM. The survival benefit of deceased donor liver transplantation as a function of candidate disease severity and donor quality. Am J Transplant. 2008;8:419–425. doi: 10.1111/j.1600-6143.2007.02086.x. [DOI] [PubMed] [Google Scholar]
- 2.Englesbe MJ. Quantifying the Eyeball Test : Sarcopenia, Analytic Morphomics, and Liver Transplantation. 2012:1136–1137. doi: 10.1002/lt. [DOI] [PubMed] [Google Scholar]
- 3.Englesbe MJ, Patel SP, He K, et al. Sarcopenia and mortality after liver transplantation. J Am Coll Surg. 2010;211:271–278. doi: 10.1016/j.jamcollsurg.2010.03.039. [DOI] [PMC free article] [PubMed] [Google Scholar]
- 4.Lee JS-J, He K, Harbaugh CM, et al. Frailty, core muscle size, and mortality in patients undergoing open abdominal aortic aneurysm repair. J Vasc Surg. 2011;53:912–7. doi: 10.1016/j.jvs.2010.10.111. [DOI] [PubMed] [Google Scholar]
- 5.Englesbe MJ, Lee JS, He K, et al. Analytic Morphomics, Core Muscle Size, and Surgical Outcomes. Ann Surg. 2012;256:255–261. doi: 10.1097/SLA.0b013e31826028b1. [DOI] [PubMed] [Google Scholar]
- 6.Sheetz KH, Zhao L, Holcombe SA, et al. Decreased core muscle size is associated with worse patient survival following esophagectomy for cancer. Dis Esophagus. 2013;26:716–722. doi: 10.1111/dote.12020. [DOI] [PMC free article] [PubMed] [Google Scholar]
- 7.Waits Sa, Kim EK, Terjimanian MN, et al. Morphometric age and mortality after liver transplant. JAMA Surg. 2014;149(4):335–40. doi: 10.1001/jamasurg.2013.4823. [DOI] [PubMed] [Google Scholar]
- 8.Agnew SP, Small W, Wang E, Smith LJ, Hadad I, Dumanian GA. Prospective measurements of intra-abdominal volume and pulmonary function after repair of massive ventral hernias with the components separation technique. Ann Surg. 2010;251:981–988. doi: 10.1097/SLA.0b013e3181d7707b. [DOI] [PubMed] [Google Scholar]
- 9.Tandon P, Ney M, Irwin I, et al. Severe muscle depletion in patients on the liver transplant wait list: Its prevalence and independent prognostic value. Liver Transplant. 2012;18:1209–1216. doi: 10.1002/lt.23495. [DOI] [PubMed] [Google Scholar]
- 10.Masuda T, Shirabe K, Ikegami T, et al. Sarcopenia Is a Prognostic Factor in Living Donor Liver Transplantation. 2014:401–407. doi: 10.1002/lt. [DOI] [PubMed] [Google Scholar]
- 11.Kaido T, Ogawa K, Fujimoto Y, et al. Impact of Sarcopenia on Survival in Patients Undergoing Living Donor Liver Transplantation. 2013:1549–1556. doi: 10.1002/ajt.12221. [DOI] [PubMed] [Google Scholar]
- 12.Peng P, Hyder O, Firoozmand A, et al. Impact of Sarcopenia on Outcomes Following Resection of Pancreatic Adenocarcinoma. J Gastrointest Surg. 2012;16:1478–1486. doi: 10.1007/s11605-012-1923-5. [DOI] [PMC free article] [PubMed] [Google Scholar]
- 13.Rolland Y, Czerwinski S, Van Kan GA, et al. Sarcopenia: Its assessment, etiology, pathogenesis, consequences and future perspectives. J Nutr Heal Aging. 2008;12:433–450. doi: 10.1007/BF02982704. [DOI] [PMC free article] [PubMed] [Google Scholar]
- 14.Lee DS, Mathur AK, Acker WB, et al. Effects of smoking on survival for patients with end-stage liver disease. J Am Coll Surg. 2009;208(6):1077–84. doi: 10.1016/j.jamcollsurg.2009.01.050. [DOI] [PubMed] [Google Scholar]