

Abstract
Background
Diffuse abnormalities are known to occur within the brain tissue of multiple sclerosis (MS) patients which is ‘normal appearing’ on T1-weighted and T2-weighted magnetic resonance images.
Objectives
With the goal of exploring the sensitivity of novel MRI parameters to detect such abnormalities, we implemented an inversion-prepared magnetization transfer (MT) protocol and adiabatic T1ρ and T2ρ rotating frame relaxation methods.
Methods
Nine relapsing-remitting MS patients and seven healthy controls were recruited. Relaxation parameters were measured in a single slice just above the lateral ventricles and approximately parallel to AC-PC line.
Results
The MT ratio of regions encompassing the normal appearing white matter (NAWM) was different in MS patients as compared with controls (p=0.043); however the T1 measured during off-resonance irradiation (T1sat) was substantially more sensitive than the MT ratio for detecting differences between groups (p=0.0006). Adiabatic T1ρ was significantly prolonged in the NAWM of MS patents as compared to controls (by 6%, p=0.026), while no differences were found among groups for T2ρ. No differences among groups were observed in the cortical grey matter for any relaxation parameter.
Conclusions
The results suggest degenerative processes occurring in the NAWM of MS, likely not accompanied by significant abnormalities in iron content.
Keywords: MRI, multiple sclerosis, relapsing-remitting, rotating frame relaxation, inversion-prepared MT, adiabatic pulses
Introduction
Multiple sclerosis (MS) is the most common chronic inflammatory demyelinating disease of the central nervous system, and is the most common cause of nontraumatic neurologic disability in young adults in North America and Europe.1 Conventional MR imaging in MS patients shows characteristic T2 bright, T1 dark, and T1 contrast-enhancing lesions. Diffuse abnormalities also occur within brain tissue that is ‘normal appearing’ on T1-weighted and T2-weighted magnetic resonance images.
Magnetization transfer (MT) imaging generates contrast by utilizing the exchange of magnetization between bulk water protons and protons within macromolecules.2 Several studies have shown the utility of MT imaging in MS, and have been discussed previously in a thoughtful review.3 Changes measured in MT ratio (MTR) have been histologically correlated with demyelination, axonal degeneration and microglial activation.4-6 MTR imaging was found to detect changes in brain white matter prior to the development of conventional lesions.7 Additionally, abnormalities in the normal-appearing white matter (NAWM) of MS patients have been observed when compared to healthy subjects, as measured by the MTR and by the bound-proton fraction.8-10 Differences of MTR in the normal-appearing grey matter (NAGM) have also been reported but are more difficult to reproduce.8, 11-13 Quantification of T1 and T2 relaxograms has likewise revealed subtle abnormalities of NAWM and NAGM in MS.14, 15 Finally, MTR values in MS correlate with disease severity measures,16, 17 and seem to provide an independent predictor of clinical progression apart from lesion burden.18 However, reported differences of MT and T1/T2 parameters between MS patients and controls are subtle, and the correlations of these MRI parameters with disability measures are generally weak.
Our study examines the potential of novel MRI protocols introduced by our group to provide additional contrast that cannot be appreciated with the MR imaging methods used to date in MS research. Specifically, we focused on rotating frame relaxation methods during adiabatic pulses, i.e. adiabatic T1ρ and T2ρ,19-22 and on an inversion-prepared quantitative MT protocol.23 Whereas conventional T1 and T2 parameters quantify spin relaxations in “free precession” conditions, i.e., in the absence of radiofrequency (RF) perturbations, T1ρ and T2ρ describe relaxation in the presence of RF. The rationale of using T1ρ and T2ρ relaxation parameters for tissue characterization is grounded on the fact that these methods are sensitive to a broader range of spin dynamics as compared to laboratory-frame T1 and T2 relaxations. Whereas in vivo T1 (and to a certain extent T2) depend on magnetic field fluctuations induced by tumbling dipoles (i.e., motion) that occur at frequencies near the Larmor frequency (MHz range), rotating frame relaxation parameters have additional contributions from frequencies in the range of the effective field generated by the RF pulse used for the measurements (∼ kHz range).21 Rotating frame measurements performed during adiabatic pulses are particularly advantageous for in vivo applications, due to their insensitivity to B0 and B1 inhomogeneities. Adiabatic methods can also be more informative than conventional spin-lock rotating frame methods. In fact, whereas spin-lock experiments exploit only one constant effective frequency during the continuous wave irradiation, the adiabatic methods generate a time-dependent effective frequency during the application of the adiabatic pulses. The adiabatic MRI techniques have demonstrated abnormalities in multiple clinical conditions including Parkinson's disease,24, 25 CNS neoplasm,26 and stroke.27 Specifically, adiabatic T1ρ can detect changes in neuronal cellular density,24, 28 whereas adiabatic T2ρ has been shown to be sensitive to iron,24 and even capable of quantifying iron levels in the brain.29
One of the main barriers to obtaining quantitative MT data is the need for long steady state pulses required for fitting T1 in the presence of off-resonance saturation (i.e., T1sat) and the steady state magnetization (i.e., Mss). By utilizing an inversion-prepared protocol, we have demonstrated that it is possible to provide quantitative MT parametric maps that overcome the poor sensitivity of MTR maps and provide enhanced tissue specificity while maintaining RF exposure within SAR limits.23
The overall goal of this study was to establish novel MRI protocols for detection of abnormalities in the normal-appearing brain tissue in MS. To this end, we measured adiabatic T1ρ, adiabatic T2ρ, T1sat and MTR in the brain of 9 relapsing-remitting MS (RRMS) patients and 7 healthy control subjects. We specifically focused on T2 lesions, normal-appearing cortical grey matter, and NAWM. We hypothesized that T1sat, as measured by our inversion-prepared MT protocol,23 would be more robust than MTR for detecting abnormalities of NAWM in MS. In addition, we hypothesized that rotating frame relaxation parameters would also detect abnormalities in normal appearing brain tissue of MS, thus providing complimentary information to characterize brain tissue pathology.
Methods
Subject recruitment
Sixteen subjects completed the MRI study after giving informed consent using procedures approved by the Institutional Review Board: Human Subjects Committee of the University of Minnesota. Four additional subjects participated in the study, but did not provide complete data due to excessive head movements or MRI artifacts. RRMS subjects (n=9) were recruited from the University of Minnesota MS Clinic and via advertisements in local MS Society publications. The control subjects (n=7) were recruited via advertisements around the University of Minnesota, and from existing databases of control subjects interested in participation in research. Inclusion criteria for both groups included age 18-75 years, and ability to tolerate MRI without sedation. MS subjects had to meet 2005 revised McDonald criteria for MS,30 and had to have at least one T2-hyperintense lesion in the region of interest. Exclusion criteria for both groups included implanted metal that might interfere with safe performance of MRI, active substance abuse, weight > 300 lbs, and central nervous system disorders other than MS.
Paraclinical data was obtained from each of the RRMS subjects the same day of the MRI session, prior to arrival to the Center for Magnetic Resonance Research. These tests included: Expanded Disability Status Scale (EDSS), Multiple Sclerosis Functional Composite (MSFC), 9 hole Peg test (9HP), 25-foot timed walk (T25FW), Paced Auditory Serial Addition Test 3 (PASAT), Fatigue Severity Scale (FSS), Center for Epidemiologic Studies Depression Scale (CES-D), and the Multiple Sclerosis Quality of Life-54 instrument (MSQOL). A summary of subject characteristics is reported in Table 1. All 16 subjects included in the study completed the MT and adiabatic T1ρ and T2ρ measurements, except two RRMS patients who did not complete the adiabatic T2ρ measurement.
Table 1. Characteristics of MS and control subjects.
| Controls | RRMS | |
|---|---|---|
|
| ||
| Mean ± SD | Mean ± SD | |
|
|
||
| N | 7 | 9 |
| Age (years) | 37 ± 9 | 38 ± 10 |
| Female/Male | 5/2 | 7/2 |
| Disease duration (years) | - | 10 ± 5 |
| EDSS | - | 2.9 ± 1.2 |
| MSFC (Z score) | - | 0.23 ± 0.37 |
| 9HP, left hand (seconds) | - | 24.5 ± 5.2 |
| 9HP, right hand (seconds) | - | 22.6 ± 5.3 |
| T25FW (seconds) | - | 4.5 ± 1.3 |
| PASAT (correct responses) | - | 47.3 ± 10.9 |
| FSS | - | 36.3 ± 15.7 |
| CES-D | - | 14.9 ± 7.5 |
| MSQOL | - | 64 ± 21 |
EDSS, Expanded Disability Status Scale; MSFC, Multiple Sclerosis Functional Composite; 9HP, 9 hole Peg test, T25FW, timed 25-foot walk; PASAT, Paced Auditory Serial Addition Test 3; FSS, Fatigue Severity Scale; CES-D, Center for Epidemiologic Studies Depression Scale; MSQOL, Multiple Sclerosis Quality of Life-54 instrument.
MRI parameters and settings
The study was performed using a 4 T, 90 cm bore magnet interfaced to a Varian DirectDrive TM console (Varian is now Agilent, Santa Clara, CA, USA). A volume coil was used for signal transmission and reception from the human brain, and proper padding was utilized in order to minimize head movements. After initial scout-images, we selected a single axial oblique brain slice just above the lateral ventricles and parallel to the AC-PC line for the various relaxation measurements. Images were acquired using fast spin echo readout, TR=5-8 s (depending on the relaxation measurement performed), TE=0.073 s, matrix 256×256, FOV=25.6×25.6 cm2, echo train=16, and slice-thickness=4mm. The adiabatic T1ρ/T2ρ and MT measurements were obtained as described previously (Figure 1)22, 23 with adiabatic full passage (AFP) hyperbolic secant HS1 pulses having RF peak amplitude ω1max/(2π)=0.88 kHz, pulse duration =0.006 s, and inversion bandwidth=∼1.6 kHz. For the MT experiment, a 6 kHz off-resonance continuous-wave irradiation was implemented with incremental duration (0, 0.3, 0.6, 0.9, 1.2 s) and amplitude ω1max/(2π)=0.15 kHz. Separate MT measurements were performed with and without an initial global inversion achieved by an adiabatic HS1 pulse (pulse length=6ms, ω1max/(2π)=1.2 kHz, bandwidth=∼3.3 kHz). The acquisition time for T1ρ/T2ρ and for MT measurements was ∼6.7 min and 21.3 min, respectively. The raw images were inspected during the experimental session in order to identify movements during and between relaxation measurements, so that the acquisition could be restarted and the slice repositioned if needed. In 3 experimental sessions, the slice of interest needed to be re-positioned to ensure spatial congruency among the various measurements. The duration of the entire experimental session was ∼40-60 min, and the estimated specific absorption rate was always below the FDA limit of 3 W/kg averaged over the head for 10 min (http://www.fda.gov/cdrh/ode/mri340.pdf).
Figure 1.
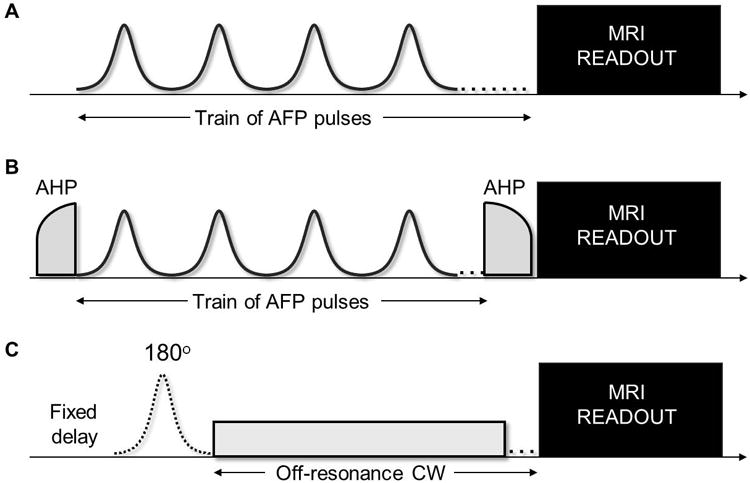
Pulse sequences used to measure adiabatic T1ρ (A), T2ρ (B) and magnetization transfer (C). In the adiabatic T1ρ configuration (A) a train of 0, 4, 8, 12 and 16 adiabatic full passage (AFP) pulses is placed prior to the imaging readout. In the adiabatic T2ρ configuration (B) the AFP train is embedded between two adiabatic half passages (AHP) pulses that first bring magnetization to the transverse plane and then bring it back to the z-axis before the readout. The AFP pulses are delivered with phases according to MLEV-4. In the inversion-prepared MT protocol (C), a global on-resonance inversion by an AFP pulse is either turned off or on prior to the off-resonance continuous-wave (CW) irradiation. In the present study, the MRI readout was fast spin echo.
Post-processing
The relaxation time constants T1ρ and T2ρ were estimated by mono-exponential fitting of the signal intensity decays on a pixel-by-pixel basis. The relaxation time constant T1sat was estimated using a non-linear regression algorithm that took into account data sets acquired with and without the inversion-preparation.23 The fitting procedures additionally provided maps of signal intensity in the absence of AFP trains or CW irradiation (i.e., S0), which resembled the contrast generated by the readout only. Finally, MTR was calculated based on the ratio of the signal intensity (SI) obtained with and without a 600ms-long CW irradiation (SI(MT=600ms) and SI0, respectively), according to (1-(SI(MT=600ms)/ SI0)*100. Relaxation analyses were performed using custom-built functions within Aedes software (Kuopio, Finland) operating on a Matlab R2009b platform (The Mathworks, Inc., Natick, MA, USA).
Regions of interest (ROIs)
T2-hyperintense lesions (T2L) in MS patients were carefully identified manually (by A.C.) from T2-weighted images (those obtained with the S0 maps), whereas in both patients and controls cortical gray matter (GM) and normal-appearing white matter (NAWM) regions were selected based on raw magnetization transfer images. In the MS brains, the NAWM regions were specifically selected to avoid “dirty-appearing” white matter. In our patient population there was no indication of cortical grey matter lesions. However, cortical grey matter lesions cannot be ruled out, as the MRI acquisition protocol was not optimized for their detection. The ROIs were then saved as ROI masks (Fig. 2). The ROI masks were applied to the various maps to generate the mean of each MRI parameter in each tissue type and each subject. Only in a few cases were the ROIs masks individually adjusted to take into account left-over slice misalignments between relaxation measurements.
Figure 2.
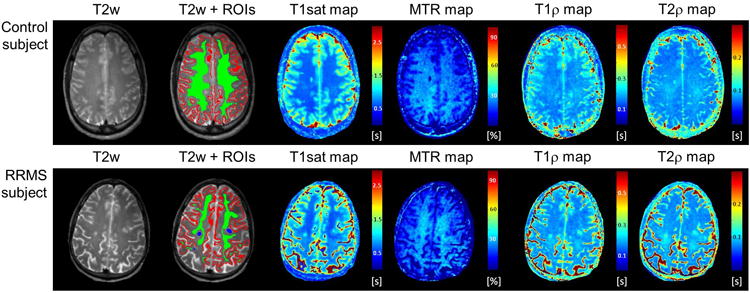
Examples of T2-weighted (T2w) images, regions of interest (normal-appearing white matter = green, cortical gray matter = red, T2-lesions = blue), T1sat, MTR, T1ρ and T2ρ maps from one healthy control subject (top row) and one RRMS subject (bottom row).
Statistical analysis
Means and standard deviations (sd) were calculated for each MRI parameter, grouped by tissue type and subject population. Coefficients of variation among subjects (cv) were calculated as sd/mean from the population of healthy controls, while correlations of MRI parameters with clinical scales were estimated from the MS subjects. MRI parameters in NAWM and GM were compared between MS and control subjects by 2-tailed unpaired T tests, while within-subjects comparisons between ROIs in each of the two groups of subjects were performed with 2-tailed paired T tests. The level of significance was set at p=0.05.
Results
Figure 2 shows representative relaxation maps from control and RRMS subjects. The range of adiabatic T1ρ (∼170-220 ms) and T2ρ (∼80-90 ms) from both grey matter and white matter tissues were in good agreement with previous studies at 4T.22, 24, 25 Variations of adiabatic T1ρ and T2ρ among healthy controls (Table 2) were below 15% in cortical grey matter (cv=10% and 13% for T1ρ and T2ρ respectively) and below 5% in white matter (2% and 4% respectively). In RRMS patients, T1ρ and T2ρ were significantly prolonged in T2 lesions as compared to NAWM (p=0.0041 and p=0.01, respectively) and to cortical GM (p=0.033 and p=0.031, respectively). T1ρ was significantly prolonged by ∼6% in the NAWM of RRMS patients as compared to healthy controls (p=0.026), while T2ρ values were not significantly different between groups. No significant differences among groups were observed for either T1ρ or T2ρ in cortical GM. In MS subjects, cortical GM T1ρ was highly correlated with MSFC (r=0.688, p=0.041), PASAT (r=0.71, p=0.032), and to a lesser extent to EDSS (r =-0.652, p=0.057), while cortical GM T2ρ was correlated with T25FW (r=-0.759, p=0.048). No other significant correlations were observed between adiabatic relaxation time constants and paraclinical measures.
Table 2. Comparisons of MRI parameters by tissue type between groups.
| Control (n=7) | cv | RRMS (n=9) | p-value | difference | |
|---|---|---|---|---|---|
|
| |||||
| T1ρ cortical GM (s) | 0.221 ± 0.029 | 13% | 0.225 ± 0.009 | p = 0.695 | 1% |
| T1ρ NAWM (s) | 0.172 ± 0.003 | 2% | 0.182 ± 0.011 | p = 0.026 | 6% |
| T1ρ T2L (s) | n.a. | n.a. | 0.312 ± 0.029 | n.a. | n.a. |
| T2ρ cortical GM (s) | 0.092 ± 0.009 | 10% | 0.097 ± 0.012a | p = 0.396 | 5% |
| T2ρ NAWM (s) | 0.084 ± 0.003 | 4% | 0.087 ± 0.007a | p = 0.328 | 4% |
| T2ρ T2L (s) | n.a. | n.a. | 0.140 ± 0.035a | n.a. | n.a. |
| T1sat cortical GM (s) | 1.101 ± 0.055 | 5% | 1.165 ± 0.086 | p = 0.11 | 6% |
| T1sat NAWM (s) | 0.630 ± 0.030 | 5% | 0.738 ± 0.059 | p = 0.0006 | 17% |
| T1sat T2L (s) | n.a. | n.a. | 1.216 ± 0.358 | n.a. | n.a. |
| MTR cortical GM (%) | 17.69 ± 2.02 | 11% | 17.21 ± 2.27 | p = 0.671 | -3% |
| MTR NAWM (%) | 29.34 ± 2.74 | 9% | 25.95 ± 3.23 | p = 0.043 | -12% |
| MTR T2L (%) | n.a. | n.a. | 16.48 ± 7.06 | n.a. | n.a. |
Values of MRI parameters are shown as mean±sd for different tissue type and subject populations. Inter-subject coefficient of variation (cv=sd/mean) were calculated in healthy control subjects. P-values refer to un-paired 2-sided t-test between MS subjects and healthy control subjects. Differences of MRI parameters between groups (MS minus controls) are also shown. Parameters that show statistically significant differences between groups are displayed in bold.
: n=7 rather than 9.
The range of measured T1sat (∼ 650-1200 ms) was in good agreement with previous studies at 4T,23 and the cv of T1sat was 5% in both cortical grey matter and white matter, which is significantly less than the cv of MTR in the same regions (11% and 9%). In RRMS patients, T1sat values were significantly prolonged in T2 lesions as compared to NAWM (p=0.0045), but were not different from cortical GM values (p=0.724). On the other hand, MTR values were significantly smaller in T2 lesions than in NAWM (p=0.0071) but not different from cortical GM (p=0.776). T1sat relaxation time was significantly prolonged by ∼17% in the NAWM of RRMS patients as compared to healthy controls (p=0.0006), while MTR was 12% smaller (p=0.043). No significant correlations were observed between MT parameters and any of the paraclinical measures.
Discussion
In this study we obtained quantitative measures of adiabatic rotating frame relaxations and MT parameters in the brain of RRMS subjects and healthy controls, with the goal of addressing the feasibility and sensitivity of these MRI measures for characterizing normal-appearing brain tissue in MS. Based on theoretical considerations and on our previous experience in other tissue types and subject populations,21, 22, 24-27 we anticipated that adiabatic relaxation and quantitative MT parameters would identify abnormalities in the normal appearing brain tissue of MS. The results of the present study demonstrate that adiabatic relaxation methods, along with the inversion-prepared quantitative MT protocol, hold great potential for the study of MS. Adiabatic relaxations were highly reproducible among the healthy controls investigated here, who were relatively similar in age (37 ± 9 years). The inter-subject reproducibility was especially striking for T1ρ, allowing reliable detection of small differences between groups. T1sat values measured with the inversion-prepared MT protocol were also found to be tightly distributed among healthy subjects, with coefficients of variation that were about half of those observed for the MTR. However, the higher reproducibility of T1sat as compared to MTR measurements was achieved at the expense of substantially longer acquisition times.
In our group of RRMS patients, we observed a slightly but significantly longer adiabatic T1ρ in NAWM regions as compared to healthy controls (by 6%, p=0.0026). Within T2 lesions T1ρ was more strikingly prolonged, and was >80% longer than in the WM of healthy controls (Table 2). It is tempting to speculate that the longer T1ρ observed in the NAWM and in the T2L of MS brains might reflect the same pathologic processes in each tissue type. Pathologic abnormalities within T2 lesions include myelin loss, axonal damage, and (depending on the stage or age of the lesion) inflammation.1 Whereas only post-mortem studies can confirm the pathophysiological processes that underlie the T1ρ findings, prior histopathologic studies in animals have shown a relation between T1ρ and neuronal density.24, 28 The present results thus seem to suggest the presence of ongoing axonal degeneration in NAWM tissue of RRMS, and that adiabatic T1ρ is a sensitive measure for detecting it. However, other phenomena, such as inflammation, might explain T1ρ lengthening in such regions. Because no T2ρ differences were observed above our detection threshold (∼5%) in the NAWM of MS, the degenerative process occurring in NAWM does not seem to be accompanied by abnormal iron levels. While several studies have demonstrated a correlation between disease progression and the levels of iron deposition in deep gray matter structures,31 no experimental evidence has so far shown abnormal iron levels in the NAWM of MS.
Although it is known that cortical grey matter is involved early in the disease process of MS, we did not observe detectable differences in T1ρ or T2ρ that suggest neurodegeneration or abnormal iron levels, respectively, at this stage of the disease. Yet, we observed that grey matter T1ρ was correlated with MSFC and PASAT disability scores, and that grey matter T2ρ was correlated with T25FW. The small sample size used for the present study nonetheless warrants caution in interpreting these findings and indicates the need for further investigations with larger cohorts.
Small decreases of MTR values in MS NAWM are well-documented in the literature,4, 32 and our MTR findings are in agreement with previous findings. However, the present study additionally demonstrates that the T1sat measured with the inversion-prepared MT protocol is a more robust and sensitive parameter than the MTR for detection of NAWM abnormalities in MS patients (i.e., bigger changes and higher levels of significance when comparing MS with healthy controls). Some groups have reported correlations of MTR parameters in NAWM with disability scores,33-35 but the correlations are generally weak and not always reproducible. Despite the higher sensitivity of T1sat in detecting differences in NAWM, we did not observe here any correlation between T1sat and clinical scores. Future investigations on a larger group of subjects are needed to corroborate the potential usage of MT parameters as a marker of disease severity.
The MRI protocol used in this study was based on a single slice acquisition, with the various relaxation measurements taking several minutes to be completed. Under these conditions, head movements can seriously compromise the robustness of the quantitative estimates of the relaxation parameters, since the acquired brain slice might differ during data acquisition. The present results were not compromised by head movements, since we carefully controlled for them during both data acquisition and data processing. Yet, the inherent sensitivity to head motion and the limited brain coverage of the current MRI protocol are clear obstacles to clinical application. Possible strategies for reducing scan time and increasing brain coverage include giving up full relaxation conditions by using shorter TR, using parallel acquisition and using alternative, faster readout schemes, although such approaches might inherently introduce lower signal to noise ratios.
In conclusion, we demonstrated the feasibility of using new MRI parameters to identify abnormalities in the normal appearing brain tissue in MS. In agreement with previous findings, magnetization transfer parameters could detect changes in NAWM of MS vs controls, however T1sat was found to be substantially more sensitive than MTR in separating MS subjects from controls. Adiabatic T1ρ, but not T2ρ, also demonstrated abnormalities in NAWM of RRMS vs controls, suggesting neurodegenerative processes likely not accompanied by significant abnormalities in iron content.
Acknowledgments
The authors are grateful to their research volunteers for their participation, and to Krista Mullen for helping with subject recruitment.
Sources of support: Dr. Carpenter has received research support from Biogen Idec, Celgene, Roche, Sanofi-Aventis, EMD Serono and Teva. This work was supported by P41RR08079 and P41EB015894 (to CMRR), S10 RR023730 and S10 RR027290 (to CMRR), NIH KL2 RR033182 (to Dr. Mangia), R01NS061866 and R21NS059813 (to Dr. Michaeli), AHC seed grant from University of Minnesota (to Dr. Carpenter).
Footnotes
Disclosures: Dr. Mangia, Dr. Eberly, Dr. Garwood, Dr. Michaeli and Tyan have nothing to disclose.
References
- 1.Noseworthy JH, Lucchinetti C, Rodriguez M, et al. Multiple sclerosis. N Engl J Med. 2000;343:938–952. doi: 10.1056/NEJM200009283431307. [DOI] [PubMed] [Google Scholar]
- 2.Wolff SD, Balaban RS. Magnetization transfer imaging: practical aspects and clinical applications. Radiology. 1994;192:593–599. doi: 10.1148/radiology.192.3.8058919. [DOI] [PubMed] [Google Scholar]
- 3.Ropele S, Fazekas F. Magnetization transfer MR imaging in multiple sclerosis. Neuroimaging Clin N Am. 2009;19:27–36. doi: 10.1016/j.nic.2008.09.004. [DOI] [PubMed] [Google Scholar]
- 4.Moll NM, Rietsch AM, Thomas S, et al. Multiple sclerosis normal-appearing white matter: pathology-imaging correlations. Ann Neurol. 2011;70:764–773. doi: 10.1002/ana.22521. [DOI] [PMC free article] [PubMed] [Google Scholar]
- 5.Schmierer K, Scaravilli F, Altmann DR, et al. Magnetization transfer ratio and myelin in postmortem multiple sclerosis brain. Ann Neurol. 2004;56:407–415. doi: 10.1002/ana.20202. [DOI] [PubMed] [Google Scholar]
- 6.van Waesberghe JH, Kamphorst W, De Groot CJ, et al. Axonal loss in multiple sclerosis lesions: magnetic resonance imaging insights into substrates of disability. Ann Neurol. 1999;46:747–754. doi: 10.1002/1531-8249(199911)46:5<747::aid-ana10>3.3.co;2-w. [DOI] [PubMed] [Google Scholar]
- 7.Filippi M, Rocca MA, Martino G, et al. Magnetization transfer changes in the normal appearing white matter precede the appearance of enhancing lesions in patients with multiple sclerosis. Ann Neurol. 1998;43:809–814. doi: 10.1002/ana.410430616. [DOI] [PubMed] [Google Scholar]
- 8.Ge Y, Grossman RI, Udupa JK, et al. Magnetization transfer ratio histogram analysis of normal-appearing gray matter and normal-appearing white matter in multiple sclerosis. J Comput Assist Tomogr. 2002;26:62–68. doi: 10.1097/00004728-200201000-00009. [DOI] [PubMed] [Google Scholar]
- 9.Goodkin DE, Rooney WD, Sloan R, et al. A serial study of new MS lesions and the white matter from which they arise. Neurology. 1998;51:1689–1697. doi: 10.1212/wnl.51.6.1689. [DOI] [PubMed] [Google Scholar]
- 10.Tozer D, Ramani A, Barker GJ, et al. Quantitative magnetization transfer mapping of bound protons in multiple sclerosis. Magn Reson Med. 2003;50:83–91. doi: 10.1002/mrm.10514. [DOI] [PubMed] [Google Scholar]
- 11.Cercignani M, Bozzali M, Iannucci G, et al. Magnetisation transfer ratio and mean diffusivity of normal appearing white and grey matter from patients with multiple sclerosis. J Neurol Neurosurg Psychiatry. 2001;70:311–317. doi: 10.1136/jnnp.70.3.311. [DOI] [PMC free article] [PubMed] [Google Scholar]
- 12.Ge Y, Grossman RI, Udupa JK, et al. Magnetization transfer ratio histogram analysis of gray matter in relapsing-remitting multiple sclerosis. AJNR Am J Neuroradiol. 2001;22:470–475. [PMC free article] [PubMed] [Google Scholar]
- 13.Vrenken H, Pouwels PJ, Ropele S, et al. Magnetization transfer ratio measurement in multiple sclerosis normal-appearing brain tissue: limited differences with controls but relationships with clinical and MR measures of disease. Mult Scler. 2007;13:708–716. doi: 10.1177/1352458506075521. [DOI] [PubMed] [Google Scholar]
- 14.Neema M, Stankiewicz J, Arora A, et al. T1- and T2-based MRI measures of diffuse gray matter and white matter damage in patients with multiple sclerosis. J Neuroimaging. 2007;17(Suppl 1):16S–21S. doi: 10.1111/j.1552-6569.2007.00131.x. [DOI] [PubMed] [Google Scholar]
- 15.Liang AL, Vavasour IM, Madler B, et al. Short-term stability of T1 and T2 relaxation measures in multiple sclerosis normal appearing white matter. J Neurol. 2012;259:1151–1158. doi: 10.1007/s00415-011-6318-0. [DOI] [PubMed] [Google Scholar]
- 16.Khaleeli Z, Cercignani M, Audoin B, et al. Localized grey matter damage in early primary progressive multiple sclerosis contributes to disability. Neuroimage. 2007;37:253–261. doi: 10.1016/j.neuroimage.2007.04.056. [DOI] [PubMed] [Google Scholar]
- 17.Traboulsee A, Dehmeshki J, Peters KR, et al. Disability in multiple sclerosis is related to normal appearing brain tissue MTR histogram abnormalities. Mult Scler. 2003;9:566–573. doi: 10.1191/1352458503ms958oa. [DOI] [PubMed] [Google Scholar]
- 18.Agosta F, Rovaris M, Pagani E, et al. Magnetization transfer MRI metrics predict the accumulation of disability 8 years later in patients with multiple sclerosis. Brain. 2006;129:2620–2627. doi: 10.1093/brain/awl208. [DOI] [PubMed] [Google Scholar]
- 19.Michaeli S, Grohn H, Grohn O, et al. Exchange-influenced T2rho contrast in human brain images measured with adiabatic radio frequency pulses. Magn Reson Med. 2005;53:823–829. doi: 10.1002/mrm.20428. [DOI] [PubMed] [Google Scholar]
- 20.Michaeli S, Sorce DJ, Springer CS, Jr, et al. T1rho MRI contrast in the human brain: modulation of the longitudinal rotating frame relaxation shutter-speed during an adiabatic RF pulse. J Magn Reson. 2006;181:135–147. doi: 10.1016/j.jmr.2006.04.002. [DOI] [PubMed] [Google Scholar]
- 21.Michaeli S, Sorce DJ, Garwood M. T-2 rho and T-1 rho adiabatic relaxations and contrasts. Current Analytical Chemistry. 2008;4:8–25. [Google Scholar]
- 22.Mangia S, Liimatainen T, Garwood M, et al. Rotating frame relaxation during adiabatic pulses vs. conventional spin lock: simulations and experimental results at 4 T. Magn Reson Imaging. 2009;27:1074–1087. doi: 10.1016/j.mri.2009.05.023. [DOI] [PMC free article] [PubMed] [Google Scholar]
- 23.Mangia S, De Martino F, Liimatainen T, et al. Magnetization transfer using inversion recovery during off-resonance irradiation. Magn Reson Imaging. 2011;29:1346–1350. doi: 10.1016/j.mri.2011.04.002. [DOI] [PMC free article] [PubMed] [Google Scholar]
- 24.Michaeli S, Oz G, Sorce DJ, et al. Assessment of brain iron and neuronal integrity in patients with Parkinson's disease using novel MRI contrasts. Mov Disord. 2007;22:334–340. doi: 10.1002/mds.21227. [DOI] [PubMed] [Google Scholar]
- 25.Tuite PJ, Mangia S, Tyan AE, et al. Magnetization transfer and adiabatic R 1rho MRI in the brainstem of Parkinson's disease. Parkinsonism Relat Disord. 2012;18:623–625. doi: 10.1016/j.parkreldis.2012.01.003. [DOI] [PMC free article] [PubMed] [Google Scholar]
- 26.Sierra A, Michaeli S, Niskanen JP, et al. Water spin dynamics during apoptotic cell death in glioma gene therapy probed by T1rho and T2rho. Magn Reson Med. 2008;59:1311–1319. doi: 10.1002/mrm.21600. [DOI] [PMC free article] [PubMed] [Google Scholar]
- 27.Jokivarsi KT, Niskanen JP, Michaeli S, et al. Quantitative assessment of water pools by T 1 rho and T 2 rho MRI in acute cerebral ischemia of the rat. J Cereb Blood Flow Metab. 2009;29:206–216. doi: 10.1038/jcbfm.2008.113. [DOI] [PMC free article] [PubMed] [Google Scholar]
- 28.Michaeli S, Burns TC, Kudishevich E, et al. Detection of neuronal loss using T(1rho) MRI assessment of (1)H(2)O spin dynamics in the aphakia mouse. J Neurosci Methods. 2009;177:160–167. doi: 10.1016/j.jneumeth.2008.10.025. [DOI] [PMC free article] [PubMed] [Google Scholar]
- 29.Mitsumori F, Watanabe H, Takaya N. Estimation of brain iron concentration in vivo using a linear relationship between regional iron and apparent transverse relaxation rate of the tissue water at 4.7T. Magn Reson Med. 2009;62:1326–1330. doi: 10.1002/mrm.22097. [DOI] [PubMed] [Google Scholar]
- 30.Polman CH, Reingold SC, Edan G, et al. Diagnostic criteria for multiple sclerosis: 2005 revisions to the “McDonald Criteria”. Ann Neurol. 2005;58:840–846. doi: 10.1002/ana.20703. [DOI] [PubMed] [Google Scholar]
- 31.Williams R, Buchheit CL, Berman NE, et al. Pathogenic implications of iron accumulation in multiple sclerosis. J Neurochem. 2012;120:7–25. doi: 10.1111/j.1471-4159.2011.07536.x. [DOI] [PMC free article] [PubMed] [Google Scholar]
- 32.Filippi M, Inglese M, Rovaris M, et al. Magnetization transfer imaging to monitor the evolution of MS: a 1-year follow-up study. Neurology. 2000;55:940–946. doi: 10.1212/wnl.55.7.940. [DOI] [PubMed] [Google Scholar]
- 33.Kalkers NF, Hintzen RQ, van Waesberghe JH, et al. Magnetization transfer histogram parameters reflect all dimensions of MS pathology, including atrophy. J Neurol Sci. 2001;184:155–162. doi: 10.1016/s0022-510x(01)00431-2. [DOI] [PubMed] [Google Scholar]
- 34.Santos AC, Narayanan S, de Stefano N, et al. Magnetization transfer can predict clinical evolution in patients with multiple sclerosis. J Neurol. 2002;249:662–668. doi: 10.1007/s00415-002-0686-4. [DOI] [PubMed] [Google Scholar]
- 35.Rovaris M, Agosta F, Sormani MP, et al. Conventional and magnetization transfer MRI predictors of clinical multiple sclerosis evolution: a medium-term follow-up study. Brain. 2003;126:2323–2332. doi: 10.1093/brain/awg232. [DOI] [PubMed] [Google Scholar]