

Abstract
BACKGROUND
Low-dose computed tomography (LDCT) lung screening has been associated with a 20% reduction in lung cancer mortality. A major barrier to the adoption of lung screening is the potential negative psychological impact of a false-positive (FP) screen, occurring in 20% to 50% of those screened. The objective of this study was to assess the impact of abnormal findings on health-related quality of life (HRQoL) and anxiety in the American College of Radiology (ACRIN)/National Lung Screening Trial (NLST).
METHODS
The NLST was a randomized screening trial comparing LDCT with chest X-ray screening (CXR). This study was part of the original protocol. A total of 2812 participants at 16 of 23 ACRIN sites who had baseline HRQoL assessments were asked to complete the Short Form-36 and the State Trait Anxiety Inventory (form Y-1) questionnaires to assess short-term (1 month) and long-term (6 months) effects of screening. FP were lung cancer–free at 1 year, and true-positives (TP) were not.
RESULTS
Of the total participants, 1024 (36.4%) participants were FP, 63 (2.2%) were TP, 344 (12.2%) had significant incidental findings (SIFs), and 1381 (49.1%) had negative screens. Participants had been randomized to LDCT (n = 1947) and CXR (n = 865). Short-term and long-term HRQoL and state anxiety did not differ across participants with FP, SIF, or negative screens. Short-term and long-term HRQoL were lower and anxiety was higher for TP participants compared to participants with FP, SIF, and negative screens.
CONCLUSIONS
In a large multicenter lung screening trial, participants receiving a false-positive or SIF screen result experienced no significant difference in HRQoL or state anxiety at 1 or at 6 months after screening relative to those receiving a negative result. Cancer 2014;120:3401–3409. © 2014 The Authors. Cancer published by Wiley Periodicals, Inc. on behalf of American Cancer Society.
In a large multi-center lung screening trial, participants receiving a false positive or significant incidental finding screen result experienced no significant difference in health related quality of life or state anxiety at 1 or at 6 months after screening relative to those receiving a negative result.
Keywords: quality of life, anxiety, lung cancer, screening, clinical trials
INTRODUCTION
Lung cancer is the leading cause of cancer death in the United States.1 Based on reduced lung cancer mortality in the low-dose computed tomography (LDCT) arm of the National Lung Screening Trial (NLST),2 the United States Preventive Services Task Force released a grade B recommendation for provision of annual LDCT lung screening to adults 55 to 80 years who have a 30 pack-year smoking history and currently smoke or have quit within the past 15 years.3 Several professional organizations have issued similar guidelines.4 One of the barriers to the widespread adoption of LDCT lung screening is the current lack of knowledge regarding the potential adverse psychological impact of a false-positive screen, and the large number of participants who will screen false-positive (20%-50%),2,5–8 but who do not have lung cancer. Because lung biopsy carries a high degree of risk to the patient, current guidelines for management of LDCT-detected lung nodules recommend serial monitoring for many patients with a positive screening examination.9,10 These patients may endure an extended period of uncertainty regarding their lung cancer status.
This extended monitoring is in direct contrast to the experience of most patients screened for breast, colon, or cervical cancer who receive their final diagnoses fairly rapidly following a biopsy of the suspicious lesion. Even so, false positive breast cancer screens have been associated with reduced health-related quality of life (HRQoL) and increased anxiety.11 For lung cancer screening, information is limited to smaller studies and has been inconclusive.12,13 If receiving a positive screen result has short-term (1 month) or long-term (6 months) impact on participant quality of life and/or anxiety, physicians may be less likely to refer high-risk individuals for LDCT screening,5 and patients may be less likely to adhere to an annual screening protocol.
In addition, CT lung screening has a high rate of significant incidental findings (SIFs), such as abdominal aortic aneurysms and renal cysts (6%-14%). These findings are unrelated to lung cancer,2,14 but are often of sufficient concern to warrant additional diagnostic evaluation. As lung screening diffuses into the community with less experienced radiologists evaluating screening images, the proportion of screens with diagnosed SIFs may grow.
Given the high rate of false positive screens, the large number of SIFs visualized with LDCT screening, the inconsistent information available on the effect of a false positive screen, and the lack of information on the impact of SIF results, we planned to study the impact of false positive and SIF screens on short-term (1 month) and long-term (6 months) HRQoL and anxiety in the NLST. The NLST is the largest trial of lung CT screening conducted to date. We report on the association between screen results (false-positive, true-positive, SIF, and negative) and screening arm (LDCT, CXR) and global HRQoL and state anxiety in NLST participants.
MATERIALS AND METHODS
This HRQoL study was approved by the Institutional Review Boards at each of the participating sites and at Brown University. All participants gave informed consent at the site of recruitment.
Study Population
The NLST was a multi-institutional trial of 53,452 participants designed to compare the ability of LDCT and CXR imaging to reduce lung cancer mortality. Participants received three screening examinations at one year intervals: a baseline (T0) and 2 incidence screens (T1 and T2). Screening began in August of 2002. Follow-up was concluded in December of 2009. Details on the NLST study design have been published elsewhere.15 The NLST was a collaboration between the American College of Radiology Imaging Network (ACRIN) and the National Cancer Institute Division of Cancer Prevention Lung Screening Study. ACRIN enrolled 18,840 participants at 23 sites. During the informed consent process, ACRIN advised participants that up to 50% of those screened might receive a screen result suspicious for lung cancer, even though the participants did not have lung cancer, and that as many as 20% to 50% of those participants would require additional imaging or other testing to confirm that findings initially thought to be of concern were not cancer (Appendix A; see supporting online information).
Study Enrollment
Demographic information was collected at sites prior to the T0 screen. Participants at 16 of the 23 ACRIN sites (Appendix B) were invited to complete HRQoL forms at baseline and asked to provide contact information. Starting on March 9, 2003, all participants with a positive screen at these sites, whose results had been received at the Biostatistics Center within 30 days of the screening examination, who had completed the baseline HRQoL forms, and who had provided contact information, were recruited for this study. In the second year of the study, it became apparent that a substantial number of participants (6%-10%, depending on screening time point) had screen results “negative for lung cancer, but positive for SIFs.” At that time, we began to invite participants with SIF screen results, who met the above criteria, to participate in this study. Participants were recruited into this study only once, based on their first eligible screen from the T0, T1, or T2 screen. We refer to the screen result (T0, T1, T2) used for accrual as the “index” screen (Fig. 1). For comparison, we matched each participant with a positive screen or a SIF to a negative screen control based on date of screen, screen type (LDCT, CXR), site of accrual, sex, and 5-year age caliper.
Figure 1.
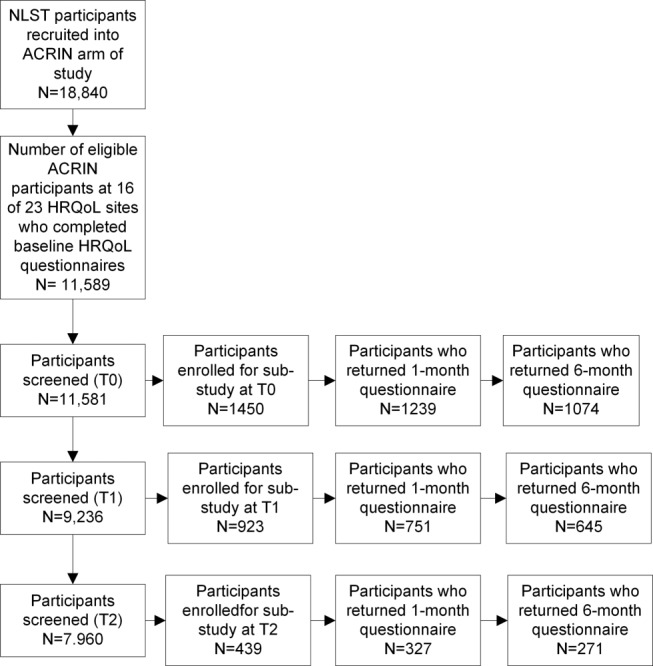
Number of ACRIN NLST participants with data available for analyses of health-related quality of life at each screening time point.
HRQoL and State Anxiety Tools
Global health status was assessed using the Short Form SF-36 v 2.0 (SF-36),16,17 a measure of physical and mental function. The SF-3618–21 has been widely used to evaluate the impact of the screening process on healthy participants, as well as patients with lung cancer.22 This measure of global health status offers the benefit of being easily compared across cancer and noncancer studies.23,24 The SF-36 is a 36-question health survey. These 36 questions are used to derive 8 profiles of functional health and well-being. Physical health is measured by the Physical Functioning, Role-Physical, Bodily Pain, and General Health scales. Mental health is described by the Vitality, Social Functioning, Role-Emotional, and Mental Health scales. Because it is often easier to report information on fewer, less detailed parameters, these 8 health dimensions are used to derive 2 summary measures, a Physical Component Score (PCS) and a Mental Component Score (MCS).25
The PCS and MCS range from 0 to 100, with a mean of 50 and a standard deviation of 10. For each of the SF-36 scale parameters and summary scores, lower scores indicate lower HRQoL. For adults aged 55-64, the median norm PCS is 50.65 and MCS is 55.28. For adults 65-74, the median norm PCS is 46.11 and MCS is 56.11.25 A change of 3 to 5 points in either of the SF-36 component scores across groups or over time is widely accepted as a clinically important change.17
State Anxiety was measured using the Spielberger State Trait Anxiety Inventory (STAI Form Y-1), a 20-question measure.26 The STAI has been widely used to evaluate the impact of the screening process on healthy community-dwelling participants.13,18,19 The STAI is a sensitive indicator of changes in transitory anxiety, such as might be experienced in a screening program. Scores range from 20 to 80, with higher scores indicating higher levels of state anxiety. The median norm for working adults aged 50 to 69 years is 34.51 for men and 32.20 for women.26 A difference between 2 groups with different exposures of one standard error is generally considered to represent a small effect, one and one half standard errors to represent a moderate effect, and two standard errors to represent a large effect.27 We chose not to administer the STAI at baseline to avoid capturing anxiety associated with the screening test itself.
Administration of HRQoL and Anxiety Tools
For eligible participants meeting the study entry criteria, the SF-36 and STAI were mailed from the ACRIN Outcomes and Economics Assessment Unit located at Brown University to arrive at the participant's home at approximately 1 and 6 months after screening. We elected to measure HRQoL and anxiety after 1 month to assess short-term effects at a time proximal to the screen, but far away enough that participants should have received their results. Per the ACRIN/NLST protocol,28 participants were to be informed of their screening results within 4 weeks of the screening test. We measured these indices again after 6 months to assess the longer-term impact of the screening results.
If questionnaires were not returned, a research associate phoned participants at 2 weeks and 1 month to encourage completion. We accepted questionnaires up to 15 days past this final scheduled call. Questionnaires received after that time were excluded from the study.
Statistical Analysis
To distinguish participants with a positive screen who were free of lung cancer from those participants who did have lung cancer, and who would potentially benefit from early diagnosis, we divided screen results into “false positive,” “true positive,” “SIF,” and “negative.” We defined “false positives,” using the same definition used for the main NLST analyses,2 as screens suspicious for lung cancer and free of lung cancer at 1 year, “true positives” as screens suspicious for lung cancer and diagnosed with lung cancer within 1 year, “SIFs” as screens with significant abnormalities but no evidence of lung cancer, and “negatives” as screens with no evidence of lung cancer or SIFs.
We compared enrolled participants (those who met the entry criteria and were mailed questionnaires) with all other NLST participants with respect to demographic characteristics and smoking history using a chi-square test for categorical data and, due to data departures from normality, the Wilcoxon rank-sum test for continuous data.
For PCS and MCS, we evaluated whether changes from the baseline value differed across screen results (false positive, true positive, SIF, or negative) or study arm (LDCT, CXR). We used separate models to examine factors associated with the change from baseline to 1 month and the change from baseline to 6 months, as we anticipated that the influence of screen result and other covariates on HRQoL might differ by time point. For STAI scores, we compared differences across screen results and study arm. As above, we used separate models for 1 and 6 months after screening. Thus, we used 6 separate regression models (PCS difference from baseline to 1 month and 6 months, MCS difference from baseline to 1 month and 6 months, and STAI at 1 month and 6 months). The time from the baseline questionnaire completion to the index screen could have been longer than one year if the index screen was the T1 or T2 screen. To control for differences occurring in HRQoL between accrual into the study and the index screen, associated with changes in HRQoL indices with increasing age29 and screening experience, we adjusted for the time difference between the baseline and index screen, as well any abnormal screening results occurring prior to the index screen.
In each of the 6 multivariate models, we included terms to compare HRQoL indices across screen result and study arm. In addition, we adjusted for a priori potential confounders and matching factors, including, the number of prior screens with a SIF, number of prior screens suspicious for lung cancer, study site, age, sex, education, marital status, smoking status, race, ethnicity,29,30 number of days since the baseline questionnaire had been administered, and, for the 1-month models, we assessed whether the participants knew their screening results at the time of questionnaire completion. For PCS and MCS models, the baseline score and the interaction between days since baseline and baseline score were also included.
For the PCS and MCS, the model was fit using iteratively reweighted least squares (IRLS) regression with a Huber weight function.31 The STAI score was modeled as a count variable (ranging from 20 to 80). There were an abundance of “20” scores. To adjust for this floor effect and also account for overdispersion, we used a zero-inflated (or 0 after subtracting 20 from each score) negative binomial regression.32 The Pearson's chi-squared test was applied to determine the goodness of fit. The exponentiated regression coefficients from this model estimate the rate of change in the STAI scores for a one unit change in each independent variable.
RESULTS
A total of 2812 participants met our study entry criteria and were invited to participate in this study. The index screen was T0 for 1450 participants, T1 for 923, and T2 for 439 (Fig. 1). HRQoL study participants were similar with respect to age distribution and smoking status to the remainder of the NLST population; however, HRQoL participants, were more likely to be female, white, non-Hispanic, more educated, and unmarried (Table1). The HRQoL study sample included fewer participants from the CXR arm of the study due to lower rates of abnormalities in that arm (Table2).
Table 1.
Comparison of Baseline Characteristics for Participants Invited to Participate in Quality of Life Study and the Remaining NLST Participants
| Characteristic | HRQoL Study (N = 2812) | Non-HRQoL Study (N = 50,640) | Total NLST (N = 53,452) |
|---|---|---|---|
| N (%) | N (%) | N (%) | |
| Age at randomization, y | |||
| <55 | 0 (0.0) | 5 (0.01) | 5 (0.01) |
| 55-59 | 1162 (41.32) | 21,698 (42.85) | 22,860 (42.77) |
| 60-64 | 896 (31.86) | 15,473 (30.55) | 16,369 (30.62) |
| 65-69 | 505 (17.96) | 9012 (17.80) | 9517 (17.80) |
| 70-74 | 249 (8.85) | 4448 (8.78) | 4697 (8.79) |
| ≥75 | 0 (0.0) | 4 (0.01) | 4 (0.01) |
| Sex* | |||
| Male | 1599 (56.86) | 29,931 (59.11) | 31,530 (58.99) |
| Female | 1213 (43.14) | 20,709 (40.89) | 21,922 (41.01) |
| Race** | |||
| White | 2649 (94.20) | 45,900 (90.64) | 48,549 (90.83) |
| Nonwhite | 163 (5.80) | 4740 (9.36) | 4903 (9.17) |
| Ethnic group* | |||
| Hispanic or Latino | 33 (1.17) | 902 (1.78) | 935 (1.75) |
| Neither Hispanic or Latino/unknown | 2779 (98.83) | 49,738 (98.22) | 52,517 (98.25) |
| Smoking status | |||
| Former | 1478 (52.56) | 26,214 (51.77) | 27,692 (51.81) |
| Current | 1334 (47.44) | 24,426 (48.23) | 25,760 (48.19) |
| Highest level of education completed*** | |||
| 8th grade or less | 41 (1.46) | 712 (1.41) | 753 (1.41) |
| 9th-11th grade | 128 (4.55) | 2368 (4.68) | 2496 (4.67) |
| High school graduate/GED | 598 (21.27) | 12,114 (23.92) | 12,712 (23.78) |
| Post–high school training, excluding college | 304 (10.81) | 7130 (14.08) | 7434 (13.91) |
| Associate's degree/some college | 697 (24.79) | 11,580 (22.87) | 12,277 (22.97) |
| Bachelor's degree | 492 (17.50) | 8454 (16.69) | 8946 (16.74) |
| Graduate school | 475 (16.89) | 7125 (14.07) | 7600 (14.22) |
| Other | 74 (2.63) | 892 (1.76) | 966 (1.81) |
| Unknown | 3 (0.11) | 265 (0.52) | 268 (0.50) |
| Marital status** | |||
| Never married/widowed/separated/divorced | 994 (35.35) | 16,530 (32.64) | 17,524 (32.78) |
| Married or living as married | 1808 (64.30) | 33,781 (66.71) | 35,589 (66.58) |
| Data missing | 10 (0.36) | 329 (0.65) | 339 (0.63) |
Abbreviations:HRQoL, health-related quality of life; NLST, National Lung Screening Trial.
P < .05
P < .01
P < .001.
Table 2.
HRQoL Questionnaire Availability by Study Arm, Index Screen Result, and Time Point
| No. of Participants with Baseline Information Who Were Invited to Participate in Study | No. of Participants who returned the 1-Month Questionnaire | No. of Participants who returned the 6-Month Questionnaire | ||
|---|---|---|---|---|
| N (%) | N (%) | N (%) | ||
| CT | Negative | 949 (100.0) | 801 (84.40) | 691 (72.81) |
| SIFs | 268 (100.0) | 210 (78.36) | 177 (66.04) | |
| False positive | 689 (100.0) | 583 (84.62) | 489 (70.97) | |
| True positive | 41 (100.0) | 34 (82.93) | 29 (70.73) | |
| CXR | Negative | 432 (100.0) | 361 (83.56) | 328 (75.93) |
| SIFs | 76 (100.0) | 62 (81.58) | 49 (64.47) | |
| False positive | 335 (100.0) | 252 (75.22) | 214 (63.88) | |
| True positive | 22 (100.0) | 14 (63.64) | 13 (59.09) | |
| Total | 2812 (100.0) | 2317 (82.40) | 1990 (70.77) | |
Abbreviations: CT, computed tomography; CXR, chest X-ray; SIF, significant incidental finding.
Overall, 1087 participants had screen results suspicious for lung cancer; 1024 were categorized as false-positive and 63 were true-positive. Of the 63 true-positive participants, 20 were diagnosed with lung cancer prior to their 1-month questionnaire, and an additional 21 before their 6-month questionnaire. A total of 344 participants were positive for SIFs, and 1381 were screen negative; 227 participants had 1 prior false-positive screen, and 40 had 2; 115 of the 2812 participants had 1 prior SIF, and 6 had 2. The 383 participants with prior positive or SIF screens were not eligible for accrual into the study based on those prior screens, because those screens had either occurred prior to the start of the study or had not been reported to the Biostatistics Center within 30 days of the screening test. We excluded one participant who was diagnosed with lung cancer following a negative screening examination.
Response rates were uniformly high, with the lowest response rates in participants with lung cancer (Table2). A total of 2317 participants (82.4%) completed forms within 45 days of mailing for the 1-month time point, and 1990 (70.8%) for the 6-month time point. At the time of completion of the 1-month questionnaire, 2126 (91.8%) knew their screening result. At 6 months, all participants knew their screening result. Of the 2812 enrolled participants, those who were true-positive were more likely to be in the CXR arm, older, white, and former smokers. False-positives were more likely to be current smokers (Supporting Table 1).
The PCS, MCS, and the STAI are shown in Table3. Mean change in score from baseline and 95% confidence intervals for the PCS, MCS, and STAI at 1- and 6-month time points are shown in Fig. 2. Detailed information on the SF-36 subscales is shown in Supporting Table 2 and Supporting Figure 1. In the crude data, PCS and MCS showed inconsistent decreases over time (Table3, Fig. 2), but these changes disappeared after adjustment for potential confounders (Table4). In contrast, decreases in PCS and MCS evident for the true positive screen group in the crude data were also evident in the adjusted analyses. We detected no difference in PCS or MCS by screening arm [LDCT or CXR] (Table 4).
Table 3.
Mean (standard deviation) HRQoL and STAI Scores by Study Arm, Index Screen Result, and Time Point
| Baseline (N = 2812) | 1 Month (N = 2317) | 6 Months (N = 1990) | ||
|---|---|---|---|---|
| Mean (SD) | Mean (SD) | Mean (SD) | ||
| CT | ||||
| SF-36v2: PCS | Negative | 48.16 (8.97) | 47.55 (9.50) | 47.89 (9.17) |
| SIFs | 48.38 (9.31) | 47.91 (9.44) | 47.20 (9.35) | |
| False positive | 47.92 (9.98) | 47.68 (10.19) | 47.08 (10.16) | |
| True positive | 46.59 (11.33) | 44.50 (11.57) | 38.28 (12.57) | |
| SF-36v2: MCS | Negative | 51.89 (10.19) | 51.28 (10.57) | 51.36 (10.55) |
| SIFs | 51.52 (9.83) | 50.21 (11.88) | 51.77 (10.49) | |
| False positive | 51.80 (10.04) | 50.61 (10.66) | 50.42 (11.24) | |
| True positive | 52.03 (11.04) | 44.14 (14.02) | 46.30 (13.65) | |
| STAI Y-1 | Negative | – | 32.67 (11.97) | 32.76 (12.36) |
| SIFs | – | 33.83 (12.68) | 33.19 (12.41) | |
| False positive | – | 34.34 (12.58) | 33.92 (12.77) | |
| True positive | – | 41.06 (15.10) | 37.69 (12.04) | |
| CXR | ||||
| SF-36v2: PCS | Negative | 49.23 (8.99) | 48.86 (9.61) | 48.00 (9.89) |
| SIFs | 48.22 (10.51) | 47.55 (10.14) | 48.45 (9.55) | |
| False positive | 48.64 (9.50) | 48.55 (9.52) | 47.86 (10.19) | |
| True positive | 48.52 (9.88) | 42.08 (11.06) | 38.48 (10.04) | |
| SF-36v2: MCS | Negative | 52.74 (9.72) | 51.09 (10.99) | 51.51 (10.39) |
| SIFs | 50.89 (10.14) | 49.98 (10.87) | 51.04 (9.18) | |
| False positive | 51.99 (9.17) | 51.09 (10.35) | 51.44 (9.79) | |
| True positive | 53.77 (8.57) | 51.42 (9.89) | 46.22 (12.17) | |
| STAI Y-1 | Negative | – | 32.93 (12.49) | 33.09 (11.90) |
| SIFs | – | 33.89 (12.05) | 33.79 (11.32) | |
| False positive | – | 32.57 (12.13) | 32.61 (11.59) | |
| True positive | – | 39.43 (11.66) | 39.38 (14.47) | |
Abbreviations: CT, computed tomography; CXR, chest X-ray; MCS, Mental Component Score; PCS, Physical Component Score; SIF, significant incidental finding.
Figure 2.
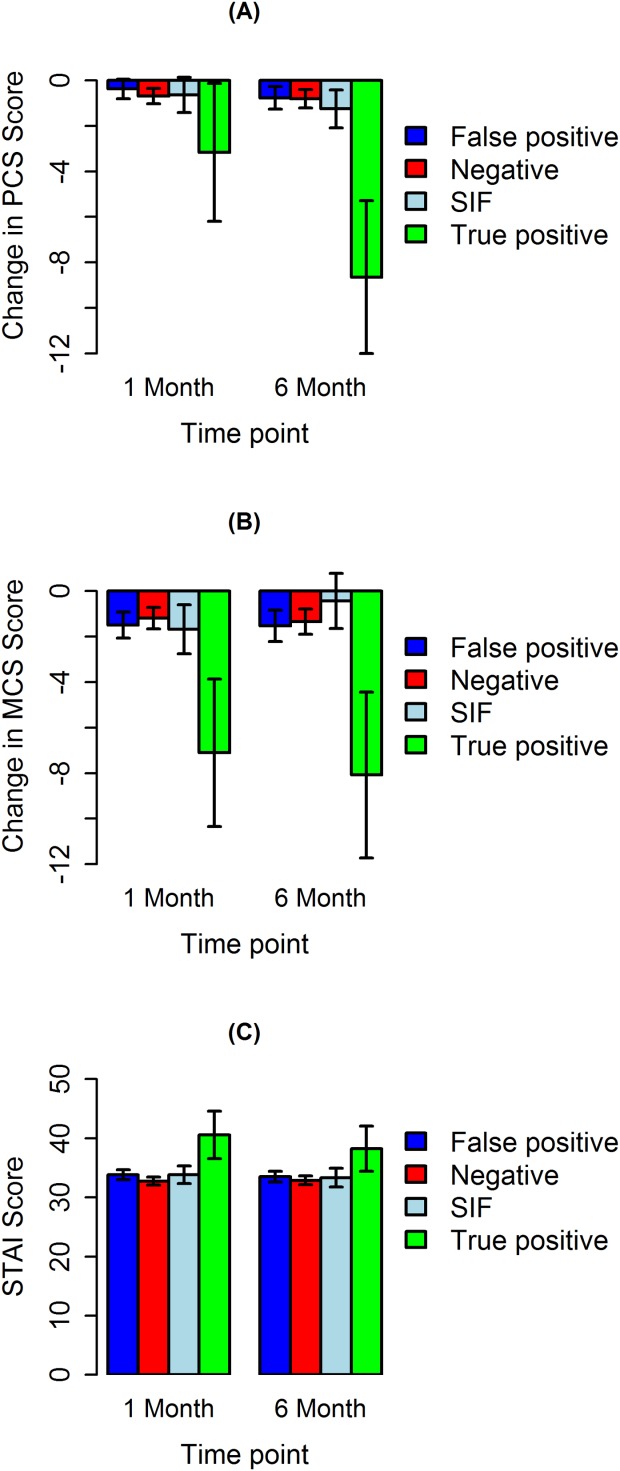
Mean change in score from baseline and 95% confidence intervals: (A) Physical Component Score (PCS), (B) Mental Component Score (MCS), and (C) STAI Score by time point of data collection.
Table 4.
Regression Analyses Examining the Association Between Change From Baseline (PCS and MCS) and Score (STAI)b and Screen Result and Study Arm, Adjusted for Potential Confounding Factorsa
| SF-36: PCS: Change from Baseline | SF-36: MCS: Change from Baseline | STAI Ratio | ||||
|---|---|---|---|---|---|---|
| 1-Month Estimate (95% CL) | 6-Month Estimate (95% CL) | 1-Month Estimate (95% CL) | 6-Month Estimate (95% CL) | 1-Month Estimate (95% CL) | 6-Month Estimate (95% CL) | |
| Variables in Model | ||||||
| Study arm (ref: CXR) | 0.07 (−0.44, 0.59) | 0.50 (−0.06, 1.07) | 0.23 (−0.37, 0.83) | 0.07 (−0.61, 0.74) | 1.01 (0.93, 1.10) | 1.02 (0.93, 1.12) |
| Index status | ||||||
| True positive | −1.18 (−2.81, 0.45) | −7.02 (−8.80, −5.24)*** | −3.95 (−5.87, −2.04)*** | −4.15 (−6.27, −2.03)*** | 1.47 (1.16, 1.88)** | 1.38 (1.05, 1.82)* |
| False positive | 0.46 (−0.04, 0.97) | 0.30 (−0.27, 0.87) | −0.22 (−0.82, 0.37) | 0.03 (−0.65, 0.70) | 1.06 (0.98, 1.15) | 1.00 (0.92, 1.10) |
| SIFs | 0.13 (−0.62, 0.88) | −0.16 (−1.01, 0.69) | −0.04 (−0.93, 0.84) | 0.29 (−0.72, 1.31) | 1.06 (0.94, 1.20) | 1.05 (0.91, 1.21) |
| Negative | 0.0 | 0.0 | 0.0 | 0.0 | 1.0 | 1.0 |
| Knew results of index screen prior to 1 month HRQoL | −0.31 (−1.14, 0.51) | 0.52 (−0.46, 1.49) | 0.93 (0.81, 1.07) | |||
Adjusted for site of origin, baseline score, days since baseline evaluation, baseline age, sex, years of education, marital status, smoking status, race, ethnicity, number of prior suspicious for lung cancer screens, number of prior SIFs screens and the statistical interaction between days since baseline and baseline score, and for 1-month parameters, whether participants knew results of index screen prior to 1 month HRQoL.
The exponentiated regression coefficients from this model estimate the rate of change in the STAI scores for a one unit change in each independent variable.
P < .05
P < .01
P < .001.
Abbreviations: CL, confidence level; CXR, chest X-ray; MCS, Mental Component Score; PCS, Physical Component Score; SIF, significant incidental finding; STAI, State Trait Anxiety Inventory.
Anxiety was substantially higher among those in the true-positive group compared with the false positive, SIF, and negative groups in crude (Table3) and adjusted (Table4) analyses at 1 and 6 months after screening. There was no difference in state anxiety across study arms (Table4).
DISCUSSION
In this study, drawn from the NLST, the largest randomized trial comparing LDCT and CXR, we found no significant differences in HRQoL (PCS, MCS) or state anxiety at 1 or 6 months after screening between participants who screened false-positive, positive for SIFs, or negative, nor did we find a difference in HRQoL or state anxiety by screening arm. We did, however, find significantly lower physical and mental health scores and significantly higher state anxiety for those who screened true-positive and developed lung cancer within 1 year of their screening examination, compared with all other screening groups.
These findings are relevant to the anticipated adoption of LDCT screening in the United States. They provide evidence that in a large screening program in which participants received extensive counseling as part of the consent process, screening was not associated with high psychological costs for participants who screened positive but were free of lung cancer. Our findings suggest that practice guidelines for LDCT screening should include recommendations for counseling regarding the potentially high rate of false-positive and SIF screen results in order to minimize the impact of screening on HRQoL and anxiety. This is also the first report of the effect of SIF findings on HRQoL and anxiety following lung screening.
The current findings are consistent with those reported for a substudy of NLST participants in which we found that lung cancer worry was low, and lung screening did not change participants' risk perceptions of lung cancer.33,34
Our findings, that there was no association between global HRQoL and false-positive screen results, are consistent with those reported by Van den Bergh et al. Their indeterminate group is comparable to our false positive group.12 However, Van den Bergh et al. did report higher lung-cancer–specific distress among participants with false-positive (indeterminate) as compared with negative screen results.12 We chose to administer global health measures to allow comparison of the impact of lung screening with other health interventions and for their utility for cost-effectiveness analysis. Although lung-cancer–specific measures are useful to understand health behaviors associated with lung screening, we did not administer these tools in the NLST due to concerns regarding participant burden. Presumably, if the impact of lung screening on disease-specific HRQoL were severe enough, it would be reflected in these global measures. Disease-specific measures, such as lung cancer distress, are of interest when planning counseling programs; however, we feel that global measures are more useful for comparisons across alternative health interventions or health conditions. We chose to focus on global HRQoL, because such comparisons are needed to make decisions on the allocation of health care resources.
We found no difference in state anxiety between participants with false positive and negative screen results. This finding is consistent with results reported from the NELSON study,12 but differed from that reported for participants in the PLuSS study.13 This discrepancy may be attributable to differences in the information provided to participants during the consent process. NLST participants were advised that as many as 50% of participants might receive a false-positive screen result requiring additional imaging, whereas PLuSS participants were advised of a potential false-positive rate of 25% (personal communication David Wilson MD, October 2012). PLuSS was also a smaller, single-center study, whereas the NLST was a large, multicenter study with extended follow-up.
Limitations
The NLST false-positive group was heterogeneous with respect to their screen findings and knowledge of their lung cancer status at the time that they completed their questionnaires. Participants with small nodules with no contrast enhancement or large masses might receive a definitive diagnosis shortly after screening, whereas those with undefined nodules might require monitoring over an extended period. Thus, some participants learned their lung cancer status (as opposed to their screening test result) prior to completing their 1-month questionnaire, some prior to completing their 6-month questionnaire, and some after completing both questionnaires. We did not have information on the precise date on which each participant received their final diagnosis. However, the range of participant experience that we report here mirrors that to be expected with the implementation of a community screening program, and provides reassurance that NLST screening participants understood the cancer screening process, including the high probability of receiving a false-positive result and the potential need for continued monitoring to ensure the benign nature of screen findings.
Although we enrolled participants at each of the 3 screening examinations (T0, T1, T2) to maximize the number of participants, each participant entered this study at a single time point. We adjusted our analyses for potential differences due to time point and past abnormal results (false-positive or SIF) at prior screens.
In addition, our original study design matched participants with abnormal results (positive for lung cancer or SIFs) with negative controls. To avoid dropping participants whose match failed to return questionnaires, we used an unmatched analysis. We adjusted for potential confounding by including the matching variables in our multivariate analyses.35
Conclusions
For participants in a lung cancer screening trial with a detailed informed consent that provided information regarding the high risk of a false-positive screen and associated follow-up, HRQoL and state anxiety did not differ at 1 or 6 months after screening for participants with false-positive, SIF, or negative screen results. HRQoL was significantly lower and state anxiety significantly higher for participants with true-positive screen results.
These results provide evidence that in a screening program that includes counseling and advises participants of the high likelihood of a false-positive screen and additional testing, there may be no impact on HRQoL or anxiety for participants who are free of lung cancer.
FUNDING SUPPORT
This study was supported through grants U01-CA-80098 and CA 79778 under a cooperative agreement with the Cancer Imaging Program.
CONFLICT OF INTEREST DISCLOSURES
Dr. Boiselle received a National Cancer Institute (NCI)-American College of Radiology Imaging Network grant and acted as the site PI at BIDMC for the National Lung Screening Trial as part of the current study. Drs. Duan, Fryback, Gareen, and Gatsonis and Ms. Greco and Mr. Snyder received grant funding from the NCI for work related to the current study. Dr. Duan has also acted as a paid statistical consultant for an imaging CRO (WorldCare Clinical, LLC) for 5 months in 2013. Dr. Gatsonis has also acted as a paid consultant and member of the Medical Advisory Board for Wilex AG, as a paid consultant for Endocyte Inc, and as a member of the Board of Directors for Frontier Science.
Supporting Information
Additional Supporting Information may be found in the online version of this article.
Supplementary Information
REFERENCES
- 1.American Cancer Society. Cancer Facts & Figures 2013. Atlanta, GA: American Cancer Society; 2013. [Google Scholar]
- 2.National Lung Screening Trial Research Team. Aberle DR, Adams AM, Berg CD, et al. Reduced lung-cancer mortality with low-dose computed tomographic screening. N Engl J Med. 2011;365:395–409. doi: 10.1056/NEJMoa1102873. [DOI] [PMC free article] [PubMed] [Google Scholar]
- 3.Moyer VA US Preventive Services Task Force. Screening for Lung Cancer: U.S. Preventive Services Task Force Recommendation Statement. Ann Intern Med. 2014;160:330–338. doi: 10.7326/M13-2771. [DOI] [PubMed] [Google Scholar]
- 4.Wender R, Fontham ET, Barrera E, Jr, et al. American Cancer Society lung cancer screening guidelines. CA Cancer J Clin. 2013;63:106–117. doi: 10.3322/caac.21172. [DOI] [PMC free article] [PubMed] [Google Scholar]
- 5.O'Connor GT, Hatabu H. Lung cancer screening, radiation, risks, benefits, and uncertainty. JAMA. 2012;307:2434–2435. doi: 10.1001/jama.2012.6096. [DOI] [PubMed] [Google Scholar]
- 6.Harris RP, Sheridan SL, Lewis CL, et al. The harms of screening: A proposed taxonomy and application to lung cancer screening. JAMA Intern Med. 2014;174:281–285. doi: 10.1001/jamainternmed.2013.12745. [DOI] [PubMed] [Google Scholar]
- 7.Henschke CI, McCauley DI, Yankelevitz DF, et al. Early lung cancer action project: a summary of the findings on baseline screening. Oncologist. 2001;6:147–152. doi: 10.1634/theoncologist.6-2-147. [DOI] [PubMed] [Google Scholar]
- 8.Swensen SJ, Jett JR, Sloan JA, et al. Screening for lung cancer with low-dose spiral computed tomography. Am J Respir Crit Care Med. 2002;165:508–513. doi: 10.1164/ajrccm.165.4.2107006. [DOI] [PubMed] [Google Scholar]
- 9.MacMahon H, Austin JHM, Gamsu G, et al. Guidelines for management of small Pulmonary nodules detected on CT scans: a statement from the Fleischner Society. Radiology. 2005;237:395–400. doi: 10.1148/radiol.2372041887. [DOI] [PubMed] [Google Scholar]
- 10.van Klaveren RJ, Oudkerk M, Prokop M, et al. Management of lung nodules detected by volume CT scanning. N Engl J Med. 2009;361:2221–2229. doi: 10.1056/NEJMoa0906085. [DOI] [PubMed] [Google Scholar]
- 11.Hafslund B, Espehaug B, Nortvedt MW. Effects of false-positive results in a breast screening program on anxiety, depression and health-related quality of life. Cancer Nurs. 2012;35:E26–E34. doi: 10.1097/NCC.0b013e3182341ddb. [DOI] [PubMed] [Google Scholar]
- 12.van den Bergh KA, Essink-Bot ML, Borsboom GJ, et al. Short-term health-related quality of life consequences in a lung cancer CT screening trial (NELSON) Br J Cancer. 2010;102:27–34. doi: 10.1038/sj.bjc.6605459. [DOI] [PMC free article] [PubMed] [Google Scholar]
- 13.Byrne MM, Weissfeld J, Roberts MS. Anxiety, fear of cancer, and perceived risk of cancer following lung cancer screening. Med Decis Making. 2008;28:917–925. doi: 10.1177/0272989X08322013. [DOI] [PubMed] [Google Scholar]
- 14.Jacobs PC, Mali WP, Grobbee DE, van der Graaf Y. Prevalence of incidental findings in computed tomographic screening of the chest: a systematic review. J Comput Assist Tomogr. 2008;32:214–221. doi: 10.1097/RCT.0b013e3181585ff2. [DOI] [PubMed] [Google Scholar]
- 15.National Lung Screening Trial Research Team. Aberle DR, Berg CD, Black WC, et al. The National Lung Screening Trial: overview and study design. Radiology. 2011;258:243–253. doi: 10.1148/radiol.10091808. [DOI] [PMC free article] [PubMed] [Google Scholar]
- 16.Ware JE, Jr, Sherbourne CD. The MOS 36-item short-form health survey (SF-36). I. Conceptual Framework and Item Selection. Med Care. 1992;30:473–483. [PubMed] [Google Scholar]
- 17.Ware JE, Jr, Snow KK, Kosinski M, Gandek B. SF-36 Health Survey: Manual and Interpretation Guide. Boston, MA: New England Medical Center, The Health Institute; 1993. [Google Scholar]
- 18.Cormier L, Guillemin F, Valéri A, Fournier G, Cussenot O, Mangin P, Litwin MS. Impact of prostate cancer screening on health-related quality of life in at-risk families. Urology. 2002;59:901–906. doi: 10.1016/s0090-4295(02)01552-2. [DOI] [PubMed] [Google Scholar]
- 19.Essink-Bot ML, de Koning HJ, Nijs HG, Kirkels WJ, van der Maas PJ, Schröder FH. Short-term effects of population-based screening for prostate cancer on health-related quality of life. J Natl Cancer Inst. 1998;90:925–931. doi: 10.1093/jnci/90.12.925. [DOI] [PubMed] [Google Scholar]
- 20.Hensley ML, Robson ME, Kauff ND, et al. Pre- and postmenopausal high-risk women undergoing screening for ovarian cancer: anxiety, risk perceptions, and quality of life. Gynecol Oncol. 2003;89:440–446. doi: 10.1016/s0090-8258(03)00147-1. [DOI] [PubMed] [Google Scholar]
- 21.Taupin D, Chambers SL, Corbett M, Shadbolt B. Colonoscopic screening for colorectal cancer improves quality of life measures: a population-based screening study. Health Qual Life Outcomes. 2006;4:82. doi: 10.1186/1477-7525-4-82. [DOI] [PMC free article] [PubMed] [Google Scholar]
- 22.Clauser SB, Arora NK, Bellizzi KM, Haffer SC, Topor M, Hays RD. Disparities in HRQOL of cancer survivors and non-cancer managed care enrollees. Health Care Financ Rev. 2008;29:23–40. [PMC free article] [PubMed] [Google Scholar]
- 23.McGovern PM, Gross CR, Krueger RA, Engelhard DA, Cordes JE, Church TR. False-positive cancer screens and health-related quality of life. Cancer Nurs. 2004;27:347–352. doi: 10.1097/00002820-200409000-00003. [DOI] [PubMed] [Google Scholar]
- 24.Jenkinson C, Coulter A, Wright L. Short form 36 (SF36) health survey questionnaire: normative data for adults of working age [see comments] Br Med J. 1993;306:1437–1440. doi: 10.1136/bmj.306.6890.1437. [DOI] [PMC free article] [PubMed] [Google Scholar]
- 25.Ware JE, Kosinski M, Keller SK. SF-36® Physical and Mental Health Summary Scales: A User's Manual. Boston, MA: The Health Institute; 1994. [Google Scholar]
- 26.Spielberger CD. Manual for the State-Trait Anxiety Inventory (Form Y) Palo Alto, CA: Consulting Psychologists; 1983. [Google Scholar]
- 27.Hays RD, Woolley JM, et al. The concept of clinically meaningful difference in health-related quality-of-life research. How meaningful is it? Pharmacoeconomics. 2000;18:419–423. doi: 10.2165/00019053-200018050-00001. [DOI] [PubMed] [Google Scholar]
- 28.American College of Radiology Imaging Network, ACRIN #6654, Contemporary Screening for the Detection of Lung Cancer.
- 29.Robert SA, Cherepanov D, Palta M, Dunham NC, Feeny D, Fryback DG. Socioeconomic status and age variations in health-related quality of life: results from the national health measurement study. J Gerontol B Psychol Sci Soc Sci. 2009;64:378–389. doi: 10.1093/geronb/gbp012. [DOI] [PMC free article] [PubMed] [Google Scholar]
- 30.Cherepanov D, Palta M, Fryback DG, Robert SA, Hays RD, Kaplan RM. Gender differences in multiple underlying dimensions of health-related quality of life are associated with sociodemographic and socioeconomic status. Med Care. 2011;49:1021–1030. doi: 10.1097/MLR.0b013e31822ebed9. [DOI] [PMC free article] [PubMed] [Google Scholar]
- 31.Huber PJ. Robust Statistics. New York, NY: Wiley; 1981. [Google Scholar]
- 32.Cameron AC, Trevedi PK. Regression Analysis of Count Data. New York, NY: Cambridge University Press; 1998. [Google Scholar]
- 33.Park ER, Gareen IF, Jain A, et al. Examining whether lung screening changes risk perceptions: National Lung Screening Trial participants at 1-year follow-up. Cancer. 2013;119:1306–1313. doi: 10.1002/cncr.27925. [DOI] [PMC free article] [PubMed] [Google Scholar]
- 34.Park ER, Streck JM, Gareen IF, et al. A qualitative study of lung cancer risk perceptions and smoking beliefs among National Lung Screening Trial participants. Nicotine Tob Res. 2014;16:166–173. doi: 10.1093/ntr/ntt133. [DOI] [PMC free article] [PubMed] [Google Scholar]
- 35.Weinberg CR. On pooling across strata when frequency matching has been followed in a cohort study. Biometrics. 1985;41:117–127. [PubMed] [Google Scholar]
Associated Data
This section collects any data citations, data availability statements, or supplementary materials included in this article.
Supplementary Materials
Supplementary Information