

Abstract
Mucolipidosis type IV (MLIV) is caused by loss of function mutations in the TRPML1 ion channel. We previously reported that tissue zinc levels in MLIV were abnormally elevated; however, the mechanism behind this pathologic accumulation remains unknown. Here, we identify transmembrane (TMEM)-163 protein, a putative zinc transporter, as a novel interacting partner for TRPML1. Evidence from yeast two-hybrid, tissue expression pattern, co-immunoprecipitation, mass spectrometry, and confocal microscopy studies confirmed the physical association of TMEM163 with TRPML1. This interaction is disrupted when a part of TMEM163's N-terminus was deleted. Further studies to define the relevance of their interaction revealed that the plasma membrane (PM) levels of TMEM163 significantly decrease when TRPML1 is co-expressed in HEK-293 cells, while it mostly localizes within the PM when co-expressed with a mutant TRPML1 that distributes mostly in the PM. Meanwhile, co-expression of TMEM163 does not alter TRPML1 channel activity, but its expression levels in MLIV patient fibroblasts are reduced, which correlate with marked accumulation of zinc in lysosomes when these cells are acutely exposed to exogenous zinc (100 μM). When TMEM163 is knocked down or when TMEM163 and TRPML1 are co-knocked down in HEK-293 cells treated overnight with 100 nM zinc, the cells have significantly higher intracellular zinc levels than untreated control. Overall, these findings suggest that TMEM163 and TRPML1 proteins play a critical role in cellular zinc homeostasis, and thus possibly explain a novel mechanism for the pathological overload of zinc in MLIV disease.
Keywords: Lysosomes, Zinc, Mucolipidosis IV, TMEM163, SV31
Mucolipidosis type IV (MLIV; OMIM #252650) is a genetic disorder with clinical manifestations of progressive degeneration of neurons and retinal cells, cataract formation, achlorhydria with serum hypergastrinemia, and anemia (1). MLIV is caused by a mutation or deletion in the MCOLN1 gene (2), whose protein product, Transient Receptor Potential Mucolipin-1 (TRPML1), belongs to the TRP family of ion channel proteins (3). TRPML1 is widely expressed in tissues and organs (4, 5). It is a lysosomal membrane protein associated with metal homeostasis, endosomal-lysosomal biogenesis, maintenance of lysosomal maturation and pH, lipid metabolism, membrane trafficking, and autophagy (6-13). TRPML1 contains six predicted transmembrane (6TM) domains with channel features showing inward rectification, and non-selective permeability to calcium (Ca2+), zinc (Zn2+), iron (Fe2+), and manganese ions (Mn2+) (4, 11, 14). The general phenotypic characteristics of neurons and other cell types affected in MLIV include large hyperacidic lysosomes, accumulation of membranous lamellar vacuoles, mitochondrial fragmentation, and abnormal autophagy (8-10, 15). More recently it was found that abnormal levels of specific trace metals have been implicated as a potential contributing factor to disease phenotype and progressive cell degeneration in MLIV (11, 12).
We previously reported that Zn2+ levels are significantly elevated in the post-mortem brains of TRPML1-null mice using inductively-couple plasma mass spectrometry (ICP-MS) and in cultured MLIV patient fibroblasts using N-(6-methoxy-8-quinolyl)-p-toluenesulfonamide (TSQ) fluorometric assay (12). Using the TSQ assay, we also found that RNA interference (RNAi)-induced knock down of endogenous TRPML1 protein levels in human embryonic kidney (HEK)-293 cells results in accumulation of intracellular Zn2+ that is highly prominent within enlarged lysosomes in the absence of exogenous zinc exposure. Recently, Kukic et al. (2013) (13) confirmed our observation using RNAi of TRPML1 in HeLa cells; however, they only observed intracellular zinc accumulation in enlarged lysosomes of TRPML1 knocked down cells upon exposure with 100 μM zinc for 48 hours. Furthermore, the authors implicated the vesicular zinc transporter (ZnT)-4, but not ZnT2, with regard to the regulation of zinc translocation between the lysosomes and cytoplasm when TRPML1 is knocked down (13). Overall, these findings indicate that the functional loss of TRPML1 protein is directly coupled to intracellular Zn2+ homeostasis in the cytosol and lysosomes. These observations impact our understanding of MLIV pathology, because the brain contains a sizeable amount of a chelatable zinc pool that is co-released with glutamate in the synapse during normal neuronal communication (16). When this pool of chelatable zinc is not properly buffered and is released uncontrollably (through oxidative stress, ischemia, or trauma), it kills neurons and glial cells by apoptosis or necrosis (17-22). Thus, protein transporters tightly control cerebral zinc release within the neuronal synapse, while cytosolic zinc levels taken up by neurons are mostly sequestered by zinc-binding proteins such as Metallothionein (MT) (17, 23). During pathological events, however, cytoplasmic zinc overload accumulates in the lysosomes (24-26), possibly as a protective response to temporarily store the ions until the cells could produce more MT, or through lysosomal exocytosis as recently reported by Kukic et al. (2014) (27).
In this report, we identified transmembrane (TMEM)-163 protein as a novel interaction partner for TRPML1 ion channel. TMEM163, also known as synaptic vesicle 31 (SV31), was first identified by proteomics of rodent brain synaptosomes (28). It was observed to bind zinc and was detected in certain glutamatergic and γ-aminobutyric acid (GABA)-ergic neuronal populations (28, 29). Our analysis shows that human TMEM163 transcripts are detected in many tissues, which coincides well with TRPML1 expression (30), notably in the brain, lung and testis. We observed that TMEM163 mRNA and protein expression levels are reduced in MLIV fibroblast cells, which correlates with increased lysosomal zinc levels. Meanwhile, co-expression of TMEM163 with a PM-variant of TRPML1 and cell surface biotinylation of TMEM163 with wild-type TRPML1 revealed that the ion channel influences the subcellular distribution of TMEM163. We then found that RNAi of TMEM163, or RNAi of both TMEM163 and TRPML1 results in a significant elevation of intracellular zinc levels, which further supports our observations in MLIV fibroblast cells. Thus, we propose that both TMEM163 and TRPML1 proteins serve to regulate intracellular chelatable Zn2+ distribution in the cytoplasm and vesicular compartments such as lysosomes and synaptic vesicles. Our findings reveal for the first time the possible mechanism behind the perturbation of intracellular zinc levels in MLIV disease.
Results
The split-ubiquitin membrane-based yeast two-hybrid (mb-YTH) assay is a genetic method for in vivo detection of membrane protein interactions that is based on the reconstitution of ubiquitin molecule in Saccharomyces cerevisiae (31). Using mouse Trpml1 cDNA as bait, we identified one independent clone of transmembrane (Tmem)-163 as an interactor of Trpml1. Vector sequencing revealed that the Tmem163 clone that bound Trpml1 was not a full-length sequence, but it contained a portion of the N-terminus region, the predicted transmembrane domains, and the C-terminus region. The positive controls, Fur4-NubI and Ost1-NubI, showed growth of yeast expressing the bait, but not the negative controls Fur4-NubG, Ost1-NubG, and NubG (Figure 1A). To further show the specificity of the Trpml1-Tmem163 interaction, we used mouse Trpml3 cDNA as bait and found that Tmem163 did not interact with Trpml3 (Supplemental Figure S1A). Trpml3, however, exhibited a non-specific interaction with the negative controls, Fur4-NubG and Ost1-NubG, but not with NubG.
Figure 1. Membrane-based yeast two-hybrid assay and tissue expression pattern analysis of TMEM163 transcripts using human adult multiple tissue cDNA (MTC) panel.
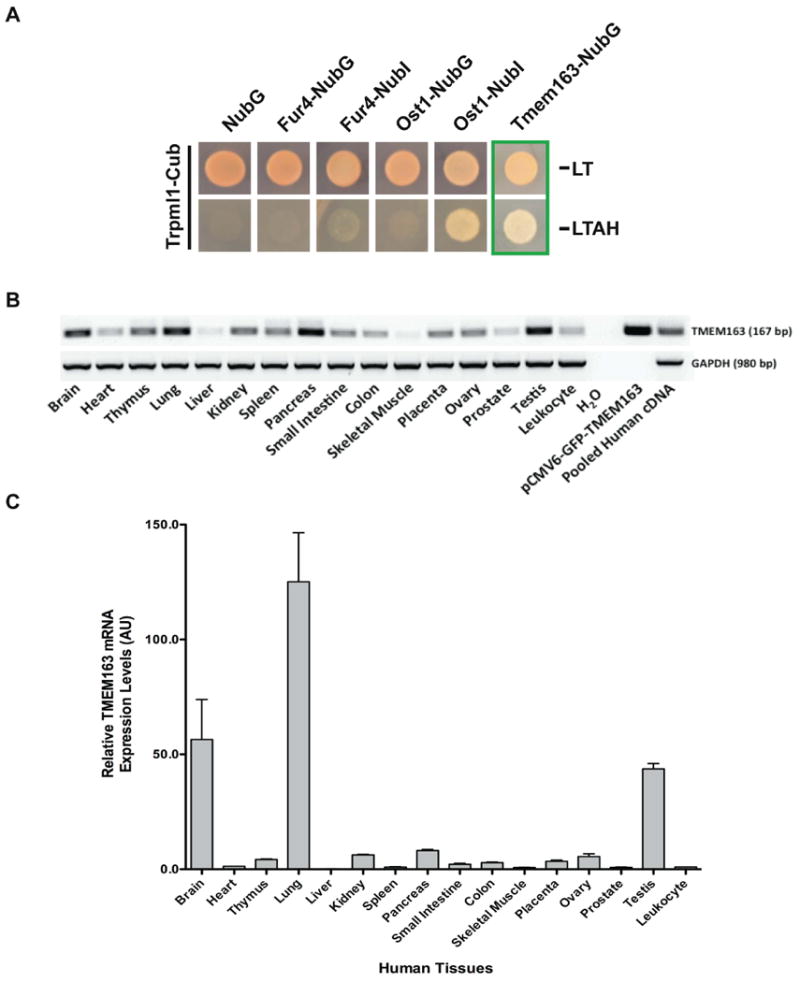
A) NMY51 yeast cells carrying the indicated constructs were spotted on −leu −trp (−LT) agar plates that select for expressed plasmids, or high stringent −leu −trp −ade −his (−LTAH) plus 5 mM 3-AT agar plates that assay for interaction with mouse Trpml1-Cub. Tmem163-NubG was confirmed to bind and complement Trpml1-Cub as evidenced by complete growth in the high stringent –LTAH selection plate. NubG, Fur4-NubG, and Ost1-NubG are negative controls; Fur4-NubI and Ost1-NubI are positive controls. B) Standard RT-PCR analysis of human TMEM163 transcripts using the normalized MTC panel described in the Materials and Methods section. The primer set used for this experiment was the same as the qPCR primers shown on Supplemental Table S1. The TMEM163 amplicon size is 167 bp. No template control (H2O) represented the negative control, while pCMV6-GFP-TMEM163 and non-normalized pooled cDNA were used as positive controls. The housekeeping gene, GAPDH, was used as an internal loading control. C) Real-time qPCR analysis of human TMEM163 using the same MTC panel. Real-time qPCR was analyzed as described in the Materials and Methods section. The housekeeping gene, 18s rRNA, was used as a reference (normalizer), and the peripheral blood leukocyte tissue was used as a calibrator (value = 1). Data are represented as mean ± SEM (n = 3). AU, arbitrary unit; bp, basepair.
To validate the Trpml1-Tmem163 interaction, we heterologously expressed Trpml1 and Tmem163 in HEK-293 cells, and upon co-immunoprecipitation (co-IP), we observed Tmem163 co-eluting with Trpml1 (Supplemental Figure S1B). To be certain of the identity of the protein co-eluting with Trpml1, we ran the eluted samples in a polyacrylamide gel, Coomassie stained it, and excised the corresponding band for mass spectrometry (MS). Bioinformatics analysis of the MS data confirmed the identity of Tmem163 co-eluting with Trpml1 (Supplemental Figure S1C). We then performed subcellular co-localization experiments using SH-SY5Y neuroblastoma cells by co-expressing Tmem163 and Trpml1 each tagged with a fluorescent protein (Supplemental Figure S1D). We found that Tmem163 partially co-localized with Trpml1 in vesicular structures, but that it was also detected within the plasma membrane.
We subsequently extended our study using human TMEM163 and TRPML1 expression constructs to ensure its relevance to MLIV. First, we analyzed the tissue mRNA levels of TMEM163 to gain more information about its possible function, and to determine if its expression in human tissues overlaps with that of TRPML1. Using standard PCR and real-time quantitative PCR, we found that the relative transcript expression of TMEM163 was widely distributed among the human tissues analyzed (Figure 1B) with the brain, lung, and testis having the highest relative mRNA levels (Figure 1C). This tissue distribution pattern of TMEM163 shared a close commonality with that of TRPML1 as previously reported by us (30).
To verify the interaction of TMEM163 and TRPML1, peptide-tagged constructs were heterologously expressed in HEK-293 cells. Co-IP of transfected cell lysates showed that TMEM163 and TRPML1 physically interacted with each other whether we immunoprecipitated TMEM163 (Figure 2A) or TRPML1 (Figure 2B). Additional co-IP control experiments using single transfection trials showed that the interaction between TRPML1 and TMEM163 was specific (Supplemental Figure S2A). We then used another lysosome-associated protein called TMEM176A, which we previously identified as a binding partner of TRPML2 through a genetic screen using mb-YTH. We co-immunoprecipitated TMEM176A with TRPML2 (Supplemental Figure S2B) or TMEM163 (Supplemental Figure S2C) and found that TMEM176A did not interact with TMEM163, but it interacted with TRPML2 as expected (positive control).
Figure 2. Biochemical studies of the interaction between human TMEM163 and TRPML1 proteins.
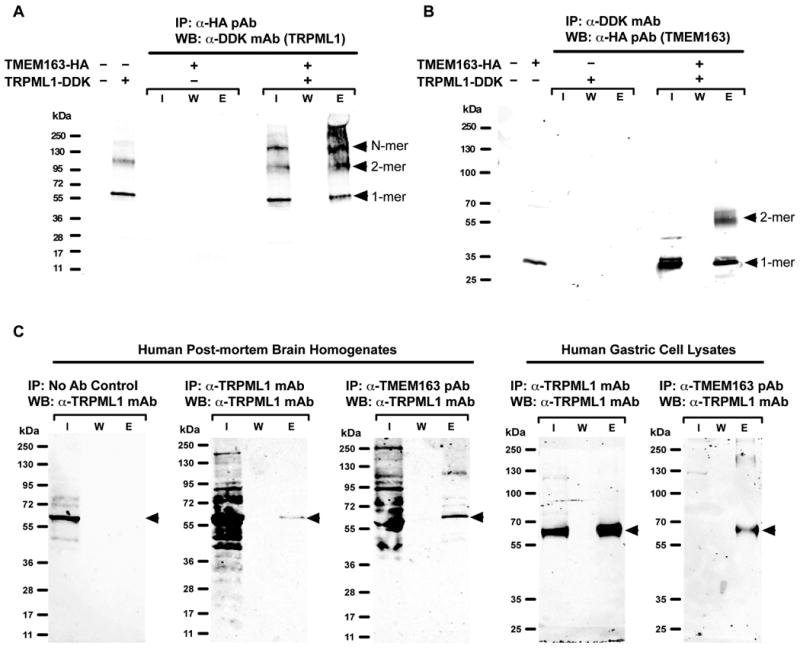
A) Representative Western blot (WB) image of heterologously expressed human TMEM163-HA and TRPML1-DDK showing that TRPML1 co-eluted upon co-IP with TMEM163 protein. Arrowheads indicate the TRPML1 protein in monomeric and multimeric forms. I, input; W, wash; E, elution; IP, immunoprecipitation; mAb, monoclonal antibody; pAb, polyclonal antibody. B) Representative WB image of heterologously expressed human TMEM163-HA and TRPML1-DDK showing that TMEM163 co-eluted upon co-IP with TRPML1 protein. Arrowheads indicate monomeric and dimeric forms of TMEM163. Note that the monomeric form of TMEM163 appears as a doublet band. The top monomeric band is presumably due to post-translational modification. C) Representative WB image of native TMEM163 and TRPML1 proteins from postmortem human cerebral cortex homogenates (left panel) and human HGT-1 gastric cell line lysates (right panel). The no-antibody (No Ab) negative control showed that the beads do not bind to endogenous TRPML1 non-specifically. Using both human brain tissue and gastric cell samples, the data show that the anti-TRPML1 mAb elutes endogenous TRPML1. Similarly, the co-IP of endogenous TMEM163 protein with anti-TMEM163 pAb co-eluted the endogenous TRPML1 protein as evidenced by WB using anti-TRPML1 mAb. This result further confirms the physical interaction between native TMEM163 and TRPML1 proteins.
In order to show that the interaction between TRPML1 and TMEM163 occurs within the native cell environment, we first validated the specificity of the anti-TRPML1 monoclonal and anti-TMEM163 polyclonal antibodies used in the study. We tested both antibodies using over-expressed and endogenous protein samples (Supplemental Figures S3A and S2B, respectively). We found that both antibodies detected their corresponding native proteins. Co-IP of native TMEM163 and TRPML1 proteins using postmortem human cerebral cortex homogenates and HGT-1 gastric cell lysates confirmed the interaction between the two endogenous proteins (Figure 2C), and further substantiated the co-IP data we obtained from heterologous expression study.
To provide additional corroboration of our observations, we performed subcellular co-localization studies of heterologously expressed TMEM163 and TRPML1 using primary human fibroblasts and HEK-293 cells. Confocal microscopy revealed that co-expressed fluorescent-tagged TRPML1 and TMEM163 partially co-localized within subcellular compartments with a punctate distribution pattern (Figure 3A). TMEM163 was observed within the plasma membrane (PM) and it also co-localized with lysosomal associated membrane protein 1 (LAMP1), a marker for late endosomes and lysosomes (28, 29, 32, 33). In HEK-293 cells, co-expression of TMEM163 with a TRPML1 mutant construct lacking the lysosomal targeting sequence (LTS) motif, we refer to as TRPML1(NC), produced a discernible increase in the localization of TRPML1 within the PM along with TMEM163 (Figure 3A). To determine if TRPML1(NC) is affecting the co-localization of TMEM163 in HEK-293 cells, we quantified the subcellular co-localization of both proteins and found that 75% of the cells (n = 50) have higher PM co-localization as exemplified by a representative image in Figure 3A. To ascertain the distribution levels of TMEM163 protein expressed in human fibroblast and HEK-293 cells, we counted the percentage of its vesicular co-localization pattern when co-expressed with LAMP1, or with TRPML1. The data revealed that in fibroblasts, between 70-80% of TMEM163-positive vesicles were also positive for TRPML1, or for the late endosomal and lysosomal marker, LAMP1. In HEK-293 cells, between 60-70% of TMEM163-positive vesicles were also positive for TRPML1 (Figure 3B).
Figure 3. Analyses of the subcellular distribution of co-expressed TRPML1 and TMEM163 proteins and the effect of their interaction on TRPML1 channel function.
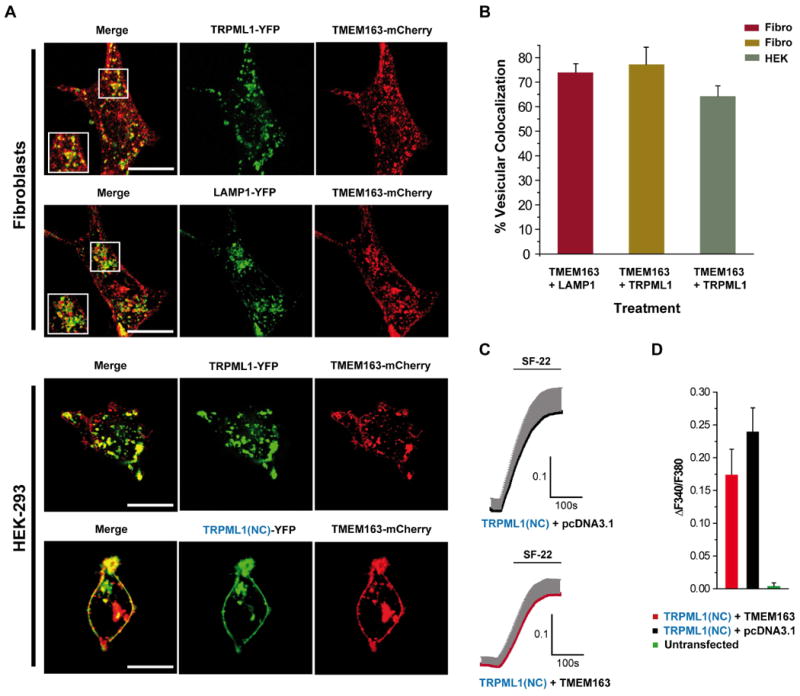
A) Representative laser scanning micrographs showing subcellular co-localization of TRPML1-YFP and TMEM163-mCherry upon heterologous expression in human primary fibroblast cells (top panel) and HEK-293 cells (bottom panel). TMEM163-mCherry partially co-localized with TRPML1-YFP and LAMP1-YFP (a marker for late endosomes and lysosomes). TMEM163 localized on the plasma membrane, but also exhibited a punctate distribution pattern with either TRPML1 or LAMP1. In HEK-293 cells, co-expression of TMEM163-mCherry with the TRPML1(NC)-YFP construct mutant lacking the N- and C-terminal lysosomal targeting sequence motifs showed a more pronounced localization pattern in the plasma membrane compared to wild-type (WT) TRPML1-YFP. Scale bar: 20 μm. B) Cell count showing the percentage of vesicular co-localization pattern between co-expressed TMEM163 plus LAMP1, and TMEM163 plus TRPML1 (for both human fibroblast and HEK-293 cells). The data showed that 70-80% of TMEM163 co-localized with LAMP1 and TRPML1 in late endosomes and lysosomes of fibroblast cells, while 60-70% of TMEM163 co-localized with TRPML1 in late endosomes and lysosomes of HEK-293 cells (n = 50 cells). C) Two representative Fura-2 calcium imaging traces of co-expressed TRPML1(NC)-YFP mutant and TMEM163-mCherry in HEK-293 cells (top panel) compared to TRPML1(NC)-YFP co-expressed with empty pCDNA 3.1 vector in HEK-293 cells (bottom panel). The TRPML1(NC) mutant construct has higher plasma membrane distribution and is thus, ideal for calcium imaging studies. The transfected cells were activated with 10 μM of the TRPML1 activator, SF-22 (5-chloro-N-(2-piperidin-1-ylphenyl)thiophene-2-sulfonamide). D) Graphical summary of the calcium imaging experiments, which demonstrated that co-expression of TMEM163 with TRPML1 resulted in a modest reduction of calcium entry, albeit not significant. Untransfected control cells on the same cover slip did not respond to SF-22 stimulation. Data shown are mean ± SEM values of 5-10 cells for each treatment condition.
We were interested in investigating how might a physical interaction between TMEM163 and TRPML1(NC) affect the function of this PM-variant ion channel. Given that the wild-type (WT) TRPML1 protein is mostly detected in lysosomes, TRPML1(NC) made it easier for us to assess the potential effect of TMEM163 on its channel activity. We thus analyzed if TMEM163 influences the channel activity of TRPML1(NC), because we and others have previously reported that certain binding partners of TRP ion channels regulate their channel activity (34-37). We performed Fura-2 Ca2+-imaging studies in HEK-293 cells co-expressing the TRPML1(NC) mutant and TMEM163 using a known TRPML1 small molecule activator, SF-22 (30) (Figure 3C). We observed that calcium influx mediated by TRPML1(NC) mutant was not significantly altered in the presence of TMEM163 when compared with the empty pcDNA vector control (Figure 3D). The specificity of SF-22's effect on TRPML1 is shown in Supplemental Figure S4.
To investigate the functional relationship between TRPML1 and TMEM163 proteins in the context of MLIV, we cultured MLIV patient fibroblast cells (GM02527 and GM02048) that are missing TRPML1 proteins (TRPML1−/− knockout), and a WT control (GM03440). We previously reported using spectrofluorometric assay that these MLIV patient cells have significantly higher levels of intracellular zinc (12). However, our previous analysis measured the total intracellular zinc levels based on the relative fluorescence produced by TSQ, a high affinity zinc-specific dye that only fluoresces when bound to zinc (38). To determine if zinc accumulates in the cytoplasm or lysosomes of the MLIV and WT control fibroblast cells used above, we performed confocal microscopy and analyzed FluoZin-3 fluorescence in cells transiently exposed to exogenous zinc levels (100 μM ZnCl2 for 3 hours), or untreated control. The cells not exposed to zinc allowed us to determine the possible contribution of autofluorescent lipofuscin structures typically seen in MLIV cells. We observed that in cells not exposed to zinc, MLIV fibroblast cells have more FluoZin-3-positive vesicles compared to WT cells (Figure 4A). MLIV fibroblast cells not exposed to zinc have relatively less fluorescence than the MLIV cells incubated with exogenous zinc (Figure 4A, compare left panel versus right panel).
Figure 4. Inverse correlation between intracellular zinc levels and TMEM163 expression in MLIV patient fibroblast cells.
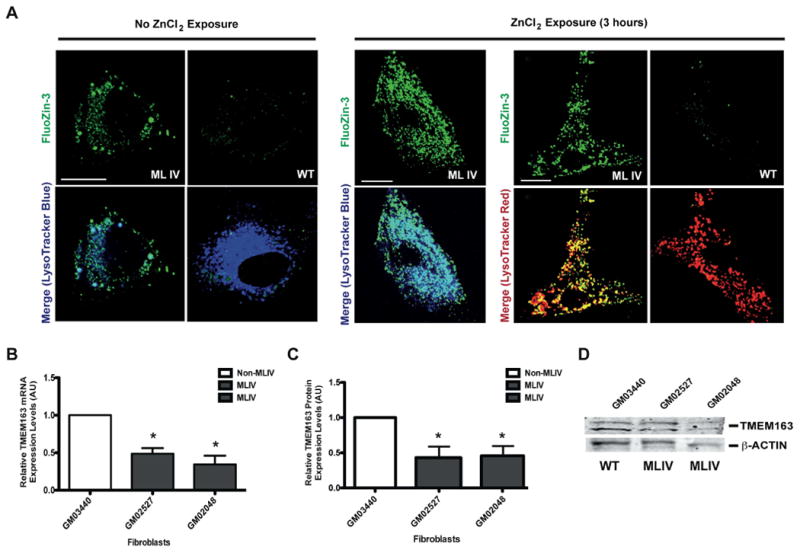
A) Representative confocal micrographs of MLIV patient and wild-type (WT) control fibroblast cells in the absence (left panel) or presence of 100 μM ZnCl2 (3 h exposure, right panel). The cells were co-stained with FluoZin-3 and Lysotracker™ Blue or Red. In the absence of exogenous zinc, vesicular structures in MLIV fibroblast cells exhibited positive FluoZin-3 fluorescence while WT cells have relatively less FluoZin-3 fluorescence. When cells were acutely exposed to zinc, MLIV fibroblasts showed a more pronounced FluoZin-3 fluorescence when compared to WT control fibroblasts (right panel). Scale bar: 20 μm (No ZnCl2, left panel), 10 μm (With ZnCl2, right panel). B) Relative TMEM163 mRNA expression levels in MLIV (GM02527 and GM02048) and WT control (GM03440) fibroblast cells. Real-time qPCR analysis showed that the relative TMEM163 transcripts were markedly reduced in MLIV cells compared with control fibroblast cells. Data are represented as mean ± SEM (n = 4, Student's t-test, paired, two-tailed, *p < 0.05). C) Relative TMEM163 protein levels in MLIV (GM02527 and GM02048) and WT control (GM03440) fibroblast cells. The relative TMEM163 protein expression levels were analyzed by quantifying the integrated density value (IDV) of each band using NIH ImageJ. All IDV values were normalized against the IDV values of the housekeeping gene, β-actin. The reduction of relative TMEM163 protein level was consistent with the decreased mRNA levels shown in B. Data are represented as mean ± SEM (n = 3, Student's t-test, paired, two-tailed, *p < 0.05). D) Representative WB image of TMEM163 protein from non-MLIV and MLIV patient fibroblast cells quantified in C. The samples were blotted with anti-TMEM163 pAb. β-Actin was used as sample loading control.
The prominent FluoZin-3-positive lysosomes in MLIV fibroblast cells, however, did not fully explain how TMEM163 might play its part in the abnormal accumulation of zinc, especially in the brain, where we previously observed abnormally high zinc levels in post-mortem brain tissues of TRPML1−/− knockout (KO) mice (12). Since post-mortem brain tissues of TRPML1−/− KO mice or MLIV patients were not available, we analyzed the transcript and protein levels of TMEM163 using the same MLIV and WT control fibroblast cells. Our analyses revealed that the transcript (Figure 4B) and protein levels (Figures 4C-4D) of TMEM163 were markedly reduced in MLIV as opposed to WT fibroblast cells as evidenced by real-time qPCR and Western blot (WB) techniques, respectively.
We then investigated the association between abnormal intracellular zinc levels and reduced TMEM163 expression in MLIV fibroblast cells using RNAi in HEK-293 cells. In this study, we either knocked down or overexpressed TMEM163 and TRPML1 together, or individually. Twenty-four hours post-transfection, we exposed the cells for 24 hours to a very low amount of ZnCl2 (100 nM) to prevent cytotoxicity. Spectrofluorometric analysis of cells incubated with FluoZin-3 revealed that when TMEM163 is knocked down (KD), a significant increase in intracellular zinc levels was seen when compared with untreated control (Figure 5A). Co-knockdown (co-KD) of TMEM163 and TRPML1 also produced a significant increase in intracellular zinc levels when compared with untreated control. On the other hand, overexpression (OE) of TMEM163 produced a small, but not significant increase of FluoZin-3 fluorescence relative to untreated control. Co-OE of TMEM163 and TRPML1 produced a similar relative fluorescence to that of OE TMEM163, which was slightly higher than untreated control, but the value was not significant. Meanwhile, KD or OE of TRPML1 resulted in a relatively small, but not significant decrease of FluoZin-3 fluorescence when compared with untreated control.
Figure 5. The effect of TRPML1-TMEM163 interaction on intracellular zinc flux and cell surface levels of TMEM163.
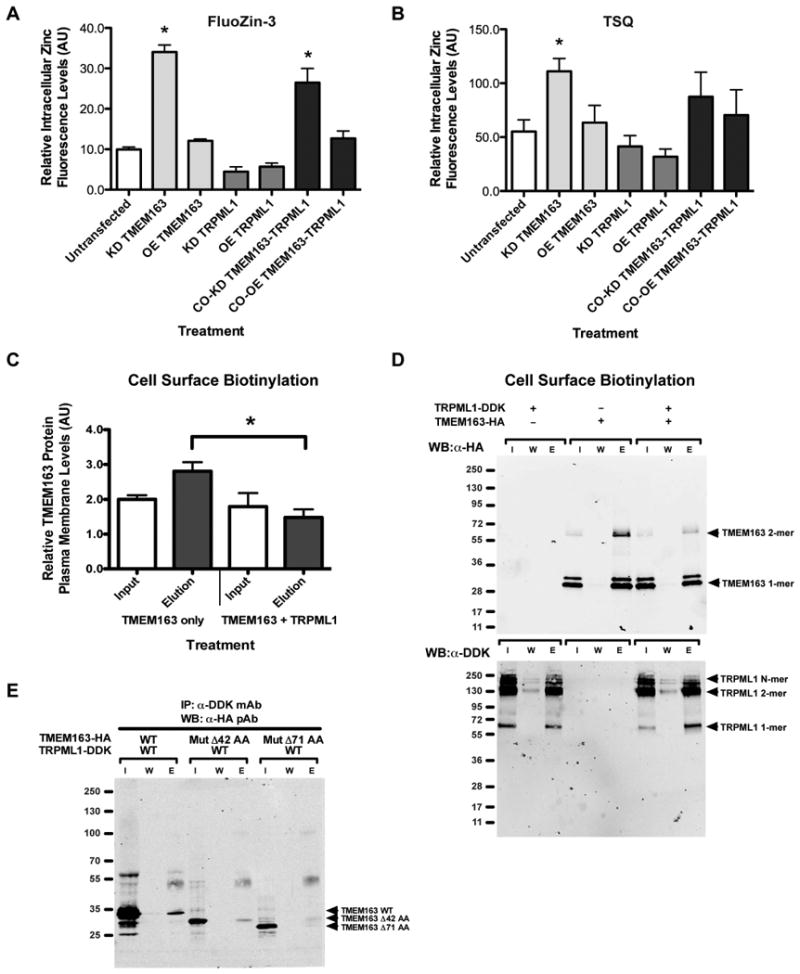
A) FluoZin-3 and B) TSQ spectrofluorometric assays of intracellular chelatable zinc concentrations of each treatment. Cultured HEK-293 cells were exposed to ZnCl2 (100 nM) for 24 h after they were transiently transfected overnight with shRNA (KD) or overexpression (OE) constructs in order to knockdown and overexpress both proteins, respectively. Co-overexpression (co-OE) and co-knockdown (co-KD) were also performed using the same treatment conditions. In the FluoZin-3 assay, significant elevations of intracellular zinc levels were observed in KD TMEM163 and co-KD TMEM163-TRPML1 cells when compared with untreated control. In the TSQ assay, a significant increase of intracellular zinc levels in KD TMEM163 was observed. Although the co-KD TMEM163-TRPML1 treatment was not significant due to higher data variability, the treatment displayed a similar trend to that of the FluoZin-3 value. Data are represented as mean ± SEM (n = 6, ANOVA and Dunnet's post-hoc multiple comparisons test of untreated control versus treated samples, two-tailed, *p < 0.05). C) A graphical summary of calculated IDV from Input and Elution bands of TMEM163 alone, and TMEM163 plus TRPML1. When co-expressed with TRPML1, the relative cell surface levels of TMEM163 protein revealed a significant reduction (50%) compared to single TMEM163 expression. The IDV was determined using NIH ImageJ and the numerical values were calculated by normalizing the upper TMEM163 monomeric band against the lower monomeric band. Data are represented as mean ± SEM (n = 3, Student's t-test, paired, two-tailed, *p < 0.05). D) A representative WB image of cell surface biotinylation of HEK-293 cells expressing TMEM163-HA only, TRPML1-DDK only, and TMEM163-HA with TRPML1-DDK immunoblotted with anti-HA pAb (top panel). I, input; W, wash, E, elution. The bottom panel shows a representative WB image of the same experiment as above, but immunoblotted with anti-DDK mAb to confirm TRPML1 protein co-expression. E) Representative WB image of co-IP experiments of TRPML1 heterologously co-expressed with TMEM163 WT, TMEM163-Δ42 AA deletion mutant, and TMEM163-Δ71 AA deletion mutant. The elution profile of TMEM163-Δ42 mutant protein showed a low intensity band suggesting a weak interaction with TRPML1. Meanwhile, the elution band for TMEM163-Δ71 mutant protein did not show, which suggested a loss of physical interaction with TRPML1.
We then used the TSQ dye to verify the FluoZin-3 fluorometric data. Our results showed that the TSQ fluorescence confirmed a significant increase of intracellular zinc levels upon TMEM163 KD (Figure 5B). Note, however, that when TMEM163 and TRPML1 were co-KD, the TSQ fluorescence exhibited a similar trend of increased intracellular zinc levels, but it was not significant due to higher variability in the assay. Nevertheless, the results obtained in our RNAi study support our observation that abnormal intracellular zinc accumulation is correlated with an apparent reduction of TMEM163 expression and simultaneous loss of TRPML1 function in MLIV patient fibroblast cells examined.
To further elucidate the biological mechanism behind the interaction between TRPML1 and TMEM163, we performed cell surface biotinylation of heterologously expressed TMEM163 with or without co-expression of TRPML1 in HEK-293 cells. We found that when TRPML1 is co-expressed with TMEM163, there was a significant reduction (50%) of TMEM163 proteins that are present in the plasma membrane when compared to single TMEM163 expression control (Figures 5C-5D). This result parallels the observed effect of TRPML1(NC) mutant on influencing the subcellular localization of TMEM163 when co-expressed in HEK-293 cells (Figure 3A).
Finally, we sought to identify the region where TMEM163 could potentially bind TRPML1 with the prospect of disrupting their interaction. TMEM163 is predicted to have cytoplasmic N- and C-termini with six transmembrane domains (Supplemental Figure S5). Since the C-terminus region of TMEM163 was very short, we theorized that the binding region would be at the N-terminus of TMEM163. Using site-directed mutagenesis, we deleted the first 126 base pairs (bp) and 213 bp of TMEM163's N-terminus region resulting in TMEM163-Δ42 amino acid (AA) and TMEM163-Δ71 AA deletion mutants. Note that as a result of the deletion, the TMEM163-Δ71 AA mutant, but not the TMEM163-Δ42 mutant, is missing a predicted di-Leucine LTS motif (D/E)XXXLL (Supplemental Figure S5). Confocal microscopy analysis of both TMEM163 deletion mutants heterologously co-expressed with WT TRPML1 or TRPML1(NC) mutant in HEK-293 cells did not display overt differences in their subcellular distribution (Supplemental Figure S6). To determine if the TMEM163 deletion mutants could still bind TRPML1, we performed a co-IP of TRPML1 with WT TMEM163, TMEM163-Δ42 deletion mutant, or TMEM163-Δ71 deletion mutant. We found that removing the first 42 AA of TMEM163 reduced its interaction with TRPML1, while the loss of 71 AA in TMEM163 virtually eliminated its interaction with TRPML1 (Figure 5E). Thus, the binding region for TMEM163 is located at its N-terminus, which is between AA position 42 and 71.
Discussion
This study identified TMEM163 protein as a novel binding partner of the TRPML1 ion channel. We showed for the first time that the interaction of TRPML1 ion channel with TMEM163 protein might have a crucially important role in maintaining zinc homeostasis in a cell-type specific manner.
The widely distributed expression pattern of TMEM163 mRNA coincides well with TRPML1, making it more likely that their interaction is biologically relevant. In addition, its relatively high expression levels in the brain and its interaction with TRPML1 suggest that it could be a key player in MLIV neuropathology, since neurons are mostly affected in MLIV. Indeed, co-IP experiments using heterologous expression system, and native proteins from human gastric cells and postmortem human brain tissues verified the physical association between the two proteins.
Confocal microcopy experiments also established that TMEM163 is distributed on the PM and partially co-localizes with LAMP1-positive late endosomes or lysosomes and with TRPML1. This finding is further supported by the conspicuous di-Leucine LTS motif, (D/E)XXXLL, present in the N-terminus region of both TRPML1 and TMEM163 proteins. For TRPML1, the N-terminus LTS motif has been reported to be essential for its direct targeting to the lysosomes, while another LTS motif located at the C-terminus is responsible for its internalization via the adaptor protein-2 pathway (39). It is interesting to note that if the loss of the LTS motif in TMEM163-Δ71 mutant had an effect, then it was very subtle because it appeared to be similarly distributed in cells overexpressing TMEM163-Δ42 and WT TMEM163 proteins (Supplemental Figure S6). The interaction between TRPML1 and TMEM163-Δ71 mutant, however, is abolished when compared to TMEM163-Δ42 or WT TMEM163 (Figure 5E). Taken together, these data imply that the loss of interaction between TMEM163-Δ71 and TRPML1 is not caused by a mis-localization of the TMEM163-Δ71 deletion mutant, but rather due to its failure to physically bind the TRPML1 protein.
We previously reported that chelatable Zn2+ levels are elevated in brain tissues of TRPML1–/– KO mice or TRPML1–/– KO MLIV fibroblasts cells (12), however, our fluorometric analysis measures total intracellular Zn2+ levels and did not distinguish between cytoplasmic or lysosomal Zn2+ store. In the current study, our confocal microscopy data on MLIV and control fibroblast cells revealed that the distinct Zn2+ accumulation is mostly detected within the lysosomes of MLIV fibroblasts (Figure 4A). The magnitude of FluoZin-3 staining was more pronounced when these MLIV fibroblasts were exposed to exogenous zinc, which suggests that the loss of TRPML1 affects the ability of cells to extrude zinc from the lysosomal lumen into the cytosol or perhaps outside the cell due to reports that lysosomal exocytosis is impaired in MLIV (40, 41). On the other hand, WT control fibroblasts incubated with exogenous zinc did not show a considerable amount of FluoZin-3 staining, suggesting that these cells have a mechanism to buffer or efflux excess luminal zinc. These results imply that lysosomal zinc accumulation in MLIV fibroblasts (or quite possibly in actual MLIV neurons) might be due to the failure of TRPML1 to extrude lysosomal Zn2+ for subsequent buffering by cytoplasmic MT proteins. Indeed, Kukic et al. (2013) (13) reported that the clearance of Zn2+ from lysosomes was severely affected when TRPML1 has been knocked down in HeLa cells. The authors noted that the luminal Zn2+ secretion (into the cytosol) was merely delayed, suggesting that a redundant lysosomal leak or active transport system yet to be identified mediates Zn2+ transport. On the other hand, the authors found that knocking down ZnT4 in TRPML1-deficient HeLa cells prevented lysosomal Zn2+ accumulation suggesting that this transporter is necessary for lysosomal Zn2+ uptake. One caveat in all these findings is the cell type- or tissue-specificity of ZnTx (where x denotes a family number), and Zrt-, Irt-like Protein (ZIP)x family of Zn2+ transporters (42, 43). A case in point, Kukic et al. (2013) failed to see an effect on lysosomal Zn2+ flux when they knocked down ZnT2 possibly due to its tissue-specific expression. Indeed, many ZIP and ZnT proteins have tissue-specific expression or cell-specific distribution patterns. For example, ZnT3 is exclusively found in synaptic vesicles of neurons, ZIP4 is present in the plasma membrane of enterocytes, and ZnT8 functions specifically in secretory granules of pancreatic β cells (42, 44). Taken together, the current observations suggest that TMEM163 and TRPML1, as well as other zinc transport proteins may play a crucial role in Zn2+ homeostasis in a tissue-specific manner.
The reduction of TMEM163 expression in MLIV fibroblasts correlates with the lysosomal zinc accumulation in these cells. Indeed, the FluoZin-3 assay showed that RNAi of TMEM163 alone, and co-knockdown of TMEM163 and TRPML1 resulted in significant elevation of intracellular Zn2+ levels. While the TSQ assay confirmed the statistical significance of increased intracellular zinc levels, the co-knockdown of both proteins was not significant in this assay due to higher variability of the experimental trials. Despite this result, the FluoZin-3 data are more reliable because this dye readily binds labile (free) or chelatable zinc, whereas TSQ tends to bind zinc that is also bound to proteins such as MT (45). Indeed, the magnitude of the relative fluorescence units (RFUs) obtained in the FluoZin-3 assay is considerably smaller than that of the TSQ assay, suggesting that other zinc-bound proteins may have contributed to the RFUs obtained from the TSQ assay. Nevertheless, the numerical trend is very similar between the two assays.
It is intriguing that the zinc levels in TRPML1 KD did not increase more than the control, despite our previous report that intracellular Zn2+ levels increased upon TRPML1 KD in HEK-293 cells using the TSQ assay (12). We can only speculate that lot-to-lot variation and differences in the origin of fetal bovine serum (FBS) could be the mitigating factor that influenced our previous work, since Zn2+ concentration in FBS has been reported to be at the micromolar range (46). Moreover, the discrepancy between our previous TRPML1 KD data and the current TRPML1 KD observation suggests that TSQ may also be a confounding factor as it detects both free and protein-bound Zn2+ (45). FluoZin-3 is thus a better fluorescent stain to reliably determine changes in intracellular labile Zn2+ concentration. It is worth noting that Kukic et al. (2013) have reported that TRPML1 KD in HeLa cells do exhibit enlarged lysosomes that accumulate Zn2+ after 48 hours of exogenous zinc exposure (13), which supported our previous report overall.
The protein responsible for the membrane trafficking of TMEM163 from the PM to the lysosomes is not known. Interestingly, our observation that the subcellular distribution of TMEM163 parallels that of the TRPML1(NC) PM-variant suggests that WT TRPML1 could influence the localization of TMEM163. Remarkably, our cell surface biotinylation data indicate that this is the case, since a 50% decrease in TMEM163's PM localization was seen when it was co-expressed with TRPML1 (Figure 5C). This result is in agreement with our previous finding that TRPML1 affects the trafficking of another interaction partner, TRPML3 (30). Furthermore, Venkatachalam et al. (2006) have shown that TRPML1 also affects the lysosomal localization of TRPML3 when both proteins are heterologously co-expressed (47). Whether these observations are an artifact of overexpression, or an actual biological function of TRPML1 remains to be elucidated.
In conclusion, the interaction of TMEM163 with TRPML1 ion channel appears to impact Zn2+ metabolism in cells. This study provides further evidence in support of our theory that abnormal cellular Zn2+ levels may be a contributing factor to the progressive neuronal and retinal degeneration in MLIV. Zinc is an important trace element, but at high levels, it is cytotoxic (24, 26, 48-50). Although the use of zinc-specific chelating agents may have the potential to abrogate the negative effects of Zn2+ imbalance in certain vulnerable cells, further research is needed in order to establish if metal chelation is indeed a promising therapy for MLIV due to metal specificity issues of many chelating agents.
Materials and Methods
Split ubiquitin membrane-based yeast two-hybrid (mb-YTH) assay
The split-ubiquitin mb-YTH technique was done using the dual membrane kit offered by DualSystems Biotech (Zurich, Switzerland). The mb-YTH assay is a genetic method that allows two-hybrid analysis of full-length integral membrane proteins as opposed to traditional YTH, because membrane proteins are not targeted to the nucleus. The mb-YTH data from this study arose from a group collaboration to confirm candidate interaction proteins recently published by Spooner et al. (51), in which Vergarajauregui et al. (33) confirmed one of the candidates as a Trpml1 interaction partner. The bait plasmids were a kind gift of Dr. Hanna (Johnny) Fares (Univ. of Arizona). The prey vectors (pPR3-N) came from a mouse kidney library that was also purchased from DualSystems Biotech. The expression vectors of mouse pBT3-Trpml1-Cub-LexA-VP16 and NubG or NubI-fusions were transformed into the yeast strain NMY51 [MATa his3delta200 trp1-901 leu2-3,112 ade2 LYS2::(lexAop)4-HIS3 ura3::(lexAop)8-lacZ (lexAop)8-ADE2 GAL4)]. The transformants were selected on –leu –trp (–LT) plates. We used equal numbers of cells from each transformation and spotted samples on –leu –trp, and high stringency –leu –trp –ade –his (–LTAH) plus 3-Amino-1,2,4-triazole (5 mM; 3-AT) agar plates. The plates were placed at 30°C and colony growth was scored on the fourth day. Positive colonies were picked and grown in shaking culture. The plasmid DNA from each positive clone was extracted, and sent for sequencing (Sequetech, Mountain View, CA). We used BLAST (NCBI) to identify the identity of each interactor. (51)
Recombinant DNA and RNA interference (RNAi) constructs
We cloned mouse Tmem163 from a brain cDNA library into pDsRed (Clontech, Mountain View, CA) or pmCherry-N1 vector (red fluorescent protein tag, a kind gift from Dr. Roger Tsien, UC San Diego). The mouse Trpml1 in pEGFP-C3 (green fluorescent protein tag) vector was a generous gift from Dr. Hanna (Johnny) Fares (Univ. of Arizona). Mouse Trpml1 was subcloned into a Hemagglutinin (HA) peptide tag, while Tmem163 was cloned into Myc tag and red fluorescent protein (RFP) tag vectors. The human pCMV6-TMEM163-GFP and pCMV6-TRPML1-DDK (flag peptide tag) constructs were purchased from OriGene Technologies (Rockville, MD). We subcloned the human TMEM163 cDNA into pCMV6-AC-DDK (Flag peptide tag), pCMV6-AC-HA, or pmCherry-N1 vector, while the human TRPML1 cDNA was subcloned into pmCherry-N1 or pCDNA-YFP (yellow fluorescent protein tag) vector. We created the human TRPML1(NC)-YFP mutant by deleting the lysosomal targeting sequence (LTS) containing the di-Leucine motif at both the 5′ and 3′ ends of the ORF (30). This mutant is mostly localized in the plasma membrane. We created two N-terminus deletion mutants of human TMEM163 that were missing 42 (Δ42) and 71 (Δ71) amino acids using the In-Fusion® HD mutagenesis kit (Clontech, Mountain View, CA). For the sequence map of TMEM163, please refer to Supplemental Figure S5. We verified all expression constructs by DNA sequence analysis prior to use (Retrogen, San Diego, CA).
We purchased and validated the effectiveness of a short hairpin RNA (shRNA, 29-mer; OriGene Technologies) vector targeting human TMEM163 (Supplemental Figure S7). The most effective TMEM163 shRNA vector was subsequently used in this study. The shRNA vector targeting human TRPML1 has been previously reported by our laboratory (5, 12). Negative shRNA and scrambled controls were included in all experiments.
Standard polymerase chain reaction (PCR) and real-time quantitative PCR (qPCR)
Both standard PCR and real-time qPCR reactions were done as previously described (52) with minor modifications appropriate for this study. For these experiments, the human cDNA tissue samples were commercially purchased (Clontech, Mountain View, CA). The multiple tissue cDNA (MTC) human panels I and II contain the following samples: brain, thymus, heart, lung, liver, spleen, pancreas, small intestine, colon, kidney, skeletal muscle, prostate, ovary, testis, placenta, and peripheral blood leukocyte (PBL). The manufacturer has normalized the MTC panels against four housekeeping genes (α-tubulin, β-actin, GAPDH, and phospholipase A2) and with each other for accuracy. Supplemental Table S1 outlines the standard and quantitative PCR primer sets used to amplify human TMEM163, 18S ribosomal RNA, and GAPDH.
The human TMEM163 open-reading frame (ORF) is 870 bp and contains a high G/C content at its 5′ end. Addition of dimethyl sulfoxide to the PCR reaction generated highly specific amplicons of TMEM163. To be absolutely certain, we sent purified PCR products from randomly selected tissues for DNA sequencing (Sequetech, Mountain View, CA), and subsequently confirmed that the PCR amplicons were in fact TMEM163. For our controls, human GAPDH was used as loading control to compare relative band intensities resulting from the standard PCR experiments. Water was used as negative control, while the pCMV6-TMEM163-GFP clone was used as positive control.
We extracted total RNA using Tri-Zol (Life Technologies) and used the Revert-Aid cDNA synthesis kit (Thermo Scientific, Waltham, MA) to obtain cDNAs. The cDNAs were stored at -20 °C until it was ready for use in the qPCR studies. For the human fibroblast study quantifying the endogenous TMEM163 transcripts, we processed MLIV and WT control cells as above, and stored the cDNA at -20 °C for subsequent qPCR experiments.
For the real-time qPCR studies, we followed the Minimum Information for Publication of Quantitative Real-Time PCR Experiments (MIQE) guidelines (53) using a CFX96 thermocycler (Bio-Rad, Hercules, CA). We used the Livak method (2−ΔΔCq) to analyze all qPCR data in which the quantitative cycle (Cq) values obtained from human 18S rRNA was used as the reference gene (normalizer) due to its robust expression across many tissues and cell lines (54) and represented as normalized relative expression levels that were calibrated to PBL (value = 1) for the MTC panel, and non-MLIV control fibroblast (value = 1) for the fibroblast experiments. All qPCR reactions were done in triplicate using the SYBR SensiMix No Rox reagent (Bioline USA, Taunton, MA) with the following parameters: 10 min at 95 °C, and 40 cycles for 15 sec at 95 °C, 30 sec at 58 °C and 30 sec at 72 °C. Melt curve analysis was done at the end of each run to track the specificity and reliability of the PCR reaction. All three independent trials in the study included a standard curve with a correlation coefficient (R2) value of 0.99 ± 0.02 (mean ± SEM). The qPCR efficiencies for each primer set were (mean ± SEM): TMEM163 = 99.8 ± 1.47 % and 18S rRNA = 92.1 ± 0.06 %.
Co-immunoprecipitation (co-IP) and Western blot
We performed co-IP experiments using either the Dynabeads (Life Technologies) for mouse proteins, or Pierce Co-IP kit (Thermo Scientific) and immobilized agarose beads (Novus Biologicals, Littleton, CO) for human proteins. All treated and control samples were processed as previously described (52) with minor modifications appropriate for this study. Specifically, HEK-293 cells were transfected with TMEM163-HA, TRPML1-DDK, or both constructs using Turbofect (Thermo Scientific), and cultured for 48 hours. The negative controls used in the study included no-antibody incubation, untransfected cells, and single cDNA plasmid transfection. We also performed a reverse co-IP to validate our findings, and run a WB to show the specificity of the antibodies used in the experiments (Supplemental Figure S3). Additional co-IP control experiments were done with TMEM163-HA and another lysosome-associated protein, TMEM176A-DDK to show the specificity of interaction between TRPML1 and TMEM163. We used human TRPML2-DDK and TMEM176A-HA as a positive control, since we have initially identified these proteins as interactors through a genetic screen using mb-YTH assay (Supplemental Figure S2). To determine the binding region within TMEM163, we deleted the N-terminus as described earlier and performed co-IP of the deletion mutants and WT TRPML1.
To analyze endogenous TRPML1-TMEM163 interaction, we used postmortem human cerebral cortex tissues obtained from the Alzheimer's Disease Research Center (ADRC) of Southern California Brain Bank. The brain tissues were pulverized and homogenized in buffer containing 25 mM Tris-HCl pH 7.4, 150 mM NaCl, 1 mM EDTA, 1% Nonidet P-40 and 5% glycerol, 1 mM phenylmethylsulfonyl fluoride (PMSF) and protease inhibitor cocktail (PIC) (Thermo Scientific). We also used cell lysates from HGT-1 human gastric cell line (a kind gift from Dr. Ehud Goldin, NIH/NHGRI) to provide additional evidence for endogenous protein-protein interaction. All cell lysates or tissue homogenates were incubated with the specific antibody for co-IP, immunoblotted, and scanned using a LI-COR Biosciences (Lincoln, NE) Odyssey SA™ infrared (IR) scanner.
The IP and Western blot antibodies were obtained from: Sigma (St. Louis, MO), anti-HA (1:1000) monoclonal antibody (mAb) and anti-TRPML1 (1:500) mAb; OriGene Technologies, anti-DDK (1:1000) mAb; and Novus Biologicals, anti-HA (1:1000) polyclonal antibody (pAb), anti-TMEM163 (1:500) pAb, anti-Trpml1 (1:500) pAb, and β-actin (1:500) mAb or pAb. Supplemental Figure S3 confirmed the specificity of anti-TRPML1 and anti-TMEM163 antibodies against endogenous and overexpressed TRPML1 and TMEM163 proteins, respectively. Secondary IR-Dye™ 800CW-conjugated antibodies (1:15000) were purchased from LI-COR Biosciences. Integrated density values (IDV) of protein gel band intensities were analyzed and calculated using NIH ImageJ software. The IDV were normalized against beta-actin. Student's t-test (paired, two-tailed) was used to determine statistical significance of the data (p-value was set at p < 0.05).
Human cell lines and primary MLIV and control fibroblast cell cultures
All cells were cultured and maintained in a standard 37° C incubator supplied with 5% CO2. Human embryonic kidney (HEK)-293 cells were maintained in Dulbecco's Modified Eagle's Media (DMEM; Mediatech, Manassas, VA) supplemented with 10% fetal bovine serum (FBS) and 1% pen-strep antibiotics. This cell line was used for heterologous overexpression of epitope-tagged constructs for co-IP experiments, fluorometric assay and confocal microscopy.
Human fibroblast cells from MLIV patients (GM2527, GM2408) and normal control (GM3440) were obtained from Coriell Cell Repositories (Camden, NJ). The cells were maintained in DMEM supplemented with 15% FBS plus 1% pen-strep antibiotics. These primary cells were used for TMEM163 mRNA and protein expression analyses, and for FluoZin-3 confocal microscopy. The qPCR data analyzing mRNA levels from these cells were calculated and analyzed for statistical significance using Student's t-test (paired, two-tailed; significance level was set at p < 0.05).
Human SH-SY5Y neuroblastoma cells were obtained from American Type Culture Collection (Manassas, VA) and maintained in 1:1 Minimum Essential Medium/Ham's F12K supplemented with 10% FBS plus 1% pen-strep antibiotics. To obtain a mature phenotype, the SH-SY5Y cells were differentiated with retinoic acid (5 μM) and cholesterol (5 μg/mL) for 1-2 weeks prior to use (55). The mature neuroblastoma cells were used for confocal microscopy.
Confocal microscopy analysis
For confocal microscopy, human fibroblasts, HEK-293 cells, or differentiated SH-SY5Y neuroblastoma cells were transfected with fluorescent-tagged constructs of TMEM163 and TRPML1, fixed with 4% paraformaldehyde, mounted, treated with ProLong Gold anti-fade reagent, and then analyzed for confocal microscopy (Leica TCS SP2 laser-scanning system). For the analysis of intracellular zinc using FluoZin-3, cultured MLIV patient and control fibroblast cells were either exposed to ZnCl2 (100 μM) for 3 h or not exposed. Cells incubated with exogenous zinc were washed twice with 1X phosphate buffered saline (PBS). The cells were then incubated with 1 μM of FluoZin-3 and Lysotracker™ Red (Life Technologies, Carlsbad, CA) for 30-60 min, washed twice with PBS, fixed with 4% paraformaldehyde, and then analyzed for imaging.
Mass Spectrometry (MS) and Bioinformatics analyses
To further validate our co-IP results, we run the samples on a polyacrylamide gel, washed the gel with PBS, and stained it with SimplyBlue™ Safe Stain (Life Technologies) according to the manufacturer's recommendation. We then excised gel bands from the eluted co-IP samples as previously described (52). The samples were sent to the Stanford University Mass Spectrometry Core facility (Stanford, CA) for liquid chromatography (LC)-MS/MS analysis. The data were analyzed using the Scaffold 3 software (Proteome Software, Portland, OR).
Calcium (Ca2+)-imaging assay and electrophysiology using agonist-induced TRPML1 channel activation
We used the human TRPML1(NC)-YFP mutant because this mutant is mostly localized in the plasma membrane, and is thus ideal for calcium imaging technique. Measurements of intracellular calcium concentration [Ca2+]i with the fluorescent indicator Fura-2-AM (Life Technologies) were performed as described (4) using a monochromator-based imaging system (Polychrome V monochromator, TILL Photonics). HEK-293 cells, plated onto glass coverslips, were loaded with 4 μM Fura-2-AM in a standard bath solution containing 138 mM NaCl, 6 mM KCl, 2 mM MgCl2, 2 mM CaCl2, 10 mM HEPES, and 5.5 mM D-glucose (adjusted to pH 7.4 with NaOH). The cells were then activated with 10 μM of the TRPML1 activator, SF-22 (5-chloro-N-(2-piperidin-1-ylphenyl)thiophene-2-sulfonamide).
To test the specificity of SF-22, whole-lysosome planar patch-clamp was done as described previously (56). We used 1 μM vacuolin-1 overnight to enlarge the lysosomes of HEK-293 cells heterologously expressing TRPML1-YFP and negative control, as well as MLIV patient (TRPML1−/− knockout) and wild-type (WT) control fibroblast cells (11, 56, 57). No differences in TRPML1 channel property have been reported using vacuolin-1 enlarged lysosomes (> 5 μm) (11). The planar patch-clamp technology combined with a pressure control system and microstructured glass chips containing an aperture of ∼1 μm diameter (resistances of 10-15 MΩ) (Port-a-Patch, Nanion Technologies) were applied as described (56). Currents were recorded using an EPC-10 patch-clamp amplifier and PatchMaster acquisition software (HEKA). Data were digitized at 40 kHz and filtered at 2.8 kHz. Cytoplasmic solution contained 60 mM KF, 70 mM K-MSA (methanesulfonate), 0.2 mM Ca-MSA, 10 mM HEPES (pH adjusted with KOH to 7.2). Luminal solution contained 60 mM Ca-MSA, 70 mM K-MSA, 10 mM HEPES (pH adjusted with MSA to 4.6). Liquid junction potential was corrected. The membrane potential was held at -60 mV, and 500 ms voltage ramps from -200 to +100 mV were applied every 5 sec due to the presence of high luminal calcium to ensure giga seals when performing whole-lysosomal patch-clamp on the port-a-patch system (56), the inward currents are less rectifying and reverse at more positive potentials in TRPML1-expressing HEK-293 cell system (14). All recordings were obtained at room temperature and were analyzed using PatchMaster (HEKA) and Origin 6.1 (OriginLab) software.
Spectrofluorometric analysis of intracellular zinc
HEK-293 cells were plated on a 96-well culture plate treated with poly-D-lysine. The cells were transfected with either an RNAi knockdown (KD) or an overexpression (OE) plasmid, namely: KD TMEM163 or KD TRPML1, and OE TMEM163 or OE TRPML1. Double transfections were done as either combined KD (co-KD TMEM163-TRPML1) or combined OE (co-OE TMEM163-TRPML1). Twenty-four hours post-transfection, we incubated the cells with low levels of ZnCl2 (100 nM) to prevent cytotoxicity and saturation of fluorometric readings done the following day (n = 6 independent trials). The cells were analyzed for intracellular Zn2+ fluorescence using the membrane permeable zinc-specific fluorescent dyes, FluoZin-3 (Kd ∼15 nM; ex = 494 nm, em = 516 nm) and TSQ (N-(6-methoxy-8-quinolyl)-p-toluene sulfonamide; Kd ∼10 nM; excitation = 380 nm, emission = 495 nm; AnaSpec, Fremont, CA). A membrane impermeable FluoZin-3 was used as negative control. TSQ and FluoZin-3 only fluoresces when bound to Zn2+ (38), thereby providing an excellent method to assess changes in intracellular Zn2+ levels. One caveat is that TSQ forms a ternary complex with zinc-bound proteins (45), while FluoZin-3 binds more specifically to labile (free) or chelatable zinc. To obtain relative fluorescence units (RFUs) for analysis, we subtracted background fluorescence (blank) from each treatment.
Cell surface biotinylation
HEK-293 cells were transfected with TMEM163-HA, TRPML1-DDK, or combined TMEM163-HA and TRPML1-DDK. Twenty four hours post-transfection, the cells were washed two times with 10 ml of ice-cold PBS-CM (1X PBS, 0.5 mM CaCl2, 1 mM MgCl2, pH 8.0) and incubated with 1 ml of freshly prepared Sulfo-NHS-LC-LC-Biotin solution (Thermo Scientific; 0.5 mg/ml in PBS-CM) for 30 min at 4°C. The cells were washed twice with 10 ml of PBS-CM containing 0.1% BSA to terminate and quench any unbound Sulfo-NHS-LC-LC-Biotin. The cells were lysed for 1 h at 4°C with 1 ml of lysis buffer (PIC, 150 mM NaCl, 5 mM EDTA, 1% Nonidet P-40, 50 mM Tris, pH 7.5). The lysates were centrifuged at 14,000 rpm for 15 min at 4°C. An aliquot (1-5%) was taken from each sample to normalize total protein (input) for each treatment. The neutravidin beads (Thermo Scientific) were equilibrated in lysis buffer, added to normalized protein samples (1000 mg/ml), and incubated overnight at 4°C. The samples were washed five times with lysis buffer, incubated in 50 μl Laemmli buffer for 30 min at 37 °C, and eluted by low speed centrifugation. The samples were immunoblotted with primary anti-HA mAb or anti-DDK mAb, and secondary mouse IR-Dye 800CW. The blots were then scanned using the Odyssey SA™ infrared imaging system (LI-COR Biosciences). The IDV of the relative band intensities for TMEM163 and TMEM163 plus TRPML1 were analyzed and calculated using the NIH ImageJ software. The IDV of monomeric TMEM163 upper band was normalized with the monomeric lower band (n = 3 independent trials). Student's t-test (paired, two-tailed) was used to determine statistical significance of the data (p-value was set at p < 0.05).
Supplementary Material
Figure S1. Mouse Tmem163 and Trpml1 interact. A) Using the same high stringency selection (–LTAH with 5 mM 3-AT), the mb-YTH assay showed that Tmem163 does not interact with Trpml3. A transactivation or non-specific interaction between Trpml3-CubG-LexA-VP16 and Fur4-NubG, as well as Trpml3-CubG-LexA-VP16 and Ost1-NubG was observed. B) Representative Western blot (WB) of co-immunoprecipitated Trpml1-HA and Tmem163-Myc elutes Tmem163 (31.2 kDa, arrowhead). The plasmids containing the cDNA of each protein were transfected and heterologously co-expressed in HEK-293 cells. The lysates were processed for co-immunoprecipitation (co-IP) using Dynabeads™ (Life Technologies) according to the manufacturer's protocol. I, input/flow-through; W, wash; E, elution. C) Mass spectrometry (MS) of eluted band identified Tmem163 upon co-IP with Trpml1. The eluted samples were resolved on 4-20% SDS-PAGE gel, washed with sterile distilled-deionized water, and stained with Coomassie blue. The bands were excised, frozen, and sent to the Stanford University Mass Spectrometry Core facility. The yellow highlighted amino acid (AA) sequences indicate four unique peptide hits obtained from seven out of nine unique MS/MS spectra. The green highlighted AA indicates oxidation status. The data were analyzed using the Scaffold 3 software. D) Representative confocal images of heterologously co-expressed Tmem163-RFP (red) and Trpml1-GFP (green) heterologously co-expressed in SH-SY5Y neuroblastoma cells. The subcellular distribution of Tmem163 and Trpml1 showed partial co-localization within vesicular compartments appearing as yellow structures (arrowheads). mAb, monoclonal antibody; pAb, polyclonal antibody; Scale bar: 20 μm.
Figure S2. Additional control experiments for the co-immunoprecipitation study. A) Heterologous expression of single TMEM163-HA (31.5 kDa, top panel) construct, or single TRPML1-DDK (65 kDa, bottom panel) construct in HEK-293 cells. IP of TMEM163-HA single expression lysates using anti-DDK monoclonal antibody (mAb) did not show an elution profile upon Western blot (WB) analysis. Similarly, IP of TRPML1 single expression lysates using anti-HA polyclonal antibody (pAb) showed no elution profile. These results indicate that the overexpressed proteins did not bind non-specifically to the agarose beads. B) The top panel shows a representative WB image of the co-IP of heterologously expressed TRPML2-DDK and TMEM176A. The bottom panel shows the presence of co-expressed TRPML2-DDK protein within the sample using anti-DDK mAb. The result showed that TRPML2-DDK (65.4 kDa) and TMEM176A (25.9 kDa) proteins physically interact. Both proteins were initially identified as interactors in a genetic screen using mb-YTH assay. TMEM176A is a lysosome-associated protein previously implicated in cancer pathology (62). C) The top panel shows a representative WB image of heterologously co-expressed TMEM163-HA protein upon co-IP with TMEM176A-DDK. The blot showed that TMEM163-HA and TMEM176A-DDK do not interact. The bottom panel shows the presence of co-expressed TMEM163-HA within the same sample using anti-HA mAb. The data indicated that the lack of interaction between the two proteins was not due to the absence of TMEM163 expression. I, input/flow-through; W, wash; E, elution. High MW IgG (55 kDa); Low MW IgG (23 kDa).
Figure S3. Specificity of anti-TRPML1 monoclonal antibody and anti-TMEM163 polyclonal antibody. A) Representative Western blot (WB) image showing that the anti-TRPML1 mouse monoclonal antibody (mAb) used in this study detected endogenous TRPML1 protein from HGT-1 cells (left panel, arrowhead) and upon heterologous expression in human SH-SY5Y neuroblastoma cells (right panel, arrowheads). 1-mer, monomer; 2-mer, dimer; N-mer, multimer. B) Representative WB image showing that the anti-TMEM163 rabbit polyclonal antibody (pAb) used in this study detected the endogenous TMEM163 present in HGT-1 cells (left panel, arrowheads) and upon heterologous expression in human SH-SY5Y neuroblastoma cells (right panel, arrowheads). In HGT-1 cell lysates, the anti-TMEM163 detected several bands because it is a pAb; however, IP of cell lysates with the anti-TMEM163 pAb enriched the endogenous protein and increased the specificity of the detected TMEM163 protein bands, which appeared as monomeric and dimeric species.
Figure S4. Whole-lysosome planar patch clamp using the SF-22 compound. A) Representative current-voltage (I-V) relationship graph showing TRPML1 inwardly rectifying currents from luminal to cytosol following electrophysiological recording of lysosomes in HEK-293 cells heterologously expressing TRPML1-YFP in the presence of SF-22 (10 μM, applied on the cytosolic side). The basal current was obtained from lysosomes of untransfected HEK-293 cells. B) Representative I-V relationship graph showing inwardly rectifying currents from luminal to cytosol following electrophysiological recording of lysosomes in wild type (WT) fibroblast cells in the presence of SF-22 (10 μM, applied on the cytosolic side). Note that the trace mimics that of lysosomes expressing TRPML1-YFP shown in A. The lysosomes taken from MLIV patient fibroblast cells did not produce a current.
Figure S5. Schematic diagram illustrating a map of human TMEM163 cDNA and its corresponding protein sequence. The solid black-arrow line indicates the position of deleted amino acids (AA) for TMEM163-Δ42 and TMEM163-Δ71 mutants. TMEM163 has a predicted six TM domains with long N-terminus region and a short C-terminus region (aqua-shaded box). Both N- and C-termini are predicted to be in the cytoplasm. The map was generated using DNASTAR SeqBuilder 9.1 software (Lasergene, Madison, WI). TM, transmembrane domain.
Figure S6. Confocal micrographs of heterologously expressed wild type or mutant TRPML1 and TMEM163. A) Wild type TRPML1 co-expressed with wild type (WT) TMEM163, TMEM163-Δ42 amino acid (AA) deletion mutant and TMEM163-Δ71 AA deletion mutant. The subcellular localization of WT TMEM163 appeared to be very similar to the deletion mutants and their co-localization with TRPML1 was virtually the same. This result suggests that the deletion did not alter the distribution of the mutant proteins. B) LTS mutant TRPML1(NC) co-expressed with wild type TMEM163, TMEM163-Δ42 AA deletion mutant, and TMEM163-Δ71 AA deletion mutant. Similarly, no apparent changes in the subcellular distribution were observed in WT TMEM163 and deletion mutants, or their co-localization with TRPML1(NC) mutant protein. Scale Bar: 20 μm.
Figure S7. Analysis of effective shRNA knockdown of heterologously overexpressed human TMEM163. A) Standard RT-PCR showed marked TMEM163 transcript reduction 48 h following RNAi treatment. The SH-SY5Y neuroblastoma cells were co-transfected with pCMV6-AC-TMEM163-GFP construct and the following pRFP-C-RS-shRNA plasmids targeting TMEM163 (357-, 358-, 359-, and 360-shRNA), scrambled sequence (scr-shRNA) control and negative shRNAs (vec-shRNA) control. The standard PCR reaction was done for 23 cycles to prevent a saturated signal, and allow us to detect the relative starting quantities of TMEM163 transcripts. Human GAPDH was used as loading control. The PCR primers used in this experiment are shown on Table S1. B) Western blot analysis exhibited a similar effect on overexpressed TMEM163 protein levels 48 h after RNAi treatment of cells with the same shRNA plasmids. We used a pCMV6-AC-TMEM163-HA expression plasmid for this experiment. The blot was detected by anti-HA polyclonal antibody using anti-rabbit IRDye-800CW secondary antibody as described in the Materials and Methods section.
Synopsis.
Elevated cellular zinc levels are correlated with MLIV disease. We discovered that TRPML1 interacts with TMEM163. RNA interference of TMEM163, or TMEM163 and TRPML1 in cultured HEK-293 cells significantly increased intracellular zinc levels. This result paralleled a reduction of TMEM163 and zinc accumulation in MLIV patient fibroblast cells. Overall, these data suggest that TRPML1 and TMEM163 play a role in cellular zinc homeostasis, in which disruption of their function potentially contributes to MLIV pathology.
Acknowledgments
We are very grateful to Dr. Hanna (Johnny) Fares (Univ. of Arizona) for sharing reagents and unpublished data, as well as Dr. Ehud Goldin (NIH/NHGRI) for providing the HGT-1 human gastric cell line. We thank Steve Karl, Frank Ospino, Mohammad Samie, Katrina Taylor, William Podevin, and Ania Habibi for their technical support. We also thank Dr. Sean Murray for reading and critiquing the manuscript. This work was funded by grants to MPC from NIH R15-NS070774, NIH T34-GM08612, NSF MCB-0920127, and CSUF Intramural Grants program. LB, JS, and MPC acknowledge support from the MARC U-STAR program (NIH T34-GM08612), Doris Howell-CSUPERB undergraduate research scholarship, the Louis Stokes Alliance for Minority Participation (NSF HRD-0802628) scholarship, and grants from the CSUF's Associated Students Inc., and FDC Faculty-Student Collaborative Study. CG was funded by the Deutsche Forschungsgemeinschaft grant GR-4315/1-1. We acknowledge the Alzheimer's Disease Research Center of Southern California Brain Bank (Federal grant AG005142) for providing post-mortem brain tissues to MPC.
Footnotes
The authors declare no conflict of interest.
References
- 1.Amir N, Zlotogora J, Bach G. Mucolipidosis type IV: clinical spectrum and natural history. Pediatrics. 1987;79(6):953–959. [PubMed] [Google Scholar]
- 2.Altarescu G, Sun M, Moore DF, Smith JA, Wiggs EA, Solomon BI, Patronas NJ, Frei KP, Gupta S, Kaneski CR, Quarrell OW, Slaugenhaupt SA, Goldin E, Schiffmann R. The neurogenetics of mucolipidosis type IV. Neurology. 2002;59(3):306–313. doi: 10.1212/wnl.59.3.306. [DOI] [PubMed] [Google Scholar]
- 3.Grimm C, Hassan S, Wahl-Schott C, Biel M. Role of TRPML and two-pore channels in endolysosomal cation homeostasis. The Journal of pharmacology and experimental therapeutics. 2012;342(2):236–244. doi: 10.1124/jpet.112.192880. [DOI] [PubMed] [Google Scholar]
- 4.Grimm C, Cuajungco MP, van Aken AF, Schnee M, Jors S, Kros CJ, Ricci AJ, Heller S. A helix-breaking mutation in TRPML3 leads to constitutive activity underlying deafness in the varitint-waddler mouse. Proc Natl Acad Sci U S A. 2007;104(49):19583–19588. doi: 10.1073/pnas.0709846104. [DOI] [PMC free article] [PubMed] [Google Scholar]
- 5.Samie MA, Grimm C, Evans JA, Curcio-Morelli C, Heller S, Slaugenhaupt SA, Cuajungco MP. The tissue-specific expression of TRPML2 (MCOLN-2) gene is influenced by the presence of TRPML1. Pflugers Arch. 2009;459(1):79–91. doi: 10.1007/s00424-009-0716-5. [DOI] [PMC free article] [PubMed] [Google Scholar]
- 6.Kogot-Levin A, Zeigler M, Ornoy A, Bach G. Mucolipidosis type IV: the effect of increased lysosomal pH on the abnormal lysosomal storage. Pediatr Res. 2009;65(6):686–690. doi: 10.1203/PDR.0b013e3181a1681a. [DOI] [PubMed] [Google Scholar]
- 7.Miedel MT, Rbaibi Y, Guerriero CJ, Colletti G, Weixel KM, Weisz OA, Kiselyov K. Membrane traffic and turnover in TRP-ML1-deficient cells: a revised model for mucolipidosis type IV pathogenesis. J Exp Med. 2008;205(6):1477–1490. doi: 10.1084/jem.20072194. [DOI] [PMC free article] [PubMed] [Google Scholar]
- 8.Soyombo AA, Tjon-Kon-Sang S, Rbaibi Y, Bashllari E, Bisceglia J, Muallem S, Kiselyov K. TRP-ML1 regulates lysosomal pH and acidic lysosomal lipid hydrolytic activity. J Biol Chem. 2006;281(11):7294–7301. doi: 10.1074/jbc.M508211200. [DOI] [PubMed] [Google Scholar]
- 9.Venugopal B, Mesires NT, Kennedy JC, Curcio-Morelli C, Laplante JM, Dice JF, Slaugenhaupt SA. Chaperone-mediated autophagy is defective in mucolipidosis type IV. Journal of cellular physiology. 2009;219(2):344–353. doi: 10.1002/jcp.21676. [DOI] [PubMed] [Google Scholar]
- 10.Vergarajauregui S, Connelly PS, Daniels MP, Puertollano R. Autophagic dysfunction in mucolipidosis type IV patients. Hum Mol Genet. 2008;17(17):2723–2737. doi: 10.1093/hmg/ddn174. [DOI] [PMC free article] [PubMed] [Google Scholar]
- 11.Dong XP, Cheng X, Mills E, Delling M, Wang F, Kurz T, Xu H. The type IV mucolipidosis-associated protein TRPML1 is an endolysosomal iron release channel. Nature. 2008;455(7215):992–996. doi: 10.1038/nature07311. [DOI] [PMC free article] [PubMed] [Google Scholar]
- 12.Eichelsdoerfer JL, Evans JA, Slaugenhaupt SA, Cuajungco MP. Zinc dyshomeostasis is linked with the loss of mucolipidosis IV-associated TRPML1 ion channel. J Biol Chem. 2010;285(45):34304–34308. doi: 10.1074/jbc.C110.165480. [DOI] [PMC free article] [PubMed] [Google Scholar]
- 13.Kukic I, Lee JK, Coblentz J, Kelleher SL, Kiselyov K. Zinc-dependent lysosomal enlargement in TRPML1-deficient cells involves MTF-1 transcription factor and ZnT4 (Slc30a4) transporter. Biochem J. 2013;451(2):155–163. doi: 10.1042/BJ20121506. [DOI] [PMC free article] [PubMed] [Google Scholar]
- 14.Xu H, Delling M, Li L, Dong X, Clapham DE. Activating mutation in a mucolipin transient receptor potential channel leads to melanocyte loss in varitint-waddler mice. Proc Natl Acad Sci U S A. 2007;104(46):18321–18326. doi: 10.1073/pnas.0709096104. [DOI] [PMC free article] [PubMed] [Google Scholar]
- 15.Jennings JJ, Jr, Zhu JH, Rbaibi Y, Luo X, Chu CT, Kiselyov K. Mitochondrial aberrations in mucolipidosis Type IV. J Biol Chem. 2006;281(51):39041–39050. doi: 10.1074/jbc.M607982200. [DOI] [PubMed] [Google Scholar]
- 16.Frederickson CJ. Neurobiology of zinc and zinc-containing neurons. Int Rev Neurobiol. 1989;31:145–238. doi: 10.1016/s0074-7742(08)60279-2. [DOI] [PubMed] [Google Scholar]
- 17.Cuajungco MP, Lees GJ. Zinc metabolism in the brain: relevance to human neurodegenerative disorders. Neurobiol Dis. 1997;4(3-4):137–169. doi: 10.1006/nbdi.1997.0163. [DOI] [PubMed] [Google Scholar]
- 18.Cuajungco MP, Lees GJ. Nitric oxide generators produce accumulation of chelatable zinc in hippocampal neuronal perikarya. Brain research. 1998;799(1):118–129. doi: 10.1016/s0006-8993(98)00463-6. [DOI] [PubMed] [Google Scholar]
- 19.Frederickson CJ, Cuajungco MP, LaBuda CJ, Suh SW. Nitric oxide causes apparent release of zinc from presynaptic boutons. Neuroscience. 2002;115(2):471–474. doi: 10.1016/s0306-4522(02)00399-8. [DOI] [PubMed] [Google Scholar]
- 20.Sensi SL, Jeng JM. Rethinking the excitotoxic ionic milieu: the emerging role of Zn(2+) in ischemic neuronal injury. Curr Mol Med. 2004;4(2):87–111. doi: 10.2174/1566524043479211. [DOI] [PubMed] [Google Scholar]
- 21.Choi DW, Yokoyama M, Koh J. Zinc neurotoxicity in cortical cell culture. Neuroscience. 1988;24(1):67–79. doi: 10.1016/0306-4522(88)90312-0. [DOI] [PubMed] [Google Scholar]
- 22.Yokoyama M, Koh J, Choi DW. Brief exposure to zinc is toxic to cortical neurons. Neurosci Lett. 1986;71(3):351–355. doi: 10.1016/0304-3940(86)90646-4. [DOI] [PubMed] [Google Scholar]
- 23.Colvin RA, Holmes WR, Fontaine CP, Maret W. Cytosolic zinc buffering and muffling: their role in intracellular zinc homeostasis. Metallomics : integrated biometal science. 2010;2(5):306–317. doi: 10.1039/b926662c. [DOI] [PubMed] [Google Scholar]
- 24.Chung H, Yoon YH, Hwang JJ, Cho KS, Koh JY, Kim JG. Ethambutol-induced toxicity is mediated by zinc and lysosomal membrane permeabilization in cultured retinal cells. Toxicol Appl Pharmacol. 2009;235(2):163–170. doi: 10.1016/j.taap.2008.11.006. [DOI] [PubMed] [Google Scholar]
- 25.Hwang JJ, Lee SJ, Kim TY, Cho JH, Koh JY. Zinc and 4-hydroxy-2-nonenal mediate lysosomal membrane permeabilization induced by H2O2 in cultured hippocampal neurons. J Neurosci. 2008;28(12):3114–3122. doi: 10.1523/JNEUROSCI.0199-08.2008. [DOI] [PMC free article] [PubMed] [Google Scholar]
- 26.Yoon YH, Jung KH, Sadun AA, Shin HC, Koh JY. Ethambutol-induced vacuolar changes and neuronal loss in rat retinal cell culture: mediation by endogenous zinc. Toxicol Appl Pharmacol. 2000;162(2):107–114. doi: 10.1006/taap.1999.8846. [DOI] [PubMed] [Google Scholar]
- 27.Kukic I, Kelleher SL, Kiselyov K. Zinc efflux through lysosomal exocytosis prevents zinc-induced toxicity. J Cell Sci. 2014 doi: 10.1242/jcs.145318. [DOI] [PMC free article] [PubMed] [Google Scholar]
- 28.Burre J, Zimmermann H, Volknandt W. Identification and characterization of SV31, a novel synaptic vesicle membrane protein and potential transporter. J Neurochem. 2007;103(1):276–287. doi: 10.1111/j.1471-4159.2007.04758.x. [DOI] [PubMed] [Google Scholar]
- 29.Barth J, Zimmermann H, Volknandt W. SV31 is a Zn2+-binding synaptic vesicle protein. J Neurochem. 2011;118(4):558–570. doi: 10.1111/j.1471-4159.2011.07344.x. [DOI] [PubMed] [Google Scholar]
- 30.Grimm C, Jors S, Saldanha SA, Obukhov AG, Pan B, Oshima K, Cuajungco MP, Chase P, Hodder P, Heller S. Small molecule activators of TRPML3. Chemistry & biology. 2010;17(2):135–148. doi: 10.1016/j.chembiol.2009.12.016. [DOI] [PMC free article] [PubMed] [Google Scholar]
- 31.Thaminy S, Miller J, Stagljar I. The split-ubiquitin membrane-based yeast two-hybrid system. Methods Mol Biol. 2004;261:297–312. doi: 10.1385/1-59259-762-9:297. [DOI] [PubMed] [Google Scholar]
- 32.Manzoni M, Monti E, Bresciani R, Bozzato A, Barlati S, Bassi MT, Borsani G. Overexpression of wild-type and mutant mucolipin proteins in mammalian cells: effects on the late endocytic compartment organization. FEBS Lett. 2004;567(2-3):219–224. doi: 10.1016/j.febslet.2004.04.080. [DOI] [PubMed] [Google Scholar]
- 33.Vergarajauregui S, Martina JA, Puertollano R. LAPTMs regulate lysosomal function and interact with mucolipin 1: new clues for understanding mucolipidosis type IV. J Cell Sci. 2011;124(Pt 3):459–468. doi: 10.1242/jcs.076240. [DOI] [PMC free article] [PubMed] [Google Scholar]
- 34.Cuajungco MP, Grimm C, Oshima K, D'Hoedt D, Nilius B, Mensenkamp AR, Bindels RJ, Plomann M, Heller S. PACSINs bind to the TRPV4 cation channel. PACSIN 3 modulates the subcellular localization of TRPV4. J Biol Chem. 2006;281(27):18753–18762. doi: 10.1074/jbc.M602452200. [DOI] [PubMed] [Google Scholar]
- 35.D'Hoedt D, Owsianik G, Prenen J, Cuajungco MP, Grimm C, Heller S, Voets T, Nilius B. Stimulus-specific modulation of the cation channel TRPV4 by PACSIN 3. J Biol Chem. 2008;283(10):6272–6280. doi: 10.1074/jbc.M706386200. [DOI] [PubMed] [Google Scholar]
- 36.Carrasquillo R, Tian D, Krishna S, Pollak MR, Greka A, Schlondorff J. SNF8, a member of the ESCRT-II complex, interacts with TRPC6 and enhances its channel activity. BMC Cell Biol. 2012;13:33. doi: 10.1186/1471-2121-13-33. [DOI] [PMC free article] [PubMed] [Google Scholar]
- 37.Vinuela-Fernandez I, Sun L, Jerina H, Curtis J, Allchorne A, Gooding H, Rosie R, Holland P, Tas B, Mitchell R, Fleetwood-Walker S. The TRPM8 channel forms a complex with the 5-HT1B receptor and phospholipase D that amplifies its reversal of pain hypersensitivity. Neuropharmacology. 2014;79:136–151. doi: 10.1016/j.neuropharm.2013.11.006. [DOI] [PubMed] [Google Scholar]
- 38.Frederickson CJ, Kasarskis EJ, Ringo D, Frederickson RE. A quinoline fluorescence method for visualizing and assaying the histochemically reactive zinc (bouton zinc) in the brain. J Neurosci Methods. 1987;20(2):91–103. doi: 10.1016/0165-0270(87)90042-2. [DOI] [PubMed] [Google Scholar]
- 39.Vergarajauregui S, Puertollano R. Two di-leucine motifs regulate trafficking of mucolipin-1 to lysosomes. Traffic. 2006;7(3):337–353. doi: 10.1111/j.1600-0854.2006.00387.x. [DOI] [PMC free article] [PubMed] [Google Scholar]
- 40.LaPlante JM, Sun M, Falardeau J, Dai D, Brown EM, Slaugenhaupt SA, Vassilev PM. Lysosomal exocytosis is impaired in mucolipidosis type IV. Mol Genet Metab. 2006;89(4):339–348. doi: 10.1016/j.ymgme.2006.05.016. [DOI] [PubMed] [Google Scholar]
- 41.Samie M, Wang X, Zhang X, Goschka A, Li X, Cheng X, Gregg E, Azar M, Zhuo Y, Garrity AG, Gao Q, Slaugenhaupt S, Pickel J, Zolov SN, Weisman LS, et al. A TRP channel in the lysosome regulates large particle phagocytosis via focal exocytosis. Dev Cell. 2013;26(5):511–524. doi: 10.1016/j.devcel.2013.08.003. [DOI] [PMC free article] [PubMed] [Google Scholar]
- 42.Cousins RJ, Liuzzi JP, Lichten LA. Mammalian zinc transport, trafficking, and signals. J Biol Chem. 2006;281(34):24085–24089. doi: 10.1074/jbc.R600011200. [DOI] [PubMed] [Google Scholar]
- 43.Eide DJ. Zinc transporters and the cellular trafficking of zinc. Biochim Biophys Acta. 2006;1763(7):711–722. doi: 10.1016/j.bbamcr.2006.03.005. [DOI] [PubMed] [Google Scholar]
- 44.Lichten LA, Cousins RJ. Mammalian zinc transporters: nutritional and physiologic regulation. Annual review of nutrition. 2009;29:153–176. doi: 10.1146/annurev-nutr-033009-083312. [DOI] [PubMed] [Google Scholar]
- 45.Meeusen JW, Tomasiewicz H, Nowakowski A, Petering DH. TSQ (6-methoxy-8-p-toluenesulfonamido-quinoline), a common fluorescent sensor for cellular zinc, images zinc proteins. Inorganic chemistry. 2011;50(16):7563–7573. doi: 10.1021/ic200478q. [DOI] [PMC free article] [PubMed] [Google Scholar]
- 46.Cho YE, Lomeda RA, Ryu SH, Lee JH, Beattie JH, Kwun IS. Cellular Zn depletion by metal ion chelators (TPEN, DTPA and chelex resin) and its application to osteoblastic MC3T3-E1 cells. Nutrition research and practice. 2007;1(1):29–35. doi: 10.4162/nrp.2007.1.1.29. [DOI] [PMC free article] [PubMed] [Google Scholar]
- 47.Venkatachalam K, Hofmann T, Montell C. Lysosomal localization of TRPML3 depends on TRPML2 and the mucolipidosis-associated protein TRPML1. J Biol Chem. 2006;281(25):17517–17527. doi: 10.1074/jbc.M600807200. [DOI] [PMC free article] [PubMed] [Google Scholar]
- 48.Cuajungco MP, Lees GJ. Diverse effects of metal chelating agents on the neuronal cytotoxicity of zinc in the hippocampus. Brain research. 1998;799(1):97–107. doi: 10.1016/s0006-8993(98)00482-x. [DOI] [PubMed] [Google Scholar]
- 49.Koh JY, Choi DW. Zinc toxicity on cultured cortical neurons: involvement of N-methyl-D-aspartate receptors. Neuroscience. 1994;60(4):1049–1057. doi: 10.1016/0306-4522(94)90282-8. [DOI] [PubMed] [Google Scholar]
- 50.Redenti S, Chappell RL. Neuroimaging of zinc released by depolarization of rat retinal cells. Vision research. 2005;45(28):3520–3525. doi: 10.1016/j.visres.2005.07.039. [DOI] [PubMed] [Google Scholar]
- 51.Spooner E, McLaughlin BM, Lepow T, Durns TA, Randall J, Upchurch C, Miller K, Campbell EM, Fares H. Systematic screens for proteins that interact with the mucolipidosis type IV protein TRPML1. PloS one. 2013;8(2):e56780. doi: 10.1371/journal.pone.0056780. [DOI] [PMC free article] [PubMed] [Google Scholar]
- 52.Cuajungco MP, Podevin W, Valluri VK, Bui Q, Nguyen VH, Taylor K. Abnormal accumulation of human transmembrane (TMEM)-176A and 176B proteins is associated with cancer pathology. Acta histochemica. 2012;114(7):705–712. doi: 10.1016/j.acthis.2011.12.006. [DOI] [PMC free article] [PubMed] [Google Scholar]
- 53.Bustin SA, Benes V, Garson JA, Hellemans J, Huggett J, Kubista M, Mueller R, Nolan T, Pfaffl MW, Shipley GL, Vandesompele J, Wittwer CT. The MIQE guidelines: minimum information for publication of quantitative real-time PCR experiments. Clin Chem. 2009;55(4):611–622. doi: 10.1373/clinchem.2008.112797. [DOI] [PubMed] [Google Scholar]
- 54.Cuajungco MP, Leyne M, Mull J, Gill SP, Lu W, Zagzag D, Axelrod FB, Maayan C, Gusella JF, Slaugenhaupt SA. Tissue-specific reduction in splicing efficiency of IKBKAP due to the major mutation associated with familial dysautonomia. Am J Hum Genet. 2003;72(3):749–758. doi: 10.1086/368263. [DOI] [PMC free article] [PubMed] [Google Scholar]
- 55.Sarkanen JR, Nykky J, Siikanen J, Selinummi J, Ylikomi T, Jalonen TO. Cholesterol supports the retinoic acid-induced synaptic vesicle formation in differentiating human SH-SY5Y neuroblastoma cells. J Neurochem. 2007;102(6):1941–1952. doi: 10.1111/j.1471-4159.2007.04676.x. [DOI] [PubMed] [Google Scholar]
- 56.Schieder M, Rotzer K, Bruggemann A, Biel M, Wahl-Schott C. Planar patch clamp approach to characterize ionic currents from intact lysosomes. Science signaling. 2010;3(151):pl3. doi: 10.1126/scisignal.3151pl3. [DOI] [PubMed] [Google Scholar]
- 57.Cang C, Zhou Y, Navarro B, Seo YJ, Aranda K, Shi L, Battaglia-Hsu S, Nissim I, Clapham DE, Ren D. mTOR regulates lysosomal ATP-sensitive two-pore Na(+) channels to adapt to metabolic state. Cell. 2013;152(4):778–790. doi: 10.1016/j.cell.2013.01.023. [DOI] [PMC free article] [PubMed] [Google Scholar]
Associated Data
This section collects any data citations, data availability statements, or supplementary materials included in this article.
Supplementary Materials
Figure S1. Mouse Tmem163 and Trpml1 interact. A) Using the same high stringency selection (–LTAH with 5 mM 3-AT), the mb-YTH assay showed that Tmem163 does not interact with Trpml3. A transactivation or non-specific interaction between Trpml3-CubG-LexA-VP16 and Fur4-NubG, as well as Trpml3-CubG-LexA-VP16 and Ost1-NubG was observed. B) Representative Western blot (WB) of co-immunoprecipitated Trpml1-HA and Tmem163-Myc elutes Tmem163 (31.2 kDa, arrowhead). The plasmids containing the cDNA of each protein were transfected and heterologously co-expressed in HEK-293 cells. The lysates were processed for co-immunoprecipitation (co-IP) using Dynabeads™ (Life Technologies) according to the manufacturer's protocol. I, input/flow-through; W, wash; E, elution. C) Mass spectrometry (MS) of eluted band identified Tmem163 upon co-IP with Trpml1. The eluted samples were resolved on 4-20% SDS-PAGE gel, washed with sterile distilled-deionized water, and stained with Coomassie blue. The bands were excised, frozen, and sent to the Stanford University Mass Spectrometry Core facility. The yellow highlighted amino acid (AA) sequences indicate four unique peptide hits obtained from seven out of nine unique MS/MS spectra. The green highlighted AA indicates oxidation status. The data were analyzed using the Scaffold 3 software. D) Representative confocal images of heterologously co-expressed Tmem163-RFP (red) and Trpml1-GFP (green) heterologously co-expressed in SH-SY5Y neuroblastoma cells. The subcellular distribution of Tmem163 and Trpml1 showed partial co-localization within vesicular compartments appearing as yellow structures (arrowheads). mAb, monoclonal antibody; pAb, polyclonal antibody; Scale bar: 20 μm.
Figure S2. Additional control experiments for the co-immunoprecipitation study. A) Heterologous expression of single TMEM163-HA (31.5 kDa, top panel) construct, or single TRPML1-DDK (65 kDa, bottom panel) construct in HEK-293 cells. IP of TMEM163-HA single expression lysates using anti-DDK monoclonal antibody (mAb) did not show an elution profile upon Western blot (WB) analysis. Similarly, IP of TRPML1 single expression lysates using anti-HA polyclonal antibody (pAb) showed no elution profile. These results indicate that the overexpressed proteins did not bind non-specifically to the agarose beads. B) The top panel shows a representative WB image of the co-IP of heterologously expressed TRPML2-DDK and TMEM176A. The bottom panel shows the presence of co-expressed TRPML2-DDK protein within the sample using anti-DDK mAb. The result showed that TRPML2-DDK (65.4 kDa) and TMEM176A (25.9 kDa) proteins physically interact. Both proteins were initially identified as interactors in a genetic screen using mb-YTH assay. TMEM176A is a lysosome-associated protein previously implicated in cancer pathology (62). C) The top panel shows a representative WB image of heterologously co-expressed TMEM163-HA protein upon co-IP with TMEM176A-DDK. The blot showed that TMEM163-HA and TMEM176A-DDK do not interact. The bottom panel shows the presence of co-expressed TMEM163-HA within the same sample using anti-HA mAb. The data indicated that the lack of interaction between the two proteins was not due to the absence of TMEM163 expression. I, input/flow-through; W, wash; E, elution. High MW IgG (55 kDa); Low MW IgG (23 kDa).
Figure S3. Specificity of anti-TRPML1 monoclonal antibody and anti-TMEM163 polyclonal antibody. A) Representative Western blot (WB) image showing that the anti-TRPML1 mouse monoclonal antibody (mAb) used in this study detected endogenous TRPML1 protein from HGT-1 cells (left panel, arrowhead) and upon heterologous expression in human SH-SY5Y neuroblastoma cells (right panel, arrowheads). 1-mer, monomer; 2-mer, dimer; N-mer, multimer. B) Representative WB image showing that the anti-TMEM163 rabbit polyclonal antibody (pAb) used in this study detected the endogenous TMEM163 present in HGT-1 cells (left panel, arrowheads) and upon heterologous expression in human SH-SY5Y neuroblastoma cells (right panel, arrowheads). In HGT-1 cell lysates, the anti-TMEM163 detected several bands because it is a pAb; however, IP of cell lysates with the anti-TMEM163 pAb enriched the endogenous protein and increased the specificity of the detected TMEM163 protein bands, which appeared as monomeric and dimeric species.
Figure S4. Whole-lysosome planar patch clamp using the SF-22 compound. A) Representative current-voltage (I-V) relationship graph showing TRPML1 inwardly rectifying currents from luminal to cytosol following electrophysiological recording of lysosomes in HEK-293 cells heterologously expressing TRPML1-YFP in the presence of SF-22 (10 μM, applied on the cytosolic side). The basal current was obtained from lysosomes of untransfected HEK-293 cells. B) Representative I-V relationship graph showing inwardly rectifying currents from luminal to cytosol following electrophysiological recording of lysosomes in wild type (WT) fibroblast cells in the presence of SF-22 (10 μM, applied on the cytosolic side). Note that the trace mimics that of lysosomes expressing TRPML1-YFP shown in A. The lysosomes taken from MLIV patient fibroblast cells did not produce a current.
Figure S5. Schematic diagram illustrating a map of human TMEM163 cDNA and its corresponding protein sequence. The solid black-arrow line indicates the position of deleted amino acids (AA) for TMEM163-Δ42 and TMEM163-Δ71 mutants. TMEM163 has a predicted six TM domains with long N-terminus region and a short C-terminus region (aqua-shaded box). Both N- and C-termini are predicted to be in the cytoplasm. The map was generated using DNASTAR SeqBuilder 9.1 software (Lasergene, Madison, WI). TM, transmembrane domain.
Figure S6. Confocal micrographs of heterologously expressed wild type or mutant TRPML1 and TMEM163. A) Wild type TRPML1 co-expressed with wild type (WT) TMEM163, TMEM163-Δ42 amino acid (AA) deletion mutant and TMEM163-Δ71 AA deletion mutant. The subcellular localization of WT TMEM163 appeared to be very similar to the deletion mutants and their co-localization with TRPML1 was virtually the same. This result suggests that the deletion did not alter the distribution of the mutant proteins. B) LTS mutant TRPML1(NC) co-expressed with wild type TMEM163, TMEM163-Δ42 AA deletion mutant, and TMEM163-Δ71 AA deletion mutant. Similarly, no apparent changes in the subcellular distribution were observed in WT TMEM163 and deletion mutants, or their co-localization with TRPML1(NC) mutant protein. Scale Bar: 20 μm.
Figure S7. Analysis of effective shRNA knockdown of heterologously overexpressed human TMEM163. A) Standard RT-PCR showed marked TMEM163 transcript reduction 48 h following RNAi treatment. The SH-SY5Y neuroblastoma cells were co-transfected with pCMV6-AC-TMEM163-GFP construct and the following pRFP-C-RS-shRNA plasmids targeting TMEM163 (357-, 358-, 359-, and 360-shRNA), scrambled sequence (scr-shRNA) control and negative shRNAs (vec-shRNA) control. The standard PCR reaction was done for 23 cycles to prevent a saturated signal, and allow us to detect the relative starting quantities of TMEM163 transcripts. Human GAPDH was used as loading control. The PCR primers used in this experiment are shown on Table S1. B) Western blot analysis exhibited a similar effect on overexpressed TMEM163 protein levels 48 h after RNAi treatment of cells with the same shRNA plasmids. We used a pCMV6-AC-TMEM163-HA expression plasmid for this experiment. The blot was detected by anti-HA polyclonal antibody using anti-rabbit IRDye-800CW secondary antibody as described in the Materials and Methods section.