

Abstract
An intravenous step-down infusion procedure that maintained a constant gadolinium-diethylene-triaminepentaacetic acid (Gd-DTPA) blood concentration and magnetic resonance imaging (MRI) were used to localize and quantify the blood–brain barrier (BBB) opening in a rat model of transient cerebral ischemia (n = 7). Blood-to-brain influx rate constant (Ki) values of Gd-DTPA from such regions were estimated using MRI–Patlak plots and compared with the Ki values of Gd-[14C]DTPA, determined minutes later in the same rats with an identical step-down infusion, quantitative autoradiography (QAR), and single-time equation. The normalized plasma concentration–time integrals were identical for Gd-DTPA and Gd-[14C]DTPA, indicating that the MRI protocol yielded reliable estimates of plasma Gd-DTPA levels. In six rats with a BBB opening, 14 spatially similar regions of extravascular Gd-DTPA enhancement and Gd-[14C]DTPA leakage, including one very small area, were observed. The terminal tissue–plasma ratios of Gd-[14C]DTPA tended to be slightly higher than those of Gd-DTPA in these regions, but the differences were not significant. The MRI-derived Ki values for Gd-DTPA closely agreed and correlated well with those obtained for Gd-[14C]DTPA. In summary, MRI estimates of Gd-DTPA concentration in the plasma and brain and the influx rate are quantitatively and spatially accurate with step-down infusions.
Keywords: arterial input function, blood–brain barrier, magnetic resonance contrast agents, Patlak plot, rat, stroke
Introduction
The most commonly used magnetic resonance contrast agents (MRCAs) comprise gadolinium (Gd) linked to a chelating compound, such as diethylene-triaminepentaacetic acid (Gd-DTPA). Such chelates very slowly, if at all, penetrate the normal blood–brain barrier (BBB) (Blasberg et al, 1983). In cerebrovascular disorders, including stroke, the BBB is partially or completely opened in at least a part of the affected brain, and the MRCA leaks into the tissue at the sites where the opening is sufficient. This occurrence can be visualized using magnetic resonance imaging (MRI) as a region of contrast enhancement (Elster and Moody 1990; Esser et al, 1996; Larsson et al, 1990; Niendorf et al, 1985; Virapongse et al, 1986; Warach and Latour 2004; Weinmann et al, 1984). During the acute phase of experimental stroke and reperfusion in animals, a relatively modest increase in BBB permeability seems to precede parenchymal hemorrhage (Hamann et al, 1999; Knight et al, 1998); the same is observed in human stroke (Hjort et al, 2008). Early detection and accurate measurement of such damages are deemed crucial for screening patients for thrombolytic therapy and for minimizing the incidence of parenchymal hemorrhage, which is the major drawback of this treatment (Hjort et al, 2008).
When influx is quantified properly, the rate of MRCA leakage into this region yields a blood-to-brain transfer constant (Ki) of Gd-DTPA, which is a function of permeability–surface area product and blood flow (Ewing et al, 2003a; Tofts and Kermode 1991). The advantage of estimating Ki is that the permeability–surface area product of the MRCA to the BBB can be determined using the Renkin–Crone equation, when the rate of blood flow is known (Blasberg et al, 1983; Crone, 1963; Renkin, 1959). In a few experimental studies, MRI estimates of the Ki of Gd-DTPA have been compared with those of either 14C-sucrose or [14C]α-aminoisobutyric acid (Kenney et al, 1992; Preston and Foster, 1993), sometimes obtained minutes later using quantitative autoradiography (QAR) in the same animal (Ewing et al, 2003a; Ferrier et al, 2007; Knight et al, 2005a). These findings have shown that the Ki of Gd-DTPA measured using MRI in brain tumor and stroke models correlates well with that of either 14C-sucrose or [14C]α-aminoisobutyric acid found in the same areas using QAR. However, there are two important differences in the MRI and QAR parts of these experiments. First, the same tracer was not used in both measurements. Second, Ki for the Gd-DTPA plasma and tissue data was determined using Patlak plots (Patlak et al, 1983), whereas it was assessed using the single-time equation for the radiotracer plasma and QAR data. The purpose of this study was to eliminate the MRCA–radiotracer differences and to compare MRI and QAR assays of plasma and brain concentrations of Gd-DTPA and its radio-labeled analog, Gd-[14C]DTPA, both intravenously infused with a step-down protocol that produced a nearly constant plasma concentration.
In both procedures, blood levels of the tracers were measured many times over the experimental period. From these data, the plasma concentration over time, constancy of concentration, area under the concentration–time curve (AUC), and normalized AUC were determined for both Gd-DTPA and Gd-[14C]DTPA. The first comparison was made to determine whether the two AUCs were essentially identical, whereas the second was made to assess the comparability of the terminal tissue–plasma ratios of Gd-DTPA and Gd-[14C]DTPA. After verifying the similarity of these parameters, the data were used to estimate Ki, using Patlak plots (Ewing et al, 2003a; Knight et al, 2005a) for Gd-DTPA and the single-time equation (Blasberg et al, 1983) for Gd-[14C]DTPA. The findings were used to test the hypotheses that, for constant plasma concentration conditions: (1) MRI quantifies blood and tissue concentrations nearly as well as direct arterial blood sampling and QAR; (2) both procedures result in spatially identical images of BBB opening; and (3) blood-to-brain influx rate constants obtained from the two techniques are similar and well correlated.
Materials and methods
Experimental Model
All animal handling and surgical procedures were carried out under a protocol approved by the Institutional Animal Care and Use Committee. Male Wistar rats (Charles River Laboratories, Wilmington, MA, USA; ~300 g; n = 7) were used in this study. Anesthesia with halothane (1.5%) in a N2O:O2 (2:1) gas mixture was used throughout the surgical preparation and in the subsequent experimental period. One femoral artery and vein were cannulated for physiologic monitoring and MRCA injection, respectively. The rats underwent suture occlusion of the middle cerebral artery (MCA) for 3 h according to methods described in detail elsewhere (Ewing et al, 2003a; Fagan et al, 2003; Knight et al, 2005a; Nagaraja et al, 2008a, 2008b). At 3 h, the suture was withdrawn to restore blood flow. Physiologic parameters such as blood pressure, blood gases, pH, glucose, osmolality, and hematocrit were measured during and after MRI.
Magnetic Resonance Imaging System and Protocol
All studies were carried out using a 7 Tesla, 20-cm bore superconducting Magnex magnet (Magnex Scientific Inc., Abingdon, UK) interfaced to a Bruker console (Bruker Biospin MRI, Inc., Billerica, MA, USA) and equipped with a 12 cm self-shielded gradient set capable of producing 25 Gauss/cm gradients with 100-μsec rise times. Estimates of cerebral blood flow (CBF) and T2-weighted images were acquired 45 to 120 mins after MCA occlusion as described earlier (Ewing et al, 2003a, 2003b; Knight et al, 2005b).
After 3 h of occlusion, the rat was removed from the magnet, and the occluding suture withdrawn to begin reperfusion. The rat was returned to the magnet immediately afterwards. After reperfusion, the T2-weighted images and CBF data were acquired 30 to 120 mins thereafter. At ~2.5 h after reperfusion, Gd-DTPA-based contrast-enhanced MRI was carried out to localize extravascular enhancement and to quantify blood-to-brain transfer constants.
Gd-DTPA Administration
All reagents were purchased from Sigma-Aldrich (St Louis, MO, USA) and used as received. Solutions of Gd-DTPA and Gd-[14C]DTPA were prepared in-house following published methods (Strich et al, 1985); Gd-DTPA concentration in the stock solution was 400 mmol/L. For the infusate, 300 μL of the stock solution was diluted to 5.0mL with normal saline. The intravenous step-down infusion was carried out with a syringe pump (Model 944, Harvard Apparatus, South Natick, MA, USA) using a prescribed infusion schedule that quickly increased the concentration of Gd-DTPA in blood to a plateau level and maintained it nearly constant thereafter (Nagaraja et al, 2007; Patlak and Pettigrew 1976).
Look–Locker Magnetic Resonance Imaging Quantification of T1 After Gd-DTPA Infusion
Baseline T1-weighted spin-echo (TR/TE = 1,000/20 msecs) and Look–Locker (L–L) scans were collected before Gd-DTPA administration. Thereafter, the Gd-DTPA step-down infusion was begun. Estimates of the longitudinal relaxation rate, R1 (R1 = 1/T1), were obtained using the L–L data at ~3-min intervals for the next 21 mins. Data were obtained for five interleaved 2-mm-thick slices. The R1 values for venous blood within the sagittal sinus were determined from the maps and used to construct the time course of MRCA, which was assumed to approximate the arterial input function (AIF). At the conclusion of the L–L series, a final postcontrast T1-weighted multislice spin-echo image set was obtained (Ewing et al, 2003a; Knight et al, 2005b).
Magnetic Resonance Data Analysis and Selection of Regions of Interest (ROI)
All MRI data analyses were carried out on a SUN workstation (SUN Microsystems, Inc., Santa Clara, CA, USA). The MRI data were reconstructed using in-house software before applying the segmentation procedure. The data presented were taken from what will be referred to hereafter as the central slice (2.0mm in thickness and extending from the bregma −1.85 to + 0.15 mm).
Patlak plots are graphs of the MRCA concentration in the brain at each time, t, divided by the plasma concentration at t [Cp(t)], plotted against the AIF from zero to t, divided by Cp(t) (Ewing et al, 2003a). If the plot has a linear phase with a slope significantly greater than zero, then uptake has been irreversible over this period, and the slope equals the rate of influx, Ki. Using this procedure, maps of Ki were produced on a pixel-by-pixel basis for each experiment. The y-intercept of the linear portion of the Patlak plot of MRI data is a function of the distribution volumes of the protons affected by the plasma-contained MRCAwithin the field of observation. The volume fraction of these compartments was denoted by Patlak et al as Vo, and the y-intercept is thus symbolized by Vp +Vo. The use of Patlak plots was validated by the linearity of the plots, as will be shown in the Results section.
Ischemic brain regions with BBB opening were identified and segmented on the basis of Patlak plot-derived F-test maps (Ewing et al, 2006). For this purpose, we considered two models: Model 1 with no influx (Ki = 0 but (Vp +Vo) > 0) and Model 2 (the original Patlak model) with appreciable MRCA influx (Ki > 0 and Vp +Vo > 0) but little or no efflux. The pixel-by-pixel estimates of the sum-squared residuals of the data plotted, based on these two models, were used to compute and map the F-statistic. The null hypothesis in the F-test was that the two models are equivalent. Rejection of the hypothesis leads to the acceptance of Model 2 (the model with the smaller sum-squared residuals) for that pixel. The threshold F-value for the acceptance of leakage in a voxel was set at P = 0.01. The array of contiguous voxels of significant MRCA leakage formed each ROI. The F-test-segmented ROIs were mostly located in the core of the ischemic lesion as seen on histology.
Quantitative Autoradiography and Histopathology
The assessment of Ki by QAR was begun minutes after the Gd-DTPA-enhanced MRI measurement. After removal from the magnet, the rat was placed on a water-heated mat and kept anesthetized using the halothane:N2O:O2 gas mixture. After collecting an arterial blood sample for physiologic measurements, the intravenous step-down infusion of Gd-[14C]DTPA (~80 μCi in 5mL of a 40 mmol/L solution) was started, and timed arterial blood samples (~50 μL per sample) were taken to establish the AIF and AUC for Gd-[14C]DTPA. The rats were decapitated immediately after collecting the last sample at 20 mins, and their heads were frozen instantly in 2-methyl butane cooled to ~−45°C using dry ice. The brains were processed using QAR following published procedures (Knight et al, 2005a; Nagaraja et al, 2005). Briefly, the frozen 20-μm-thick brain sections were cut in sets of five at 400-μm intervals. The first and last sections were picked up on numbered slides and stained with cresyl violet (CV). The middle three sections were affixed in the order of sectioning to cardboard sheets and, along with 14C-calibration standards, were exposed to Kodak MR2000 autoradiography film (Eastman Kodak Co., Rochester, NY, USA). After ~25 days, the films were developed to produce autoradiograms (ARGs) of the brain sections. The ARG images of those sections corresponding to the MRI central slice were compared visually with those of the MR-based Ki maps to confirm the spatial correlation of leakage patterns.
Using a computerized image analysis system (Model AIS, Imaging Research, St Catharines, ON, Canada), optical densities were determined within the ipsilateral ROIs and topographically matching areas on the contralateral side, and converted to a concentration of radioactivity (nCi/g tissue) using a curve generated from the 14C-standard data. A correction for intravascular radioactivity was carried out by subtracting the 14C-radioactivity of the contralateral side from that within the ipsilateral ROI. The resultant radioactivities were averaged across the five, 400 μm-apart ARG images that lay within the 2-mm-thick central slice of the L–L–T1WI maps. Estimates of Ki were made by dividing these corrected and averaged tissue radioactivities (nCi/g) by those of the AUC (nCi/mL per min); this is the single-time equation (Blasberg et al, 1983).
The terminal volume of Gd-[14C]DTPA distribution (VR) was measured within each ROI by dividing the total tissue radioactivity by that of the final (20 mins) plasma sample (nCi/mL) (Blasberg et al, 1983). Following the same procedure, the plasma and tissue ΔR1 data at 20 mins were used to calculate the VR of Gd-DTPA for each ROI.
The image analysis system was also used to measure brain swelling, tissue damage (area of pallor) from the CV-stained sections, and BBB lesion volumes from the areas of Gd-[14C]DTPA leakage on the ARGs following published methods (Knight et al, 2005a).
Data Analysis
All data are given as mean ±s.d. or ±s.e.m. Differences between the mean parameter values derived from MRI and QAR were compared using Student’s t-tests and significance was inferred at P≤0.05. Scatter plots and linear regression analyses were used to test the correlation between the Ki derived from the two techniques, and significance was inferred at P≤0.05. The linear regression results were further confirmed using generalized estimating equations analyses to compensate for the fact that multiple ROIs were generated from the same brain slice. For this, the R2 values from regression analyses were compared using generalized estimating equation-predicted R2 values; a close agreement between the two was considered to confirm the veracity of the former (Montgomery and Peck, 1992).
Results
General Observations
During the experimental period, the measured physiologic parameters were within the normal range for halothane-anesthetized rats both during and after MRI (Table 1). After MCA occlusion, CBF in the ischemic parts of the preoptic area (PoA), striatum (Str), and parietal and insular cortex (PCx) dropped to ~20% to 40% of the corresponding contralateral values. After reperfusion, CBF varied in these regions from 35% to 70% of the contralateral values. In addition, the ischemic status of the brain was confirmed by the measured T2 and T1 relaxation times as reported elsewhere (Nagaraja et al, 2007).
Table 1.
Physiological status of the rats (n=7)
| Parameter | During MRI | During QAR |
|---|---|---|
| pH | 7.3±0.1 | 7.3±0.04 |
| pCO2 | 49.2±5.6 | 50.5±2.4 |
| pO2 | 102.6±21 | 99.4±14.4 |
| MAP | 100.6±6.1 | — |
| Blood glucosea | — | 167.4±12.1 |
| Osmolalityb | — | 294.7±12 |
| Hematocrit | — | 0.44±0.02 |
| Temp. | 37.1±0.3 | 37.4±0.5 |
MAP, mean arterial pressure; MRI, magnetic resonance imaging; QAR, quantitative autoradiography; Temp., °C rectal temperature.
Values are given as mean±s.d.
mg/100 mL plasma.
mOsm/L plasma.
Gd-[14C]DTPA and Gd-DTPA Arterial Input Functions
The plasma Gd-[14C]DTPA data indicate that the step-down infusion schedule on an average increased the concentrations at 30, 60, and 90 secs to ~65%, 90%, and 100% of the steady-state value (~530 nCi/mL), respectively (Figure 1). Arterial concentration increased slightly from 90 to 120 secs, drifted slowly downward from 120 to 600 secs, and was nearly constant from 600 to 1,200 secs. The MRI estimates of plasma Gd-DTPA concentration of the venous blood of the superior sagittal sinus (SSS) are averages for each sampling period (~150 secs), and the group means are plotted in Figure 1 at the midpoint of each period. The first point (plotted at 75 secs) is at 90% of the steady-state ΔR1 (last 5 to 6 points). The two sets of concentration points were made to roughly overlap by adjusting the ordinate scaling (Figure 1) to facilitate visual comparison.
Figure 1.

Blood and plasma concentration time courses of Gd-DTPA (left ordinate) and Gd-[14C]DTPA (right ordinate), respectively. Data are given as mean±s.e.m. (n=7). The points for the Gd-DTPA represent the mean ΔR1 and are plotted at the midpoint of the 2.5-min MRI sampling period. The Gd-[14C]DTPA points are for 2 to 3 secs sampling periods and are plotted accordingly. The changes in Gd-DTPA relaxation rates (ΔR1), were measured in the superior sagittal sinus and approximate concentration. The Gd-[14C]DTPA data are from plasma samples obtained from blood drawn from the femoral artery. The scaling was such that the two sets of points fairly closely overlay each other. The mean levels were nearly constant from ~400 secs to the end of the sampling periods for both tracers.
The two 20-min AUCs were normalized by dividing each AUC by its respective final plasma levels, yielding units of time for both. The mean (±s.e.m.) of these values were 1,203 (±100) secs for the MRCA-Gd-DTPA and 1,202 (±49) secs for Gd-[14C]DTPA.
Spatial Sensitivity, Patterns of Blood–Brain Barrier Opening, and Neuropathology
The MRI, QAR, and histologic images showed BBB opening and tissue injury (areas of pallor) in the PoA, Str, and PCx on the ipsilateral side (each marked by the large arrows in Figures 2A, 2B, 2D, and 2E). Apart from the stroke-affected brain areas, structures that normally lack a BBB, namely, the circumventricular organs, were also clearly visible by both MRI and QAR (thin arrows in Figures 2B and 2E). On the contralateral side, a thin cortical rim of brightness was produced by the MRCA and radiotracer within the pial blood vessels. A small area of brightness along the ventral surface of the contralateral hemisphere was often observed in the vicinity of the optic chiasm, circle of Willis, the cavernous sinus (venous blood), and the median eminence (a circumventricular organ) by both MRI and QAR; this feature is indicated by asterisks in Figures 2B and 2E.
Figure 2.
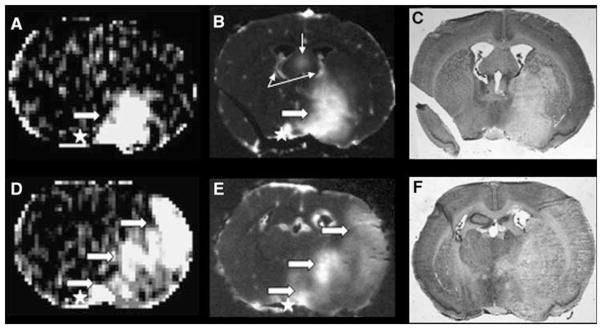
Examples of blood–brain barrier (BBB) opening as visualized by the MRI central slice (A and D) and QAR (B and E) and the corresponding area of stroke injury as demarcated by histologic pallor (i.e., light staining; C and F). The data are from two different rats. The QAR images were inverted to make the dark leakage regions appear bright to match the hyperintensities that indicate contrast enhancement on magnetic resonance images. Panels A (Ki map) and B (corresponding ARG, central of the five that were cut from the tissue spanned by the 2-mm-thick MRI slice) show a BBB lesion that spreads across the preoptic area (PoA) into the striatum (Str) in one of the two rat brains. Large, white arrows point to the areas of abnormal brightness. Although not apparent from the figure, the degree of brightness on the ARG was not uniform and implies some variation in the BBB opening within this tissue. Panel C shows a CV-stained section obtained adjacent to the ARG of panel B with a large area of pallor. The latter was similar in location to the BBB lesion in panel B, but somewhat larger in size. Regions that normally lack a BBB (circumventricular organs or CVOs) are marked by thin arrows. Panels D and E are from a different animal and display a large area of BBB opening that comprised virtually contiguous parts of the PoA, Str, and cortex (PCx); they are marked by the lower, middle, and upper broad arrows, respectively. Panel F is the corresponding histology with a very large area of pallor that extended across all three ROIs. The latter also showed considerable swelling of the ischemic (right) hemisphere and midline displacement.
The F-test-segmented ROIs were mostly located in the core of the ischemic lesion as seen on histology, and their location agreed with those observed in the accompanying ARGs of Gd-[14C]DTPA distribution. The capability of MRI with the step-down infusion of Gd-DTPA to find areas of leakage seemed to be similar to that of QAR. In six of the rats, virtually identical areas of BBB opening were observed using both MRI and QAR. No opening was found by either technique in the seventh rat. At least two separate areas of leakage were observed by both methods in five of these six rats. The distribution of the 14 areas of BBB opening was 6 in the PoA, 5 in the Str, and 3 in the PCx.
The chance of detecting a small BBB lesion using MRI with a step-down infusion of MRCA seemed to be quite good. For example, a small cluster of contiguous contrast-enhanced pixels was observed by MRI in the PCx (the right solid arrow in Figure 3A). The groups of five autoradiographic images and five adjacent histologies, which come from tissue sections taken within the MRI slice, show a small, punctate area of leakage of Gd-[14C]DTPA in the first two ARGs (Figure 3B and 3D) and a similar area of pallor in the adjacent histologies (Figure 3C and 3E). This lesion did not extend into the remaining three ARGs and their histologies.
Figure 3.
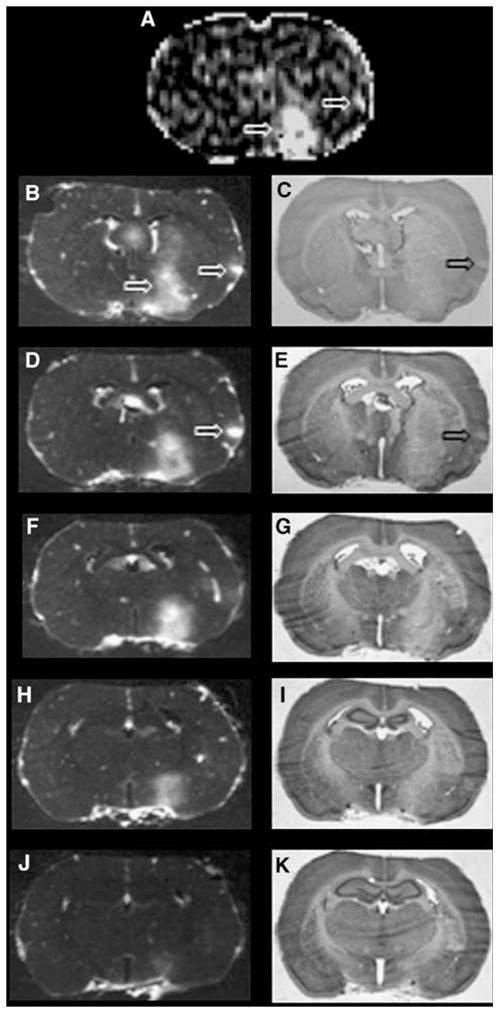
Examples of blood–brain barrier (BBB) opening as observed by an MRI central slice (A) and the five ARGs (B, D, F, H, and J) that spanned the 2-mm-thick MRI slice and the adjacent histologies (C, E, G, I, and K). Panel A is a Ki map. The two thick arrows indicate a sizable BBB lesion in a part of the PoA and Str (lower arrow) and a small area of BBB opening in the parietal cortex (upper arrow). The ARG images show that the PoA–Str area of Gd-14C-DTPA leakage extended through ~80% of the MRI slice (panels B, D, F, and H). The small cortical BBB lesion was observed only in ARGs, B and D (large arrow on the right), most prominently in panel D. The histologies show that the PoA–Str area of tissue pallor was large and visible through all five sections, whereas just a small, <1.0 mm-wide area of pallor was found within PCx (panels C and E, which correspond to ARGs, B and D, respectively). The latter implies that the sensitivity of MRI to small areas of the BBB opening was very good, with the step-down infusion, approaching that of QAR.
Brain swelling (vasogenic edema) distorted the ipsilateral hemisphere, seemingly involved nearly all of the PoA, Str, and PCx in most studies, and caused considerable midline displacement (Figure 2F). The mean volume of swelling was 45 (±30)mm3. In most cases, the area of pallor extended from the PoA through to much of the Str and sometimes included a part of the PCx (Figure 2C and 2F). Vacuolation (cytotoxic edema) was evident at the microscopic level in most of this area (data not shown). The areas of tissue injury as indicated by pallor (110±90mm3) closely matched those of BBB opening (95±90mm3), which were observed in the ARGs but were always larger than the latter (e.g., Figure 2C versus 2B).
Comparison of Transfer Constant Values From Magnetic Resonance Imaging and Quantitative Autoradiography
Similar to the plasma concentration and the AUC, the validity of the estimate of the tissue concentration of Gd-DTPA using MRI was tested against that of Gd-[14C]DTPA using QAR. This was carried out by comparing the terminal tissue–plasma ratios, VR, of Gd-DTPA and Gd-[14C]DTPA. As the amount of both is relatively high in the lesion and has a good signal-to-noise ratio, only the data from the 14 ROIs, and not from the rest of the brain, were used for this exercise.
Before proceeding, three facts regarding the VR calculation need to be noted. First, the MRCA studies were started ~2.5 h after initiating reperfusion, and the QAR part of the experiment was begun ~30 mins later. As the two sets of data were not obtained simultaneously, the BBB permeability and influx may have differed between the two measurements. Second, the Gd-DTPA and the Gd-[14C]DTPA are present in both intravascular and extravascular compartments of the tissue sampled using both techniques. Third, the change in relaxation detected by MRI is that of the protons affected by Gd; the concentration of Gd-DTPA is not measured directly. The mean VR values were slightly higher for Gd-[14C]DTPA than for Gd-DTPA for the three ROIs (Table 2), but none of these differences were statistically significant. In view of these findings and of the three considerations given above, the tissue concentration of the MRCA seems to be fairly accurately measured using our MRI technique.
Table 2.
The mean (±s.d.) terminal brain–plasma distribution ratios (VR; mL/g per ROI) obtained for the three regions of interest (ROIs), i.e., preoptic area (PoA), striatum (Str), and parietal-insular cortex (PCx) by magnetic resonance imaging (MRI) method and quantitative autoradiography (QAR) method
| Method | VR (mL/mL or mL/g) per ROIa
|
||
|---|---|---|---|
| PoA (6) | Str (5) | PCx (3) | |
| MRI (mL/mL) | 0.09±0.02 | 0.07±0.02 | 0.07±0.03 |
| QAR (mL/g) | 0.10±0.3‡ | 0.09±0.03¶ | 0.09±0.04§ |
The sample size (n) is given in parentheses next to the ROI name.
P=0.47;
P=0.25;
P=0.45.
The specific gravity of brain is slightly >1, and VR of MRI and QAR are essentially volume fractions.
For all three ROIs, Patlak plots of the Gd-DTPA were linear for the 20-min experimental duration (see Figure 4, for an example), indicating that the uptake of this MRCAwas functionally unidirectional or irreversible and that the slopes demarcate the influx rate. For the QAR estimation of Ki by the single-time point equation, the backflux of Gd-[14C]DTPA was assumed to be negligible and the Patlak plot data supported it. For all three ROIs, the values of Ki for Gd-[14C]DTPA tended to be higher than those of Gd-DTPA, but were not significantly different (Table 3). It is of relevance that this tendency in the Ki numbers parallels that reported above for VR. The estimates of Ki of Gd-DTPA correlated well with those of Gd-[14C]DTPA (PoA: R2 = 0.95, P = 0.001; Str: R2 = 0.77, P = 0.05). Their generalized estimating equation-predicted R2 values were 0.94 and 0.68, respectively. There were insufficient data from PCx for such analysis. The overall correlation (R2) for all the data combined was 0.64 (generalized estimating equation-predicted R2 being 0.61) with P = 0.001.
Figure 4.

Example of a Patlak plot from a representative animal. The ordinate is the Gd-DTPA concentration in the tissue at time t, (Ct) divided by the plasma concentration at that time [Ca/(1–Hct)], where Ca is the concentration in whole blood within the superior sagittal sinus and Hct the hematocrit. The abscissa is labeled tplot and represents the plasma concentration–time integral up to t divided by [Ca/(1–Hct)] at t. The contralateral points form a straight line with zero slope, indicating no detectable Gd-DTPA leakage. The points for the ipsilateral PoA, PCx, and Str formed straight lines with virtually identical Ki values, around 0.0024 mL/g per min. The y-intercepts represent the volume of rapid distribution of the MRCA-affected protons in plasma (Vp) and in other intravascular compartments (Vo). In this example, Vp+Vo was lowest for the contralateral brain (0.017 mL/g brain) and for Str (0.020 mL/g) and highest for PoA (0.032 mL/g). The plotted points extend along the x-axis, tplot, up to nearly 1,000 secs, which was appreciably less than the real time of the experiment, ~1,200 secs.
Table 3.
The mean (±s.d.) blood-to-brain influx constants (Ki; × 10−3 mL/g per min) obtained for the three regions of interest (ROIs), i.e., preoptic area (PoA), striatum (Str), and parietalinsular cortex (PCx) from magnetic resonance imaging data and Patlak plots (MRI method) and quantitative autoradiographic data and the single-time equation (QAR method)
| Method | Ki (×10−3 mL/g per min)
|
||
|---|---|---|---|
| PoA (6) | Str (5) | PCx (3) | |
| MRI | 3.6±1.3 | 3.3±1.1 | 2.8±1.2 |
| QAR | 4.5±1.2‡ | 3.9±1.3¶ | 3.7±1.3§ |
P=0.15;
P=0.27;
P=0.25.
The sample size (n) is given in parentheses next to the ROI name.
The other parameter obtained by the Patlak plot, Vp +Vo, varied somewhat among the three brain regions. The mean (±s.d.) volume fractions were 0.039 (±0.014; n = 6) for PoA, 0.014 (±0.008; n=5) for Str, and 0.029 (±0.013; n = 3) for PCx. The difference in Vp +Vo was significant between PoA and Str (P < 0.05) but not for any other paired comparison.
Discussion
The purpose of this study was to test the accuracy of MRI estimates of blood and brain concentrations and the blood-to-brain influx rate constant in cerebral ischemia for Gd-DTPA. The plasma concentration–time integral, the terminal tissue-to-plasma ratio, and blood-to-brain influx of Gd-DTPA assayed using MRI were compared with those of its radio-labeled analog, Gd-[14C]DTPA, obtained minutes later using QAR and arterial blood sampling. To the best of our knowledge, this is the first comparative study using virtually identical Gd-analogs and step-down infusion for MRI and QAR.
Despite the difference of ~30 mins between the two measurements, the two different sites of blood sampling, and the dissimilar durations of blood sampling periods, the MRI and QAR points scattered around each other and were fairly close as shown in Figure 1. Thus, the sagittal sinus imaging of venous blood effectively captured the MRI–AIF images from the first comparison.
The quantification of the AUCs was the second comparison. As the Gd[14C]DTPA data produce an accurate measure of the plasma concentration–time curve, the near-perfect agreement between these two normalized AUCs indicates that (1) the step-down procedure produced similar blood–time courses; and (2) these MRI estimates of plasma concentration are quite good. Accordingly, if any significant differences in the Ki values are found between the MRI and QAR estimates, then they are almost certainly not because of dissimilarities between the MRCA concentration in the superior sinus venous blood and the radiotracer in the femoral artery blood. It is of relevance to this that the venous blood in the SSS has passed through the vasculature of the cerebral cortex and through the underlying white matter before being collected by the superficial veins. The decrease in concentration between arterial and SSS blood would be expected to be very small because (1) the SSS blood does not come from the microvascular networks of the circumventricular organs, which are highly permeable; (2) the blood traversing the leaky microvascular systems of the PoA and Str flows into the deep cerebral veins and great veins and not into the SSS; and (3) the small transcapillary loss of MRCA in the tiny ischemia-damaged areas of the PCx (observed in only three experiments) would result in little decrease of concentration in the large volume of blood coming into the sinus from the rest of the cortex and subcortex, including that from the contralateral hemisphere.
The third comparison was based on the terminal tissue–plasma distribution ratio, VR, which was ~20% larger for Gd-[14C]DTPA than for Gd-DTPA. This difference was not statistically significant. The tendency toward higher VR values for Gd-[14C]DTPA may be the result of a small increase in BBB permeability between the time of the MRI and QAR measurements, ~30 mins, resulting in a somewhat higher concentration of radiotracer than MRCA in the interstitium. Certainly, BBB permeability changes during the acute phase of reperfusion, and this may be in play in these experiments, similarly affecting the estimation of both VR and Ki (see below) of Gd-[14C]DTPA.
The models, assumptions, and procedures for calculating Ki vary between MRI–MRCA and QAR–radiotracer procedures. Even though the raw data may be accurate, robust, and essentially identical, differences between the two sets of Ki values can arise because of these variations in the methods of calculation. Patlak plots consist of the MRCA data. They determine the amount of Gd-DTPA-affected protons in the plasma and the reversible compartments, subtract that from the total amount in the tissue, and establish the period of irreversible uptake (i.e., of essentially no backflux). In contrast, the single-time equation is used to calculate Ki from the Gd-[14C]DTPA data. For this calculation, a correction for plasma radioactivity and irreversible uptake is assumed. In this instance, the contralateral brain radioactivity is assumed to provide the vascular space correction, and 20 mins is presupposed to be a period of unidirectional uptake. The assumption of irreversible or unidirectional uptake of more than 20 mins is supported by the Patlak plots, which indicated linearity of Gd-DTPA uptake for this period with the prescribed step-down infusion (Figure 4).
The plasma space correction of the QAR data remains an assumption. It cannot be affirmed by the Vp +Vo defined by the y-intercept of the Patlak plot of MRCA data because that is a proton—not Gd-DTPA—distribution space and is larger than the plasma space, Vp. As is commonly carried out in radiotracer studies, the contralateral brain 14C-activity was assumed to provide the plasma-contained radioactivity correction to the ischemic lesion data for the single-time equation. If this correction is too small, then Ki of Gd-[14C]DTPAwill be overestimated and higher than that of Gd-DTPA. This could account for the difference in Ki values between the two techniques and tracers, but the modestly higher estimates of VR for Gd-[14C]DTPA, reported above and calculated from uncorrected raw data, are a more plausible explanation for this discrepancy.
A final possible cause of the differences in estimates of Ki (and VR) is that the tissue sampling was not the same for the two techniques and tracers. A virtual, coronal tissue slice of 2.0-mm thickness was sampled by MRI. With QAR, a set of 20-μm-thick sections are taken at 400-μm intervals. Accordingly, the data from five of these sets that seem to lie within the 2.0-mm-thick MRI slice are averaged to result in the QAR estimate of radioactivity. Owing to dissimilar tissue sampling by the MRI and QAR techniques, some systematic differences in the determination of Ki are to be expected.
It is important to note that in the one experiment with no tracer leakage, both techniques gave similar results. The absence of enhancement in this case was not because of very low CBF and the consequent limited delivery of Gd-DTPA or Gd-[14C]DTPA. In this rat, after reperfusion of CBF for the PoA, the most commonly and most severely damaged region in these studies was ~40% of the contralateral side, whereas it was ~35% of the contralateral in the 6 rats that showed a BBB damage. The conclusion is that the BBB was intact in this ischemia-damaged tissue.
The other parameter obtained from Patlak plots is the y-intercept, which is a volume fraction, and produces the ‘blood’ subtraction for the calculation of influx rate constant when multiplied by Cp(t). Using the present segmentation procedure, the proton volume fraction is that of plasma water and the reversible compartments within the arteries, arterioles, capillaries, venules, and veins within the ROI. This volume fraction ranged from 0.014 in the Str to 0.039 in the PoA on the ipsilateral side. Sizable signal-to-noise problems on the contralateral side led to rather poor Patlak plots and unacceptable estimates of Vp +Vo in all but five cases. The average value of Vp +Vo estimated from these five good plots was 0.016 (±0.004). All that can be said with these limited results is that the distribution of the protons affected by intravascular Gd-DTPA may be different between the contralateral brain and at least some of the ischemia-damaged tissue.
For normal brain, the Ki of 57Co-DTPAwas reported to be~2.4×10⁻⁵mL/g per min and ~1.4×10⁻⁵mL/g per min for the cortex (Blasberg et al, 1983). In earlier MRI studies of the same model of MCA suture occlusion, reversible cerebral ischemia, the Ki of Gd-DTPA, was found to be 4.1×10⁻³ mL/g per min by Ewing et al, 2003a and 7.3×10⁻³mL/g per min for the Str and 6.5×10⁻³ mL/g per min for the PoA by Knight et al, 2005a. These Ki values for ischemia-damaged BBB and those in Table 3 are more than two orders of magnitude greater than the normal rat ones, but are still in the range relative to blood flow wherein they approximate the permeability–surface area product. As it is not likely that the surface area of the blood vessels (S) in the field of observation could have increased much over the experimental period, the increase in the permeability–surface area product must be mainly because of an increase in vascular permeability (P).
Patlak plots of the step-down infusion data brought out a feature of the abscissa that has not been noted earlier to the best of our knowledge; i.e., the time plotted on the x-axis (tplot) was less than the real time. This happened because the concentration of Gd-DTPA in blood increased rapidly, but not instantly, during the first sampling period (150 secs), and then gradually increased for much of the rest of the experimental period (Figure 1). Using the set of average concentrations of Gd-DTPA in Figure 1, the calculated tplot is 1,149 secs at the end, whereas the real time is 1,200 secs. The blood concentration for the experiment that produced the example Patlak plot (Figure 4) was 60% of the final level for the first sampling period; it rose gradually and reached terminal concentration by the fifth sampling period, and remained constant thereafter. This produced a tplot of 971 secs, which is ~80% of the real time. This could probably be improved by increasing the accuracy of the infusion rate using a programmable pump.
In comparison, with a bolus injection, the concentration increased rapidly at first, reached a peak of ~10 secs, and decreased continuously thereafter. With such data, tplot will be greater than real time. In this situation, tplot has come to be referred to as stretch time or tstretch (Ewing et al, 2003a). With a perfect step increase and maintenance thereafter of this concentration, tplot equals real time. This is nearly the case for the MRCA data plotted in Figure 1, wherein tplot was 96% of real time.
The spatial resolving power of QAR is excellent. Pathophysiological lesions of ~0.5×0.5×0.4mm3 (0.10mm3) can be observed using this approach, and radioactivity assayed therein with accuracy. The results of this study show that the step-down infusion-MRI technique yields images in which relatively small areas of BBB opening within the 2.0-mm coronal slice can be spotted. To illustrate this, a small cortical area of Gd-DTPA leakage is shown in the Ki map of Figure 3A, and this lesion was also observed in the first two sets of ARGs (Figure 3B and 3D) but not in the others. Thus, it spanned less than half of the 2-mm-thick MRI slice and had a volume of ~0.5mm3. An earlier study explored the spatial limits of Gd-DTPA contrast-enhanced MRI after a bolus injection and found that a BBB lesion had to span a major part of the 2.0-mm-thick brain slice for visualization (Knight et al, 2005a). However, it is to be noted that leakage regions were segmented using a different procedure in the former study (Knight et al, 2005a), whereas quantitative F-test-based Patlak maps were used in this study. This segmentation dissimilarity may account for some of the perceived differences in spatial resolution between the two modes of MRCA administration.
In support of this suggestion, BBB openings that were not observed with bolus injections have been detected by constant-rate MRCA infusion during subchronic human stroke (Merten et al, 1999). In addition, we observed greater contrast enhancement in a rat model of acute stroke with a step-down infusion of Gd-DTPA than with a bolus injection (Nagaraja et al, 2007). In this study, both MRCA step-down infusion of more contrast agent and the F-test-based segmentation procedure may have contributed toward the better spatial resolution. If confirmed by further experiments, the step-down infusion technique, in combination with Patlak plots and F-test segmentation of the Ki maps, may become very useful in localizing punctate BBB lesions observed in conditions such as multiple sclerosis and Parkinson’s disease (Correale and Villa 2007; Desai et al, 2007). Despite its potential advantages, the step-down method may, however, be contraindicated in cases in which impaired renal function is observed. Loading the body with Gd-DTPA, which is cleared primarily by the kidneys, is not advisable under these circumstances (Dawson, 2008). Instead, magnetization transfer-based noncontrast magnetic resonance techniques (Ding et al, 2005; Nagaraja et al, 2008a) may be used in such subjects for characterizing BBB dysfunction.
The efficacy of a bolus plus infusion technique that resulted in steady blood tracer levels has been shown in positron emission tomography (Carson et al, 1993; Watabe et al, 2000). Advantages of an increased Gd dose have been shown in characterizing tumors in the past (Ba-Ssalamah et al, 2003; Bruening et al, 2000), but the application of a comparable approach in acute stroke has not been fully explored. To summarize this study, the normalized plasma concentration–time integrals were identical for Gd-DTPA and Gd-[14C]DTPA, indicating that the MRI protocol yielded reliable and comparable estimates of plasma Gd-DTPA levels. Both contrast enhancement of Gd-DTPA (MRI) and leakage of Gd-[14C]DTPA (QAR) were observed in six of the seven rats. Such areas of BBB opening, including the very smallest one, were similar in size and location in the MRI and QAR images. The terminal tissue–plasma ratios of Gd-[14C]DTPA and Gd-DTPA in these areas were well correlated, but the radiotracer ratios tended to be slightly higher than the MRCA ones. The MRI-derived Ki values for Gd-DTPA closely agreed and correlated well with those obtained for Gd-[14C]DTPA by QAR. These findings support the working hypothesis that the MRI estimates of Gd-DTPA concentration in the plasma and brain and of blood-to-brain influx of this MRCAwith a step-down infusion are quantitatively and spatially accurate with this protocol.
Acknowledgments
This work was supported by NIH Grants 1RO1NS38540 and 1RO1HL70023; AHA—Bugher Foundation Award 0270176N & AHA—Scientist Development Grant 0635403N.
We thank J Xu, PAWhitton, S Panda, and KA Keenan for their technical assistance. K Karki thanks Dr Michael Chopp, Department of Neurology, Henry Ford Hospital, for financial support. Parts of the MRI data set have been published (Nagaraja et al, 2007).
Footnotes
Disclosure
The authors state no conflict of interest.
References
- Ba-Ssalamah A, Nobauer-Huhmann IM, Pinker K, Schibany N, Prokesch R, Mehrain S, Mlynarik V, Fog A, Heimberger K, Trattnig S. Effect of contrast dose and field strength in the magnetic resonance detection of brain metastases. Invest Radiol. 2003;38:415–22. doi: 10.1097/01.RLI.0000067488.57101.bd. [DOI] [PubMed] [Google Scholar]
- Blasberg R, Patlak CS, Fenstermacher JD. Selection of experimental conditions for the accurate determination of blood-brain transfer constants from single-time experiments: a theoretical analysis. J Cereb Blood Flow Metab. 1983;3:215–25. doi: 10.1038/jcbfm.1983.29. [DOI] [PubMed] [Google Scholar]
- Bruening R, Berchtenbreiter C, Holzknecht N, Essig M, Wu RH, Simmons A, Heuck A, Maschek A, Meusel M, Williams SC, Cox T, Knopp MV, Reiser M. Effects of three different doses of a bolus injection of gadodiamide: assessment of regional cerebral blood volume maps in a blinded reader study.[see comment] Ajnr Am J Neuroradiol. 2000;21:1603–10. [PMC free article] [PubMed] [Google Scholar]
- Carson RE, Channing MA, Blasberg RG, Dunn BB, Cohen RM, Rice KC, Herscovitch P. Comparison of bolus and infusion methods for receptor quantitation: application to [18F]cyclofoxy and positron emission tomography. J Cereb Blood Flow Metab. 1993;13:24–42. doi: 10.1038/jcbfm.1993.6. [DOI] [PubMed] [Google Scholar]
- Correale J, Villa A. The blood-brain barrier in multiple sclerosis: functional roles and therapeutic targeting. Autoimmunity. 2007;40:148–60. doi: 10.1080/08916930601183522. [DOI] [PubMed] [Google Scholar]
- Crone C. Permeability of capillaries in various organs as determined by use of the indicator diffusion method. Acta Physiol Scand. 1963;58:292–305. doi: 10.1111/j.1748-1716.1963.tb02652.x. [DOI] [PubMed] [Google Scholar]
- Dawson P. Nephrogenic systemic fibrosis: possible mechanisms and imaging management strategies. J Magn Reson Imaging. 2008;28:797–804. doi: 10.1002/jmri.21521. [DOI] [PubMed] [Google Scholar]
- Desai BS, Monahan AJ, Carvey PM, Hendey B. Blood-brain barrier pathology in Alzheimer’s and Parkinson’s disease: implications for drug therapy. Cell Transplant. 2007;16:285–99. doi: 10.3727/000000007783464731. [DOI] [PubMed] [Google Scholar]
- Ding G, Nagesh V, Jiang Q, Zhang L, Zhang ZG, Li L, Knight RA, Li Q, Ewing JR, Chopp M. Early prediction of gross hemorrhagic transformation by noncontrast agent MRI cluster analysis after embolic stroke in rat. Stroke. 2005;36:1247–52. doi: 10.1161/01.STR.0000166199.10017.c5. [DOI] [PubMed] [Google Scholar]
- Elster AD, Moody DM. Early cerebral infarction: gadopentedate dimeglumine enhancement. Radiology. 1990;177:627–32. doi: 10.1148/radiology.177.3.2243961. [DOI] [PubMed] [Google Scholar]
- Esser M, von Kummer R, Egelhof T, Winter R, Sartor K. Vascular MR contrast enhancement in cerebrovascular disease. Ajnr Am J Neuroradiol. 1996;17:887–94. [PMC free article] [PubMed] [Google Scholar]
- Ewing JR, Knight RA, Nagaraja TN, Yee JS, Nagesh V, Whitton PA, Li L, Fenstermacher JD. Patlak plots of Gd-DTPA MRI data yield blood-brain transfer constants concordant with those of 14C-sucrose in areas of blood-brain opening. Magn Reson Med. 2003a;50:283–92. doi: 10.1002/mrm.10524. [DOI] [PubMed] [Google Scholar]
- Ewing JR, Wei L, Knight RA, Pawa S, Nagaraja TN, Brusca T, Divine GW, Fenstermacher JD. Direct comparison of local cerebral blood flow rates measured by MRI arterial spin-tagging and quantitative autoradiography in a rat model of experimental cerebral ischemia. J Cereb Blood Flow Metab. 2003b;23:198–209. doi: 10.1097/01.WCB.0000046147.31247.E8. [DOI] [PubMed] [Google Scholar]
- Ewing JR, Brown SL, Lu M, Panda S, Ding G, Knight RA, Cao Y, Jiang Q, Nagaraja TN, Churchman JL, Fenstermacher JD. Model selection in magnetic resonance imaging measurements of vascular permeability: gadomer in a 9L model of rat cerebral tumor. J Cereb Blood Flow Metab. 2006;26:310–20. doi: 10.1038/sj.jcbfm.9600189. [DOI] [PubMed] [Google Scholar]
- Fagan SC, Nagaraja TN, Fenstermacher JD, Zheng J, Johnson M, Knight RA. Hemorrhagic transformation is related to the duration of occlusion and treatment with tissue plasminogen activator in a non-embolic stroke model. Neurol Res. 2003;25:377–82. doi: 10.1179/016164103101201526. [DOI] [PubMed] [Google Scholar]
- Ferrier MC, Sarin H, Fung SH, Schatlo B, Pluta RM, Gupta SN, Choyke PL, Oldfield EH, Thomasson D, Butman JA. Validation of dynamic contrast-enhanced magnetic resonance imaging-derived vascular permeability measurements using quantitative autoradiography in the RG2 rat brain tumor model. Neoplasia. 2007;9:546–55. doi: 10.1593/neo.07289. [DOI] [PMC free article] [PubMed] [Google Scholar]
- Hamann GF, del Zoppo GJ, von Kummer R. Hemorrhagic transformation of cerebral infarction–possible mechanisms. Thromb Haemost. 1999;82(Suppl 1):92–4. [PubMed] [Google Scholar]
- Hjort N, Wu O, Ashkanian M, Solling C, Mouridsen K, Christensen S, Gyldensted C, Andersen G, Ostergaard L. MRI detection of early blood-brain barrier disruption: parenchymal enhancement predicts focal hemorrhagic transformation after thrombolysis. Stroke. 2008;39:1025–8. doi: 10.1161/STROKEAHA.107.497719. [DOI] [PubMed] [Google Scholar]
- Kenney J, Schmiedl U, Maravilla K, Starr F, Graham M, Spence A, Nelson J. Measurement of blood-brain barrier permeability in a tumor model using magnetic resonance imaging with gadolinium-DTPA. Magn Reson Med. 1992;27:68–75. doi: 10.1002/mrm.1910270108. [DOI] [PubMed] [Google Scholar]
- Knight RA, Barker PB, Fagan SC, Li Y, Jacobs MA, Welch KM. Prediction of impending hemorrhagic transformation in ischemic stroke using magnetic resonance imaging in rats. Stroke. 1998;29:144–51. doi: 10.1161/01.str.29.1.144. [DOI] [PubMed] [Google Scholar]
- Knight RA, Nagaraja TN, Ewing JR, Nagesh V, Whitton PA, Bershad E, Fagan SC, Fenstermacher JD. Quantitation and localization of blood-to-brain influx by MRI and quantitative autoradiography in a model of transient focal ischemia. Magn Reson Med. 2005a;54:813–21. doi: 10.1002/mrm.20629. [DOI] [PubMed] [Google Scholar]
- Knight RA, Nagesh V, Nagaraja TN, Ewing JR, Whitton PA, Bershad E, Fagan SC, Fenstermacher JD. Acute BBB opening in experimentally induced focal cerebral ischemia is preferentially identified by quantitative magnetization transfer imaging. Magn Reson Med. 2005b;54:822–32. doi: 10.1002/mrm.20630. [DOI] [PubMed] [Google Scholar]
- Larsson HBW, Stubgaard M, Frederiksen JL, Jensen M, Henriksen O, Paulson OB. Quantitation of blood-brain barrier defect by magnetic resonance imaging and gadolinium-DTPA in patients with multiple sclerosis and brain tumors. Magn Reson Med. 1990;16:117–31. doi: 10.1002/mrm.1910160111. [DOI] [PubMed] [Google Scholar]
- Merten CL, Knitelius HO, Assheuer J, Bergmann-Kurz B, Hedde JP, Bewermeyer H. MRI of acute cerebral infarcts: increased contrast enhancement with continuous infusion of gadolinium. Neuroradiology. 1999;41:242–8. doi: 10.1007/s002340050740. [DOI] [PubMed] [Google Scholar]
- Montgomery DC, Peck EA. Introduction to linear regression analysis. New York, NY: John Wiley & Sons, Inc; 1992. p. 449. [Google Scholar]
- Nagaraja TN, Patel P, Gorski M, Gorevic PD, Patlak CS, Fenstermacher JD. In normal rat, intraventricularly administered insulin-like growth factor-1 is rapidly cleared from CSF with limited distribution into brain. Cerebrospinal Fluid Res. 2005;2:5–19. doi: 10.1186/1743-8454-2-5. [DOI] [PMC free article] [PubMed] [Google Scholar]
- Nagaraja TN, Nagesh V, Ewing JR, Whitton PA, Fenstermacher JD, Knight RA. Step-down infusions of Gd-DTPA yield greater contrast-enhanced magnetic resonance images of BBB damage in acute stroke than bolus injections. Magn Reson Imaging. 2007;25:311–8. doi: 10.1016/j.mri.2006.09.003. [DOI] [PMC free article] [PubMed] [Google Scholar]
- Nagaraja TN, Karki K, Ewing JR, Croxen RL, Knight RA. Identification of variations in blood-brain barrier opening after cerebral ischemia by dual contrast-enhanced magnetic resonance imaging and T1sat measurements. Stroke. 2008a;39:427–32. doi: 10.1161/STROKEAHA.107.496059. [DOI] [PubMed] [Google Scholar]
- Nagaraja TN, Keenan KA, Fenstermacher JD, Knight RA. Acute leakage patterns of fluorescent plasma flow markers after transient focal cerebral ischemia suggest large openings in blood-brain barrier. Microcirculation. 2008b;14:1–14. doi: 10.1080/10739680701409811. [DOI] [PubMed] [Google Scholar]
- Niendorf HP, Felix R, Laniado M, Schorner W, Claussen C, Wienmann H-J. Gadolinium-DTPA: a new contrast agent for magnetic resonance imaging. Radiat Med. 1985;3:7–12. [PubMed] [Google Scholar]
- Patlak CS, Pettigrew KD. A method to obtain infusion schedules for prescribed blood concentration time courses. J Appl Physiol. 1976;40:458–63. doi: 10.1152/jappl.1976.40.3.458. [DOI] [PubMed] [Google Scholar]
- Patlak CS, Blasberg RG, Fenstermacher JD. Graphical evaluation of blood-to-brain transfer constants from multiple-time uptake data. J Cereb Blood Flow Metab. 1983;3:1–7. doi: 10.1038/jcbfm.1983.1. [DOI] [PubMed] [Google Scholar]
- Preston E, Foster DO. Diffusion into rat brain of contrast and shift reagents for magnetic resonance imaging and spectroscopy. NMR Biomed. 1993;6:339–44. doi: 10.1002/nbm.1940060510. [DOI] [PubMed] [Google Scholar]
- Renkin EM. Transport of potassium-42 from blood to tissue in isolated mammalian skeletal muscles. Am J Physiol. 1959;197:1205–10. doi: 10.1152/ajplegacy.1959.197.6.1205. [DOI] [PubMed] [Google Scholar]
- Strich G, Hagan PL, Gerber KH, Slutsky RA. Tissue distribution and magnetic resonance spin lattice relaxation effects of gadolinium-DTPA. Radiology. 1985;154:723–6. doi: 10.1148/radiology.154.3.3969477. [DOI] [PubMed] [Google Scholar]
- Tofts PS, Kermode AG. Measurement of the blood-brain barrier permeability and leakage space using dynamic MR imaging. 1. Fundamental concepts. Magn Reson Med. 1991;17:357–67. doi: 10.1002/mrm.1910170208. [DOI] [PubMed] [Google Scholar]
- Virapongse C, Mancuso A, Quisling R. Human brain infarcts: Gd-DTPA-enhanced MR imaging. Radiology. 1986;161:785–94. doi: 10.1148/radiology.161.3.3786734. [DOI] [PubMed] [Google Scholar]
- Warach S, Latour LL. Evidence of reperfusion injury, exacerbated by thrombolytic therapy, in human focal brain ischemia using a novel imaging marker of early blood-brain barrier disruption. Stroke. 2004;35(Suppl 1):2659–61. doi: 10.1161/01.STR.0000144051.32131.09. [DOI] [PubMed] [Google Scholar]
- Watabe H, Endres CJ, Breier A, Schmall B, Eckelman WC, Carson RE. Measurement of dopamine release with continuous infusion of [11C]raclopride: optimization and signal-to-noise considerations. J Nucl Med. 2000;41:522–30. [PubMed] [Google Scholar]
- Weinmann H-J, Brasch RC, Press W-R, Wesbey GE. Characteristics of gadolinium-DTPA complex: a potential NMR contrast agent. Am J Radiol. 1984;142:619–24. doi: 10.2214/ajr.142.3.619. [DOI] [PubMed] [Google Scholar]