

Abstract
Acyl-CoA:cholesterol acyltransferase 1 (ACAT1) is a resident endoplasmic reticulum enzyme that prevents the buildup of cholesterol in membranes by converting it to cholesterol esters. Blocking ACAT1 pharmacologically or by Acat1 gene knock-out (KO) decreases amyloidopathy in mouse models for Alzheimer's disease. However, the beneficial actions of ACAT1 blockage to treat Alzheimer's disease remained not well understood. Microglia play essential roles in the proteolytic clearance of amyloid β (Aβ) peptides. Here we show that Acat1 gene KO in mouse increases phagocytic uptake of oligomeric Aβ1–42 and stimulates lysosomal Aβ1–42 degradation in cultured microglia and in vivo. Additional results show that Acat1 gene KO or a specific ACAT1 inhibitor K604 stimulates autophagosome formation and transcription factor EB-mediated lysosomal proteolysis. Surprisingly, the effect of ACAT1 blockage does not alter mTOR signaling or endoplasmic reticulum stress response but can be modulated by agents that disrupt cholesterol biosynthesis. To our knowledge, our current study provides the first example that a small molecule (K604) can promote autophagy in an mTOR-independent manner to activate the coordinated lysosomal expression and regulation network. Autophagy is needed to degrade misfolded proteins/peptides. Our results implicate that blocking ACAT1 may provide a new way to benefit multiple neurodegenerative diseases.
Keywords: ACAT, Alzheimer's disease, autophagy, cholesterol, microglia
Introduction
Alzheimer's disease (AD) is the most common form of dementia in the aging population. In AD, an important biochemical characteristic is the extracellular accumulation of amyloid β (Aβ), especially Aβ1–42, to form the insoluble, amyloid plaques in the brain. Aβ is produced from the amyloid precursor protein (APP) by sequential proteolytic cleavages (Masters and Selkoe, 2012). Recent evidence implicates that the size of the amyloid plaques, which mainly consist of aggregates of fibrillar form of Aβ, does not correlate well with degree of neurodegeneration or severity of dementia in AD (Lublin and Gandy, 2010). Instead, the oligomeric forms of Aβ, which are intermediate forms between the monomeric and the fibrillar forms, have been suggested to be the most toxic molecular species that causes synaptic loss (Shankar et al., 2008; Koffie et al., 2009).
Macroautophagy (hereafter referred to as autophagy) is a conserved lysosomal degradation process that begins with sequestration of certain cytoplasmic content with a double-membrane structure, followed by formation of an autophagosome (Mizushima, 2007). Autophagosomes fuse with lysosomes to degrade sequestered cytoplasmic contents, including denatured and/or aggregation-prone proteins/peptides, such as Aβ (Mizushima et al., 2008). Autophagosome formation can be induced by inhibition of the mammalian target of rapamycin (mTOR) (Mizushima, 2007). Inhibition of mTOR signaling also upregulates lysosome biogenesis and leads to efficient autophagosome–lysosome fusions (Zhou et al., 2013). The transcription factor EB (TFEB), a newly discovered master regulator of lysosomal protein biogenesis (Sardiello et al., 2009), coordinates these two processes by activating the autophagic machinery and by increasing the expressions of lysosome-specific genes (Settembre et al., 2011; Zhou et al., 2013). In mouse models of AD, studies have shown that blocking mTOR by rapamycin administration increases autophagy in the brain, reduces Aβ1–42 levels, and rescues cognitive deficits (Caccamo et al., 2010; Spilman et al., 2010).
Acyl-CoA:cholesterol acyltransferase (ACAT) converts free cholesterol to cholesterol esters and plays important roles in cellular cholesterol homeostasis. There are two ACAT isoforms in mammals (ACAT1 and ACAT2) with different tissue expression patterns (Chang et al., 2009). ACAT1 is a resident enzyme at the endoplasmic reticulum (ER) and is ubiquitously expressed in all tissues examined; ACAT2 is mainly expressed in the intestines and hepatocytes, and it is also expressed in various other tissues at low levels (Chang et al., 2009).
Previous work from this and other laboratories showed that blocking ACAT1 decreases amyloidopathy in cell culture and in mouse models for AD (Puglielli et al., 2001; Hutter-Paier et al., 2004; Bryleva et al., 2010; Huttunen et al., 2010; Bhattacharyya et al., 2013; Murphy et al., 2013). These studies suggest the potential therapeutic use of ACAT1 blockage to treat AD. However, the beneficial actions of blocking ACAT1 to treat AD remained not well understood. Microglia are resident phagocytes in the brain and play important roles in the clearance of Aβ (Lee and Landreth, 2010). In the current work, we tested the hypothesis that ACAT1 inhibition may increase Aβ1–42 degradation in cultured microglia as well as in vivo, and report our findings.
Materials and Methods
Mice.
Acat1 knock-out (KO) and Acat1-M/-M mice on C57BL/6 genetic background were described previously (Meiner et al., 1996 and L.-H.H. et al., unpublished observations, respectively). The 3XTg-AD/A1+ and 3XTg-AD/A1− mouse lines on a mixed 129:C57BL/6 genetic background were described previously (Bryleva et al., 2010). The CX3CR1/GFP+/+ mouse (Jung et al., 2000) was a gift from Dr. Brent Berwin (Geisel School of Medicine at Dartmouth). All mouse procedures were approved by Dartmouth Institutional Animal Care and Use Committee.
Antibodies.
Rabbit anti-ACAT1 (DM10) was reported previously (Chang et al., 1995). Mouse anti-human amyloid β (6E10) was from Covance. Rabbit anti-LAMP1 and mouse anti-p62/SQSTM1 were from Abcam. Rabbit anti-CatB and rabbit anti-Atg5 were from Millipore. Mouse anti-β tubulin was from GenScript. Rabbit anti-LC3 (for Western blot), rabbit anti-TFEB, and rabbit anti-ABCA1 were from Novus. Rabbit anti-LC3 (for immunofluorescence), rabbit anti-p70S6K, rabbit anti-phosho-p70S6K (Ser371), rabbit anti-phosho-p70S6K (Thr389), rabbit anti-4E-BP, and rabbit anti-phospho 4E-BP (Thr37/46) were from Cell Signaling Technology. Mouse anti-β actin was from Sigma.
Cell culture.
N9 microglial cells (gift from Dr. William Hickey, Geisel School of Medicine at Dartmouth) were maintained in RPMI-1640 with 10% FBS at 37°C with 5% CO2 in a humidified incubator. Primary microglia with ∼98% purity were maintained in DMEM/F-12 (50:50) at 37°C; they were prepared from mixed glial cultures isolated from mouse brains at postnatal day 0–3 as described previously (Saura et al., 2003). Neurons and astrocytes with ∼90%-95% purity were isolated from neonatal mice as described previously (Brewer, 1997; Fagan et al., 1999).
Preparation of oligomeric Aβ.
Oligomeric Aβ1–42 was prepared as described previously (Stine et al., 2003) with minor modification: Opti-MEM instead of F-12 was used to prepare the peptide solution. Conjugation of Aβ1–42 to Cy3 was performed as previously described (Jungbauer et al., 2009) by using Cy3 Mono-Reactive Dye Pack (GE Healthcare Life Sciences) according to the manufacturer's protocol.
Aβ clearance in microglia.
N9 cells or primary microglia were plated in 12 well plates at a density of 150,000 cells/well in appropriate medium. On the next day, cell were washed twice with PBS and then incubated with 0.5 μm of oligomeric Aβ1–42 in serum-free medium containing 10 μg/ml BSA at 37°C for indicated times. At the end of each time point, the conditioned media were collected, centrifuged at 1000 × g for 10 min to remove cell debris, and concentrated by precipitation with trichloroacetic acid (20% final concentration). The resulting proteins were redissolved and separated on a 16% tricine gel (Schägger, 2006). The oligomeric Aβs (monomers, dimers, trimers, and tetramers) were analyzed by Western blot and quantified by using ImageJ software. After media removal, cells were washed three times with PBS, lysed in 1% SDS with protease inhibitors, and analyzed for Aβ1–42 levels by ELISA.
Pulse-chase assay to monitor Aβ degradation.
Primary microglia were grown overnight in 12 well plates at a density of 150,000 cells/well in microglia medium. Cells were washed twice with PBS and incubated with 0.5 μm of oligomeric Aβ1–42 in serum-free DMEM/F-12 (50:50) medium containing 10 μg/ml BSA for 30 min. After washing three times with PBS, cells were incubated in DMEM/F-12 (50:50) at 37°C. Cells were preincubated with or without inhibitors as indicated for 90 min before exposure to oligomeric Aβ. At the indicated time, cells were washed twice with PBS, lysed in 1% SDS with protease inhibitors, and analyzed for Aβ1–42 levels by ELISA.
Isolation of microglia from adult mouse brains.
Microglia cells were isolated from adult mouse brains using CD11b MicroBeads (Miltenyi Biotec) as described previously (Nikodemova and Watters, 2012). The CX3CR1/GFP+/+ mice were used to examine the purity of microglia; GFP expression within the CNS of this mouse line is almost exclusively in microglia (Jung et al., 2000).
Stereotaxic injection of Aβ into mouse brains.
Brain surgery was performed as described previously (Murphy et al., 2013) with minor modifications. Female mice (7–8-weeks of age) were anesthetized with Avertin (250 mg/kg, i.p.) and a stainless steel needle (30 G, Hamilton) was stereotaxically inserted into the dentate gyrus of the hippocampus using the following coordinates from bregma: −2.2 mm anterior, 1.4 mm lateral, and 2.1 mm depth. A total of 1 μl of oligomeric Aβ1–42 (0.22 μg/μl) was manually injected into the hippocampus at a rate of 0.5 μl/min, and the needle was left in place for an additional 2 min at the end of injection. Ketoprofen (5 mg/kg) was used for postoperative analgesia. At the indicated time point, mice were killed, and the hippocampi and other parts of the brains were isolated and immediately snap-frozen in liquid nitrogen and stored at −80°C until analysis.
Preparation of brain extracts.
Brain extracts were prepared as described previously (Kawarabayashi et al., 2001). Briefly, frozen brains were suspended in 2% SDS with 1% protein inhibitor mixture (Sigma) and 1 mm PMSF (Sigma). Brains were homogenized at 4°C in the Bullet Blender (Next Advance) with stainless steel beads. Homogenates were centrifuged at 100,000 × g for 1 h at 4°C, and the supernatants (detergent soluble fraction) were stored at −20°C. The pellets were resuspended in 70% formic acid (FA) in water, homogenized in the Bullet Blender, and centrifuged as described above. The supernatants (FA fraction) were stored at −20°C. Detergent-soluble fractions and FA fractions were analyzed using ELISA. FA fractions were neutralized by 1:20 dilution into 1 m Tris phosphate buffer, pH 11, before ELISA.
ELISA.
Aβ1–42 levels were examined using human Aβ1–42 ELISA kit (Wako) following the manufacturer's instruction. Samples were diluted 35- to 100-fold before loading onto the ELISA plate. Results were normalized by total protein present in each sample.
Aβ uptake in microglia.
Microglia were incubated with 0.5 μm Cy3-Aβ1–42 in serum-free media containing 10 μg/ml BSA for the indicated time. For inhibitor treatment, cells were preincubated with 400 μg/ml fucoidan (Sigma) for 1 h or 0.5 μm K604 (Kowa) for 8 h. Cells were then incubated with Cy3-Aβ1–42 in the presence of the inhibitor(s) for 3 h. After incubation, cells were washed twice with prewarmed PBS, and once with prewarmed medium, and harvested for flow cytometry analysis.
LysoTracker staining with or without treatment with cholesterol modulation agents.
N9 cells or primary microglia were pretreated for time as indicated with the following inhibitors: 1 μm squalene synthase inhibitor CP-340868 (Pfizer), 31.25 μm cholesterol/250 μm methyl-β-cyclodextrin complex (Christian et al., 1997), 50 μm lovastatin (Merck), and 230 μm mevalonate. Cells were then incubated with 50 nm LysoTracker for 30 min in the presence of inhibitor(s), washed twice with PBS, and subjected to flow cytometry analysis.
Flow cytometry.
Experiments were performed by using a BD FACSCanto (BD Biosciences). Dead cells were excluded from analyses by propidium iodide staining. Data were analyzed using FlowJo software (Tree Star).
Immunofluorescence microscopy.
Cells were grown overnight on poly-d-lysine-coated glass coverslips in 6 well plates at a density of 150,000–300,000 cells/well. Cells were washed with PBS and fixed with 4% PFA for 15 min at room temperature. For LC3 staining, cells were fixed with 100% methanol for 15 min at −20°C. Cells were then washed three times with PBS, incubated for 60 min at room temperature in blocking buffer (3% BSA and 0.3% Triton in PBS), and incubated overnight at 4°C with various primary antibodies in blocking buffer, then washed three times with PBS and incubated with AlexaFluor dye-conjugated secondary antibodies for 1 h at room temperature. Afterward, cells were washed three times with PBS, rinsed with double-distilled water, and mounted on glass slides with a drop of ProLong Gold antifade reagent with DAPI (Invitrogen). Confocal images were obtained using a Zeiss LSM 510 confocal microscope with a 63× objective. Image analysis was performed using ImageJ software.
Transfection of siRNAs.
N9 cells were grown in 6 well plates to ∼50% confluence and transfected with 10 nm of the siRNAs as indicated (Ambion, Silencer Select predesigned siRNA; Atg5: ID #s62452, TFEB: ID #s74859, Control: Negative control NO. 1) using Lipofectamine RNAiMAX (Invitrogen). Subsequent experiments were performed 72 h after transfection.
RNA isolation and qPCR.
Total RNAs were isolated by using the RNeasy Mini kit (QIAGEN) or TRIzol reagent (Invitrogen) according to the manufacturer's instructions. A total of 1 μg of total RNA was reverse-transcribed using SuperScript III reverse transcriptase (Invitrogen) to prepare cDNA. qPCR was performed by using iTaq Universal SYBR Green Supermix (Bio-Rad). The following cycles were performed: an initial denaturation cycle of 94°C for 5 min, followed by 40 amplification cycles of 94°C for 15 s and 60°C for 1 min. Relative quantification was determined using ΔΔCT method. The mRNA expression values were normalized with HPRT or β-actin mRNA level. The following primers were used: CatB forward, 5′-GAAGCCATTTCTGACCGAAC-3′, CatB reverse, 5′-CACCTGAAACCAGGCCTTT-3′; CatD forward, 5′-CATGCAGTCATCGCCTAAGA-3′, CatD reverse, 5′-AGGGGACCCACAGGTTAGAG-3′; LAMP1 forward, 5′-TAGTGCCCACATTCAGCATCTCCA-3′, LAMP1 reverse, 5′-TCCTGCCAATGAGGTAGGCAATGA-3′; LAMP2 forward, 5′-CCATTGGATGTCATCTTTAAGTGC-3′, LAMP2 reverse, 5′-GTTGAAAGCTGAGCCATTAG-3′; hexosaminidase A (HEXA) forward, 5′-GGCCCTGACTGGAAGGACAT-3′, HEXA reverse, 5′-TGGTGCTGTCCACATACTCTCC-3′; ABCA7 forward, 5′-GCCAGTATGGAATCCCTGAA-3′, ABCA7 reverse, 5′-ATGGAGACACCAGGAACCAG-3′; CD36 forward, 5′-GAACCACTGCTTTCAAAAACTGG-3′, CD36 reverse, 5′-TGCTGTTCTTTGCCACGTCA-3′; SRA forward, 5′-TGAACGAGAGGATGCTGACTG-3′, SRA reverse, 5′-GGAGGGGCCATTTTTAGTGC-3′; HPRT forward, 5′-TTGCTCGAGATGTCATGAAGGA-3′, HPRT reverse, 5′-AGCAGGTCAGCAAAGAACTTATAGC-3′; and β-actin forward, 5′-CAACGAGCGGTTCCGAT-3′, β-actin reverse, 5′-GCCACAGGATTCCATACCCA-3′.
Cellular cholesterol/cholesterol ester analysis.
Cellular lipids were extracted as previously described (Chang and Chang, 1986) from monolayers of cells grown in 6 well dishes. Cellular cholesterol/cholesterol ester levels were determined as follows. Pencil-size columns were made by adding silica gels (70–230 mesh; Sigma) to glass wool-fritted 9 inch Pasteur pipettes to half full; each column was washed with 5 ml of hexane. Each lipid sample was dissolved in 2 ml of hexane and loaded onto a column. After collecting the flow through (fraction 1), each column was eluted with 5 ml of hexane (fraction 2), followed by 5 ml of methylene chloride (fraction 3). Control experiments indicated that the combined fractions 1 and 2 contained essentially all the cholesterol ester loaded, whereas fraction 3 contained essentially all the unesterified cholesterol (free cholesterol) loaded. The fractions were dried down under nitrogen, redissolved in ethyl acetate, and loaded onto a 96 well plate. The plate was heated at 37°C for 1 h to remove ethyl acetate; 20 μl isopropyl alcohol was added per well. Cholesterol content was determined using Wako Free cholesterol E kit (Wako) according to the manufacturer's protocol. For cholesterol ester fractions, cholesterol esterase (Sigma) was added to the Wako kit reagent at 0.1 unit per well to cause complete hydrolysis of cholesterol ester (Heider and Boyett, 1978). Total cholesterol values were obtained by adding the free cholesterol values and cholesterol ester values.
ACAT activity assay in intact cells.
ACAT activity assay in intact cells was performed as previously described (Chang and Chang, 1986). The incubation time with [3H]-oleate-BSA was 2.5 h.
ER stress analysis.
The primers and PCR conditions used for ER stress analysis were performed as previously described (Murakami et al., 2009).
Statistical analysis.
All statistical analysis was performed using Prism4 software (GraphPad). A two-tailed Student's t test was used when two values were compared. For multiple comparisons, a one-way ANOVA with a Turkey's post test was used. The α level used was <0.05. Error bars indicate SEM.
Results
A1 KO in microglia causes an increase in Aβ uptake
To examine whether ACAT1 inhibition increases Aβ clearance in microglia, we first isolated primary microglia from neonatal wild-type (WT) and Acat1−/− (A1 KO) mice, performed ACAT1 biochemical analysis, and showed that the ACAT1 protein was absent and ACAT activity was dramatically reduced in A1 KO microglia (Fig. 1A). We next incubated WT or A1 KO microglia with Aβ1–42 oligomers for up to 18 h and monitored residual Aβ1–42 levels present in the media by Western blot. The results showed that the Aβ1–42 levels in A1 KO microglia-conditioned media were significantly lower (by 53% at 12 h and by 68% at 18 h, respectively; Fig. 1B,C).
Figure 1.

A1 KO in microglia caused an increase in Aβ1–42 clearance. A, Microglia were isolated from neonatal wild-type (WT) or Acat1−/− knock-out (A1 KO) mice. ACAT1 protein and activity were analyzed by Western blot and by ACAT activity assay, respectively. In ACAT activity assay, cells were preincubated with or without 1 μm of the ACAT1-specific inhibitor K604 for 24 h. Data are mean ± SEM of two experiments. ***p < 0.001. n.s., Not significant. B, C, G, WT or A1 KO microglia were incubated with 0.5 μm Aβ1–42 for the indicated time. B, The remaining Aβ1–42 in the media was separated by tricine-SDS-PAGE and analyzed by Western blot. Representative blot is shown. C, Oligomeric Aβ1–42 levels (monomer + dimer + trimer + tetramer) in the media were quantified with ImageJ software. Data are mean ± SEM of four experiments. **p < 0.01. ***p < 0.001. D, Aβ1–42 was conjugated to Cy3 dye as described in Materials and Methods. The Cy3-labeled Aβ1–42 (Cy3-Aβ1–42) and unlabeled Aβ1–42 were separated by tricine-SDS-PAGE and analyzed by Western blot. E, WT or A1 microglia were incubated with 0.5 μm Cy3-Aβ1–42 for the indicated time. Cells were washed several times, and intracellular Aβ1–42 levels were analyzed by flow cytometry. Data are mean ± SEM of five experiments. *p < 0.05. F, Expression levels of ABCA7, CD36, and SRA were examined in WT and A1 KO microglia by quantitative PCR (qPCR). Data are mean ± SEM of three experiments. n.s., Not significant. G, WT or A1 microglia were pretreated with 400 μg/ml of fucoidan for 1 h and then incubated with 0.5 μm of Cy3-Aβ1–42 for 3 h in the presence of the same inhibitor. Cells were washed several times, and intracellular Cy3-Aβ1–42 levels were analyzed by flow cytometry. Data are mean ± SEM of four experiments. **p < 0.01. H, Intracellular Aβ1–42 levels in WT and A1 KO microglia at the indicated time point were analyzed by ELISA. Data are mean ± SEM of three experiments. *p < 0.05. **p < 0.01.
Next we tested the possibility that A1 KO microglia take up more Aβ1–42 than WT microglia. To monitor Aβ internalization, we first prepared Cy3-conjugated Aβ1–42 (Cy3-Aβ1–42) (Jungbauer et al., 2009). After conjugation, we showed that, similar to unlabeled oligomeric Aβ1–42, Cy3-Aβ1–42 contained mainly Aβ1–42- monomers, trimers, and tetramers (Fig. 1D). We next incubated WT or A1 KO microglia with Cy3-Aβ1–42 for 3 h and monitored uptake of Cy3-Aβ1–42 by flow cytometry. The results showed that the intracellular Cy3-Aβ1–42 levels in A1 KO microglia were 22% higher than that found in WT microglia (Fig. 1E). In a mouse model for AD, the ATP-binding cassette transporter ABCA7 has been shown to positively regulate phagocytosis of Aβ (Kim et al., 2013). In cultured cells, ABCA7 can mediate the transport of phospholipids and/or cholesterol to various apolipoproteins (Abe-Dohmae et al., 2004), and the ABCA7 mRNA levels are regulated by cellular cholesterol (Iwamoto et al., 2006). Because ACAT1 affects cellular cholesterol homeostasis, it is possible that A1 KO may increase ABCA7 mRNA level in microglia. To test this possibility, we performed quantitative PCR (qPCR) and found that WT and A1 KO microglia expressed ABCA7 mRNAs at very similar levels (Fig. 1F). Scavenger receptors, including scavenger receptor A (SRA) and CD36 (which is a member of the class B scavenger receptor family), are expressed in microglia and are involved in binding and/or phagocytosis of Aβ in cell culture and in vivo (Yang et al., 2011; Yamanaka et al., 2012). We assessed the mRNA levels of SRA and CD36 in WT and A1 KO microglia and found that A1 KO did not alter the expression levels of these scavenger receptors (Fig. 1F). However, interestingly, treating microglia with fucoidan, a broad-based inhibitor of several scavenger receptors (Yang et al., 2011; Frenkel et al., 2013), significantly inhibited the uptake of Cy3-Aβ1–42, and the amounts of Cy3-Aβ1–42 present in WT and A1 KO microglia became very similar (Fig. 1G). These results suggest that A1 KO may increase the intracellular recycling of SRA and/or CD36; it is also possible that A1 KO may affect other types of scavenger receptors involved in Aβ uptake in microglia.
To validate findings obtained by using Cy3-labeled Aβ1–42, we incubated WT and A1 KO microglia with unlabeled oligomeric Aβ1–42 for up to 18 h and analyzed the intracellular levels of Aβ1–42 by ELISA. The result showed that, at 3, 6, and 12 h, increased intracellular levels of Aβ1–42 were present in A1 KO microglia (Fig. 1H).
A1 KO in microglia increases intracellular Aβ1–42 degradation in lysosomes
The result presented in Figure 1H showed that, at 18 h after incubation with oligomeric Aβ1–42, similar residual amounts of intracellular Aβ1–42 were present in WT and A1 KO microglia. This observation led us to hypothesize that intracellular degradation of Aβ1–42 is increased in A1 KO microglia. Microglia degrade oligomeric Aβ within the late endosomes/lysosomes (LE/LS) (Yang et al., 2011). To test this hypothesis, we first monitored the fate of internalized Aβ1–42 in microglia by examining the cellular localization of fluorescently labeled Cy3-Aβ1–42 with immunofluorescence microscopy. We incubated WT or A1 KO microglia with Cy3-Aβ1–42 for 3 h and visualized Aβ1–42 by monitoring Cy3, and visualized LE/LS with anti-LAMP1 antibody. The results showed that ∼70% of internalized Cy3-Aβ1–42 colocalized with the LE/LS (Fig. 2A), suggesting that, within this time period, internalized Cy3-Aβ1–42 is mainly transported to the LE/LS. We also noted that, when incubated within 1 h, WT and A1 KO microglia internalized comparable levels of Aβ1–42 as shown in Figure 1E. Based on these observations, we designed pulse-chase experiments, as outlined in Figure 2B, to test the possibility that A1 KO increases degradation of oligomeric Aβ. We incubated primary microglia with oligomeric Aβ1–42 for 30 min and then washed the cells extensively to remove the remaining Aβ1–42 in the media. After washing, the intracellular Aβ1–42 levels were measured at various chase times by ELISA. The results showed that, after 6 and 9 h chase time, levels of intracellular Aβ1–42 were ∼50% lower in A1 KO microglia than those in WT microglia (Fig. 2C), suggesting that A1 KO microglia have an increased capacity to degrade Aβ1–42 intracellularly. To test the possibility we performed the pulse-chase experiment in the presence or absence of several inhibitors for lysosomal proteolysis. Bafilomycin A1 (Baf) is a cell-permeable specific inhibitor of vacuolar-type H (+)-ATPase; when added to cells, it inhibits acidification and protein degradation in lysosomes (Yoshimori et al., 1991). The results showed that, in both WT and A1 KO microglia, Baf treatment almost completely blocked intracellular Aβ1–42 degradation (Fig. 2D). Cathepsin B (CatB) is a cysteine protease that degrades Aβ in vitro and in vivo (Mueller-Steiner et al., 2006). Cathepsin D (CatD) is an aspartate protease and degrades Aβ in vitro (Hamazaki, 1996). We pretreated the cells with a cell-permeable CatB specific inhibitor (CatBi) or with pepstatin A methyl ester (PepA), a cell-permeable aspartate protease inhibitor, and then analyzed intracellular Aβ1–42 degradation after performing the pulse-chase experiment described above. The results showed that CatBi significantly inhibited intracellular Aβ1–42 degradation, and the intracellular levels of Aβ1–42 in WT and A1 KO microglia became comparable (Fig. 2D). In contrast, PepA treatment failed to inhibit intracellular Aβ1–42 degradation in WT microglia and slightly blocked Aβ1–42 degradation in A1 KO microglia. As a result, after PepA treatment, the intracellular Aβ1–42 levels became similar in WT and A1KO microglia (Fig. 2D). These results suggest that CatB activity in the lysosomes plays an important role to account for the increased intracellular Aβ1–42 degradation observed in A1 KO microglia.
Figure 2.

A1 KO in microglia caused an increase in intracellular Aβ1–42 degradation in lysosomes. A, WT or A1 KO microglia were incubated with 0.5 μm Cy3-Aβ1–42 (red) for 3 h and immunostained with anti-LAMP1 antibody (green) for late endosomes/lysosomes. Cells were imaged using a confocal microscope. Representative immunofluorescence images are shown. Bottom, Enlarged images of the boxed areas in the top. Scale bar, 10 μm. B, Diagram demonstrating the procedure used to conduct pulse-chase experiments with or without various inhibitors. C, D, Pulse-chase experiments were performed in WT or A1 KO microglia, in a manner described in B and in Materials and Methods. Briefly, WT or A1 KO microglia were incubated with 0.5 μm Aβ1–42 for 30 min. Cells were preincubated with (D) or without (C) inhibitors as indicated for 90 min before exposure to oligomeric Aβ (Baf, bafilomycin A1; CatBi, cathepsin B inhibitor; PepA, pepstatin A methyl ester). Cells were washed several times and incubated in serum-free medium for the indicated time. At the end of incubation, cells were washed and lysed. Intracellular Aβ1–42 levels were examined by ELISA and normalized with cellular protein concentration. Data are mean ± SEM of three experiments. **p < 0.01. ***p < 0.001. ##p < 0.01.
A1 KO in microglia causes increases in lysosome-specific gene expressions and in lysosome volume
CatB is translated at the ER as a precursor form proCatB and is glycosylated in the Golgi apparatus. Glycosylated proCatB is then transported into the lysosomes and proteolytically cleaved by CatD to form fully functional mature CatB in the same compartments (Katunuma, 2010). We monitored protein expression levels of CatB in WT or A1 KO microglia and found that the protein levels of both mature CatB (30 kDa) and total CatB (proCatB and mature CatB) were significantly increased in A1 KO microglia (Fig. 3A,B); the level of proCatB (40 kDa) in A1 KO microglia showed a trend toward increasing, but the difference did not reach statistical significance.
Figure 3.

A1 KO in microglia caused increases in lysosome-specific gene expressions and in lysosome volume. A, B, Cathepsin B (CatB) protein levels in WT or A1 KO microglia were analyzed by Western blot. To identify proCatB and mature CatB, cells were treated with 25 mm NH4Cl for 3 h. A, Representative blot. B, Expression levels of proCatB (40 kDa) and mature CatB (30 kDa) were quantified using ImageJ software. Values are mean ± SEM of three experiments. **p < 0.01. C, Expression levels of lysosome-specific genes were examined by qPCR in WT or A1 KO microglia. Data are mean ± SEM of five experiments. *p < 0.05. **p < 0.01. ***p < 0.001. D, E, Cellular acidic compartments were analyzed by LysoTracker staining (50 nm, 30 min) followed by flow cytometry. D, Representative histogram. E, Data are mean ± SEM of four experiments. ***p < 0.001.
TFEB regulates lysosomal protein biogenesis by increasing transcription of target genes that belong to the coordinated lysosomal expression and regulation (CLEAR) network, including CatB (Sardiello et al., 2009). To test whether A1 KO upregulates expressions of the CLEAR network genes in microglia, we examined mRNA levels of various TFEB-target genes by qPCR analysis. The results showed that the expression levels of LAMP1, LAMP2, CatB, CatD, and HEXA were all significantly increased in A1 KO microglia (Fig. 3C), suggesting that A1 KO increases TFEB-mediated lysosomal protein biogenesis in microglia. To further test this possibility, we stained microglia cells with LysoTracker, a fluorescent dye that accumulates in acidic compartments (i.e., LE/LS), and performed flow cytometry analysis. The results revealed that A1 KO microglia contained 21% more in LE/LS volume than WT microglia (Fig. 3D,E). Together, these results demonstrate that A1 KO in microglia causes increases in lysosome-specific gene expressions and in lysosome volume.
Inhibiting ACAT1 in an established microglial cell line N9 causes increases in Aβ clearance and in lysosome volume
To investigate whether pharmacological ACAT1 inhibition elicits the same effects as A1 KO in microglia, we examined the effects of an ACAT1-specific inhibitor, K604 (Ikenoya et al., 2007) on Aβ clearance and on lysosome biogenesis in an established mouse microglial cell line N9. The N9 microglial cell line was developed by immortalizing mouse primary microglia and shares many characteristics with primary microglia, as reviewed by Stansley et al. (2012). As expected, K604 efficiently blocked ACAT activity in a dose-dependent manner in N9 cells (Fig. 4A).
Figure 4.

Inhibiting ACAT1 in N9 microglial cell line caused increases in Aβ1–42 clearance and in lysosome volume. A, N9 cells were treated with K604 at the indicated concentrations for 24 h. ACAT activity assay was performed in intact cells. Data are mean ± SEM of three independent experiments. ***p < 0.001. B, C, N9 cells were pretreated with K604 at the indicated concentrations for 24 h and then incubated with 0.5 μm Aβ1–42 for 12 h in the presence of K604. At the end of incubation, media were collected and the residual Aβ1–42 levels in media were detected by Western blot. B, Representative blot. C, Quantification data are mean ± SEM of two experiments. ***p < 0.001. D, N9 cells were preincubated with or without 0.5 μm K604 for 8 h and then incubated with 0.5 μm Cy3-Aβ1–42 for 3 h in the presence or absence of 0.5 μm K604. Cells were washed several times, and intracellular Aβ1–42 levels were analyzed by flow cytometry. Data are mean ± SEM of three experiments. **p < 0.01. E, N9 cells were treated with 0.5 μm K604 for 8 h. Expression levels of ABCA7, CD36, and SRA were examined by qPCR. Data are mean ± SEM of three experiments. n.s., Not significant. F, N9 cells were treated with 0.5 μm K604 for 8 h. Expression levels of lysosome-specific genes were examined by qPCR. Data are mean ± SEM of three experiments. *p < 0.05. **p < 0.01. ***p < 0.001. G, N9 cells were incubated with K604 at the indicated concentrations for 8 h. Cellular acidic compartments were analyzed by LysoTracker staining (50 nm, 30 min) followed by flow cytometry. Data are mean ± SEM of three experiments. **p < 0.01. ***p < 0.001.
Next, we pretreated N9 cells with K604 at various concentrations for 24 h and then incubated the cells with oligomeric Aβ1–42 for 12 h in the presence of K604. The residual oligomeric Aβ1–42 levels present in the media were analyzed by Western blot. The results showed that K604 treatment lowered the oligomeric Aβ1–42 level remaining in the media in a dose-dependent manner (Fig. 4B,C). We next examined whether K604 promotes uptake of oligomeric Aβ1–42. N9 cells were pretreated with K604 for 8 h and then incubated with Cy3-Aβ1–42 for 3 h in the presence of K604. Subsequent flow cytometry analysis demonstrated that K604 increased the uptake of Cy3-Aβ1–42 by 23% (Fig. 4D). Additional result showed that, similar to A1 KO in microglia, blocking ACAT1 by K604 in N9 cells had no effect on the mRNA levels of ABCA7, CD36, and SRA (Fig. 4E).
To test whether K604 increases expressions of TFEB-target genes in N9 cells, we next performed qPCR analysis after K604 treatment for 8 h. The results showed that, in cells treated with K604, the mRNA expression levels of five different TFEB-target genes were all significantly increased (Fig. 4F). In addition, LysoTracker staining followed by flow cytometry analysis revealed that K604 significantly increased LE/LS volume by up to 40% (Fig. 4G). Collectively, these results show that inhibiting ACAT1 activity with the ACAT1-specific inhibitor K604 can reproduce the findings observed in A1 KO microglia. Interestingly, at 0.1 μm, K604 inhibited ACAT activity by ∼80% (Fig. 4A) and still significantly enhanced LysoTracker-fluorescence intensity in N9 cells (Fig. 4G). These results suggest that partial blockage of ACAT1 in microglia is sufficient to increase TFEB-dependent lysosomal biogenesis.
Blocking ACAT1 causes an increase in autophagy flux in an mTOR-independent manner
The results described above show that ACAT1 blockage promotes lysosome biogenesis in microglia. Autophagy is closely associated with lysosome biogenesis (Saftig and Klumperman, 2009). We hypothesized that blocking ACAT1 increases autophagy in microglial cells. To test this possibility, we investigated the effects of ACAT1 blockage on autophagy in microglia. The lipidated form of LC3 (LC3-II) is a marker for autophagy (Mizushima and Yoshimori, 2007). We performed Western blot analysis and showed that the LC3-II levels were significantly higher in A1 KO microglia than in WT microglia (Fig. 5A,B); the LC3-II levels were also significantly higher in K604-treated N9 cells than in vehicle-treated cells (Fig. 5C,D). Because degradation of LC3-II affects its steady-state levels, we monitored autophagy flux by using lysosome inhibitors, including Baf and NH4Cl, which block lysosomal acidification and accumulate LC3-II (Mizushima and Yoshimori, 2007). The results show that treating primary microglia with Baf (Fig. 5A,B) or treating N9 cells with NH4Cl (Fig. 5C,D) further increased the LC3-II levels in these cells, suggesting that ACAT1 blockage increases autophagy flux without interfering with the clearance of autophagosome. LC3 punctate structure is a well-established method for estimating autophagosome formation in intact cells (Mizushima et al., 2010). We quantified LC3 puncta in microglia by fluorescence microscopy. In agreement with the results by Western blot analysis, we found that A1 KO microglia contained 3.5 times more LC3 puncta than WT microglia (Fig. 5E,F). Similarly, the N9 cells treated with K604 contained 2.5 times more LC3 puncta than vehicle-treated cells (Fig. 5G,H).
Figure 5.
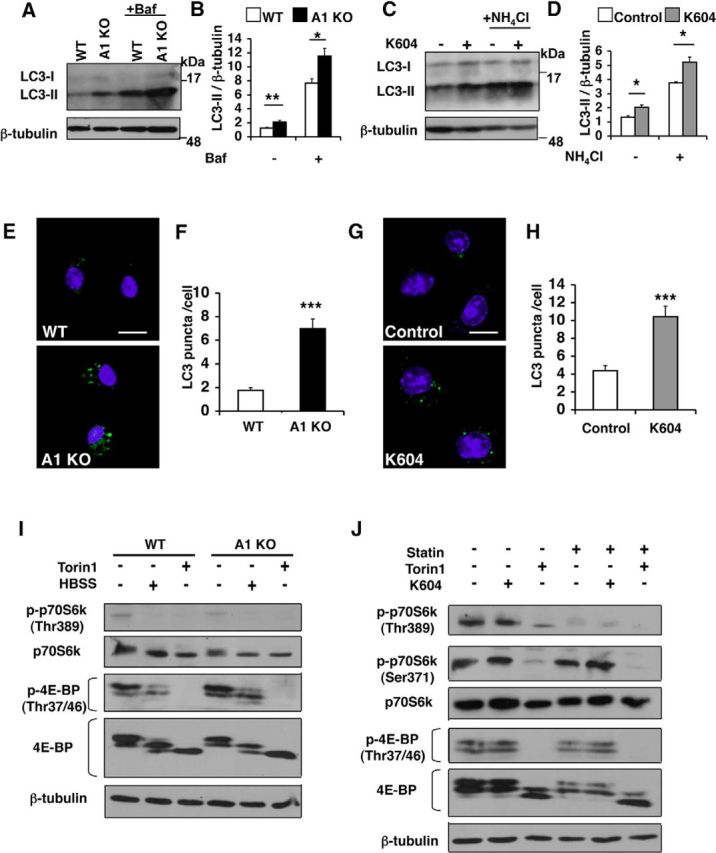
Blocking ACAT1 caused an increase in autophagy flux in an mTOR-independent manner. A, B, Microglia were treated with or without 0.25 μm Baf for 3 h. Cell lysates were analyzed by Western blot for LC3. A, Representative blot. B, Values are mean ± SEM of three experiments. *p < 0.05. **p < 0.01. C, D, N9 cells were treated with 0.5 μm K604 for 8 h, with or without 25 mm NH4Cl for the last 3 h of incubation. Cell lysates were analyzed by Western blot for LC3. C, Representative blot. D, Values are mean ± SEM of three experiments. *p < 0.01. E, F, Microglia were immunostained: LC3 (green) and DAPI (blue). E, Representative pictures. Scale bar, 10 μm. F, Numbers of LC3 puncta per cell were counted in at least 50 cells/genotype using ImageJ software. Values are mean ± SEM. ***p < 0.001. G, H, N9 cells were incubated with or without 0.5 μm K604 for 8 h and immunostained: LC3 (green) and DAPI (blue). G, Representative pictures. Scale bar, 10 μm. H, Numbers of LC3 puncta per cell were counted in at least 70 cells/condition using ImageJ software. Values are mean ± SEM. ***p < 0.001. I, WT or A1 KO microglia were incubated with 0.25 μm Torin1 or with Hanks Balanced Salt Solution (HBSS) only for 3 h. Cell lysates were analyzed by Western blot for phospho and total levels of, p70S6K and 4E-BP. The blot shown is representative of two experiments. J, N9 cells were grown in the absence or presence of 50 μm lovastatin (statin) and 230 μm mevalonate for 48 h. Cells were then incubated with 0.5 μm K604 for 8 h or with 0.25 μm Torin1 for 3 h in the absence or presence of statin/mevalonate. mTOR activity was analyzed by Western blot for phospho and total levels of p70S6K and 4E-BP. The blot shown is representative of two experiments.
mTOR is a serine/threonine protein kinase that regulates cell growth, proliferation, motility, cell survival, etc. (Laplante and Sabatini, 2012). In various cell types, inhibition of mTOR by nutrient starvation or by treating with various mTOR inhibitors increases both autophagy and lysosome biogenesis (Settembre et al., 2012; Zhou et al., 2013). To determine whether the effects of ACAT1 blockage on autophagy and on lysosome biogenesis depend on inhibition of mTOR signaling, we analyzed mTOR kinase activity by Western blot analyses. The result showed that comparable levels of mTOR activity, revealed by measuring the phospho-p70S6K and phospho-4E-BP levels, were present in WT and A1 KO microglia (Fig. 5I). In addition, when WT and A1 KO microglia were nutrient-starved by incubating in Hanks Balanced Salt Solution (HBSS) for 3 h, or by treating with a potent mTOR inhibitor Torin1 (Guertin and Sabatini, 2009) for 3 h, the mTOR activities were suppressed to very similar levels in both cell types. We also examined the effect of K604 on mTOR signaling in N9 cells by Western blot analysis. The results showed that K604 treatment failed to decrease the levels of phospho-p70S6K and phospho-4E-BP, whereas Torin1 treatment strongly reduced the levels of these proteins (Fig. 5J). These results show that the mechanism(s) by which ACAT1 blockage leads to increases in autophagy and in lysosome biogenesis is distinct from that of Torin1/starvation-mediated mTOR blockage.
ACAT1 blockage and mTOR inhibition cause additive effects on autophagy flux and on lysosome volume
The results described in Figure 5 prompted us to test whether ACAT1 blockage and mTOR inhibition produce additive effects on autophagic flux and on lysosome volume. p62 is a selective autophagic substrate, and p62 protein levels inversely correlate with autophagic activity (Mizushima et al., 2010). We monitored autophagic flux in primary microglia by quantifying the LC3-II and p62 levels by Western blots. The result showed that a 3 h-incubation in HBSS caused a further decrease of p62 and a further increase of LC3-II in A1 KO microglia than in WT microglia (Fig. 6A–C). We next examined LE/LS volume in WT and A1 KO microglia with or without HBSS incubation. The results showed that the effects of A1 KO and HBSS treatment on lysosome volume are additive (Fig. 6D). Similarly, in N9 cells, the effects of K604 and Torin1 treatment on lysosome volume are shown to be additive (Fig. 6E). Together, these data indicate that the effects of ACAT1 blockage and mTOR inhibition on autophagic flux and lysosome volume are additive.
Figure 6.

ACAT1 blockage and mTOR inhibition produced additive effects on autophagy flux and lysosome volume. A–D, Microglia were incubated in HBSS only for 3 h. A, Cell lysates were analyzed by Western blot for LC3 and for p62. Representative Western blot. B, C, Data are mean ± SEM of three experiments. **p < 0.01. ***p < 0.001. D, Cellular acidic compartments were analyzed by LysoTracker staining (50 nm, 30 min) followed by flow cytometry. Values are mean ± SEM of three experiments. **p < 0.01. ***p < 0.001. #p < 0.05. ###p < 0.001. E, N9 cells were treated with various inhibitors as indicated (0.5 μm K604 for 8 h, or 0.25 μm Torin1 for 3 h, or 0.5 μm K604 for 8 h and 0.25 μm Torin1 for the last 3 h of incubation). Cellular acidic compartments were analyzed by LysoTracker staining (50 nm, 30 min) followed by flow cytometry. Values are mean ± SEM of three experiments. *p < 0.05. **p < 0.01. ***p < 0.001. #p < 0.05. ##p < 0.01.
The effect of ACAT1 inhibition on lysosome biogenesis depends on autophagosome formation and on TFEB
Atg5 is an essential protein for autophagy (Mizushima et al., 2001). To explore the relationship between augmented autophagy and lysosome biogenesis caused by ACAT1 blockage, we inhibited autophagosome formation in N9 cells by using siRNA knockdown (KD) targeting Atg5 and then treated the KD cells with Torin1 or with K604. Western blot analysis revealed that, compared with control KD cells, the Atg5 protein levels were reduced by ∼95% (Fig. 7A; Atg5). Unlike control KD cells, virtually no LC3-II was observed in Atg5 KD cells when they were treated with either K604 or Torin1 (Fig. 7A; LC3). We also found that, unlike control KD, Atg5 KD dramatically reduced LC3-positive puncta in K604-treated or in Torin1-treated cells (Fig. 7B). These results show that both the effect of K604 and the effect of Torin1 on autophagosome formation require Atg5. We next investigated the effect of K604 or Torin1 on lysosome volume in N9 cells after Atg5 KD. The result showed that, unlike control KD, in Atg5 KD cells, K604 failed to increase LysoTracker staining (Fig. 7C, red panels). The result of a control experiment showed that, in Atg5 KD cells, Torin1 increased LysoTracker staining to a similar level as that in control KD cells (Fig. 7C, blue panels). Recent studies have shown that TFEB upregulates autophagy and lysosomal protein biogenesis (Settembre et al., 2011, 2012). We analyzed mRNA expression levels of TFEB-target genes and found that Atg5 KD abolished the effect of K604 on the expressions of TFEB-target genes, whereas Torin1 still increased the expressions of these genes in Atg5 KD cells (Fig. 7F; Ctrl KD vs Atg5 KD). These data demonstrate that, unlike Torin1, the effect of K604 on lysosome biogenesis depends on autophagosome formation in N9 cells. To investigate whether the effect of K604 on autophagy and on lysosome biogenesis depends on TFEB, we performed TFEB KD in N9 cells. The result showed that TFEB KD decreased TFEB expression in N9 cells by ∼90% (Fig. 7D; TFEB). In TFEB KD cells, treating cells with either K604 or with Torin1 still caused increase in the LC3-II levels (Fig. 7D; LC3), suggesting that augment in autophagosome formation caused by either K604 or Torin1 does not depend on TFEB. We next examined the effects of K604 or Torin1 on lysosome biogenesis in TFEB KD cells. Flow cytometry analysis revealed that, in TFEB KD cells, K604 failed to increase LysoTracker staining (Fig. 7E). In TFEB KD cells, Torin1 treatment still increased LysoTracker staining, but the increase was significantly less compared with control KD cells. We examined expression levels of TFEB-target genes in TFEB KD cells by qPCR and found that, as expected, neither K604 nor Torin1 was able to upregulate the mRNA levels of TFEB-target genes (Fig. 7F; Ctrl KD vs TFEB KD). Collectively, these results demonstrate that both autophagosome formation and TFEB are required to mediate the effect of ACAT1 blockage on lysosome biogenesis. However, TFEB is not required to mediate the effect of ACAT1 blockage on autophagosome formation.
Figure 7.
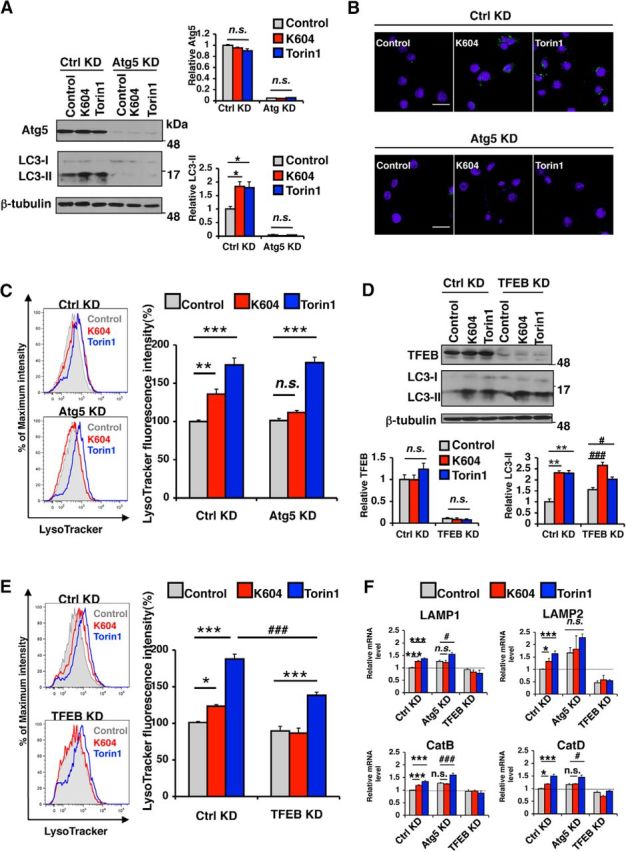
The effect of ACAT1 inhibition on lysosome biogenesis depended on autophagosome formation and on TFEB. A–E, F, N9 cells were transfected with control siRNA (Ctrl KD), or Atg5 siRNA (Atg5 KD) or TFEB siRNA (TFEB KD) for 72 h in RPMI containing 10% FBS and then incubated in fresh medium with 0.5 μm K604 for 8 h or with 0.25 μm Torin1 for 3 h. A, Cell lysates were analyzed by Western blot for Atg5 and for LC3. Representative blot. Quantification data are mean ± SEM of two experiments. *p < 0.05. n.s., Not significant. B, N9 cells were immunostained with anti-LC3 antibody (green) and DAPI (blue) and visualized under confocal microscopy. Scales bar, 20 μm. C, E, Cellular acidic compartments were analyzed by LysoTracker staining (50 nm, 30 min) followed by flow cytometry. Representative histograms. Relative fluorescence intensity data were results of three experiments. Values are mean ± SEM of three experiments. *p < 0.05. **p < 0.01. ***p < 0.001. ###p < 0.001. n.s., Not significant. D, Cell lysates were analyzed by Western blot for TFEB and LC3. Representative blot. Quantification data are mean ± SEM of two experiments. **p < 0.01. #p < 0.05. ###p < 0.001. n.s., Not significant. F, Expression levels of lysosome-specific genes were analyzed by qPCR. Data are mean ± SEM of four experiments. *p < 0.05. ***p < 0.001. #p < 0.05. ###p < 0.001. n.s., Not significant.
Blocking ACAT1 does not induce ER stress in microglia
Autophagy can also be activated as a consequence of ER stress (Ogata et al., 2006). ACAT1 is a resident enzyme in the ER (Chang et al., 1995). Under certain conditions, overaccumulation of cholesterol and/or unesterified fatty acids at the ER can induce ER stress (Feng et al., 2003; Erbay et al., 2009). It is possible that blocking ACAT1 leads to overaccumulation of cholesterol at the ER, which in turn stimulates ER stress and autophgy. To test this possibility, we evaluated the effect of K604 on mRNA levels of several unfolded protein response (UPR) genes by qPCR. The result showed that K604 treatment did not alter the expression levels of the UPR genes in N9 cells (Fig. 8A) and the mRNA expression levels of these UPR genes were similar in WT and A1 KO microglia (Fig. 8B). Splicing of XBP1 mRNA is an indicator for ER stress (Yoshida et al., 2001). We examined the unspliced and the spliced forms of XBP1 by RT-PCR and found that K604 treatment in N9 cells, or A1 KO in primary microglia, did not cause detectable splicing of the XBP1 mRNA (Fig. 8C). Together, these results demonstrate that, under the conditions used here, ACAT1 blockage does not cause ER stress in microglia.
Figure 8.

Blocking ACAT1 did not induce ER stress in microglia. A, N9 cells were treated with 0.5 μm K604, or with 2.5 μg/ml tunicamycin, or with 1 μm thapsigargin for 8 h. Total RNA was isolated, and cDNA was synthesized using reverse transcriptase. Expression levels of UPR-target genes were analyzed by qPCR. Data are mean ± SEM of two experiments. **p < 0.01. ***p < 0.001. n.s., Not significant. B, Expression levels of UPR-target genes were determined by qPCR. cDNA was synthesized from total RNA obtained from primary microglia. Data are mean ± SEM of three experiments. n.s., Not significant. C, Unspliced form (uXBP1) and spliced form (sXBP1) of XBP1 were detected by RT-PCR. Tm, tunicamycin; Tg, thapsigargin.
Inhibiting ACAT1 in N9 cell increases autophagosome formation without altering ABCA1 protein level or cellular cholesterol content
ATP-binding cassette transporter A1 (ABCA1) mediates cholesterol and phospholipid efflux in various cell types and plays key roles in lipid metabolism in the systemic tissues as well as in the CNS (for review, see Stukas et al., 2014). ABCA1 is transcriptionally regulated by liver X receptors (LXRs) (Zelcer and Tontonoz, 2006). Increasing ABCA1 expression by synthetic LXR ligands (such as TO901317) promotes Aβ clearance in microglia (Jiang et al., 2008; Terwel et al., 2011). We had previously shown that treating a cholesterol-rich Chinese hamster ovary cell line 25RA with an ACAT inhibitor F12511 (which inhibits both ACAT1 and ACAT2) for 24 h caused a significant increase in the ABCA1 protein levels (Yamauchi et al., 2004). Here we sought to determine whether ABCA1 might be involved in mediating the effects of ACAT1 blockage on increasing autophagosomes. To test this possibility, we treated N9 cells with K604 for the time as indicated and monitored ABCA1 and LC3 levels. To serve as a positive control, we also treated N9 cells with a synthetic LXR agonist TO901317 for 24 h. The result showed that K604 had no effect on cellular ABCA1 protein levels for up to 8 h (Fig. 9A,B) but had a significant effect on LC3-II levels as early as 4 h after treatment (Fig. 9A,C). In contrast, the result of the control experiment showed that TO901317 significantly upregulated the ABCA1 protein level (Fig. 9A,B; TO901317), but without altering the LC3-II level (Fig. 9A,C; TO901317). These results demonstrate that, within the 8 h time period, the effect of ACAT1 blockage on autophagosomes does not involve an increase in the ABCA1 protein content. These results also suggest that the action of TO901317 in N9 cells does not involve an increase in autophagosome formation.
Figure 9.

Inhibiting ACAT1 in N9 cell within 8 h did not increase ABCA1 protein level. A–C, N9 cells were treated with 0.5 μm K604 for the indicated time or with 10 μm TO901317 for 24 h. Cell lysates were analyzed by Western blot for ABCA1 and LC3. A, Representative blot. B, C, Data are mean ± SEM of two experiments. *p < 0.5. **p < 0.01. ***p < 0.001. D, E, N9 cells were treated with 1 μm K604 for the indicated time. Cellular lipids were extracted, and cellular cholesterol and cholesterol ester levels were determined as described in Materials and Methods. Experiment was performed in triplicate, and data are mean ± SEM. *p < 0.5. n.d., not detectable.
It has been shown that significant reductions in total cellular cholesterol (unesterified “free” cholesterol and esterified cholesterol) levels stimulate Aβ degradation in microglia (Lee et al., 2012). It is possible that the effects of ACAT1 blockage on stimulating Aβ degradation in microglia may involve a reduction in total cellular cholesterol levels. To test this possibility, we treated N9 cells with K604 for various times as indicated and analyzed cellular cholesterol levels. The result showed that, within 8–24 h of K604 treatment, cellular cholesterol ester was reduced by ∼50%; after 48 h of K604 treatment, no cholesterol ester was detectable (Fig. 9E). Overall, K604 treatment did not cause a significant reduction in total cellular cholesterol content (Fig. 9D). These results suggest that the mechanism(s) by which ACAT1 blockage promotes Aβ clearance in microglia is not through lowering total cellular cholesterol levels.
The effect of ACAT1 blockage on lysosome volume is sensitive to endogenous cholesterol biosynthesis
In intact cells, ACAT1 activity is mainly controlled by the ER cholesterol pool (Chang et al., 1997). We sought to determine whether altering cellular cholesterol levels influences the effect of ACAT1 blockage on lysosome biogenesis. We blocked cholesterol biosynthesis by treating cells with a squalene synthase inhibitor CP-340868 (SSI) (Reid et al., 2008) or with an HMG CoA reductase inhibitor lovastatin (statin) (Fig. 10A). In cells treated with statin, we also provided mevalonate in growth medium, such that the statin effect is mainly on cholesterol, but not on mevalonate-derived nonsterol metabolites (Goldstein and Brown, 1990). In a parallel experiment, we provided cells with excess cholesterol by loading cholesterol in complex with methyl-β-cyclodextrin, which is a soluble cholesterol carrier (cholesterol/MβCD). After these treatments, we assessed cellular acidic compartments by LysoTracker staining followed by flow cytometry. The results showed that blocking endogenous cholesterol biosynthesis by SSI eliminated the difference in LE/LS volume between WT and A1 KO microglia; however, the SSI effect could be negated when cells were also loaded with cholesterol in the growth medium (Fig. 10B). Similarly, in N9 cells treated with statin or with SSI, K604 failed to increase cellular acidic compartments; the statin effect or the SSI effect was negated when cells were loaded with excess cholesterol (Fig. 10C). These data show that the effect of ACAT1 blockage on LE/LS volume is sensitive to cellular cholesterol content. We noticed that statin treatment also promoted LysoTracker staining in N9 cells. Statins are known to inhibit Akt/mTOR signaling in addition to their cholesterol-lowering effects (Roudier et al., 2006). Consistent with the report by Roudier et al. (2006), we found that statin reduced phopho-p70S6K (Thr389) level (Fig. 5J), suggesting that, unlike ACAT1 blockage, statin can induce mTOR-dependent lysosome biogenesis by partially inhibiting mTOR kinase activity.
Figure 10.

The effect of ACAT1 blockage on lysosome volume was sensitive to endogenous cholesterol biosynthesis. A, Cholesterol biosynthesis pathway and inhibitors used in this study and their target enzymes. B, WT or A1 KO microglia were incubated with 1 μm squalene synthase inhibitor (SSI) and/or 31.25 μm cholesterol in complex with 250 μm methyl-β-cyclodextrin (cholesterol/MbCD) for 24 h. LysoTracker-positive compartments were analyzed by LysoTracker staining (50 nm, 30 min) flow cytometry. Data are mean ± SEM of two experiments. *p < 0.05. **p < 0.01. n.s., Not significant. C, N9 cells were pretreated with the following agents: 50 μm lovastatin/230 μm mevalonate (statin) for 48 h, or 1 μm SSI for 24 h, or 31.25 μm cholesterol/MβCD for 48 h. Cells were then incubated with 0.5 μm K604 for 8 h in the presence of the same agents; 50 nm LysoTracker was added for the last 30 min of incubation. Fluorescence intensity was examined by flow cytometry. Data are mean ± SEM of three experiments. **p < 0.01. ***p < 0.001. n.s., Not significant. D–F, N9 cells were pretreated with 50 μm statin for 48 h or 1 μm SSI for 24 h. Cells were then incubated with 0.5 μm K604 for 8 h or 0.25 μm Torin1 for 3 h. Cell lysates were analyzed by Western blot for LC3 and p62. D, Representative blot. E, F, Data are mean ± SEM of three experiments. *p < 0.5. **p < 0.01. ***p < 0.001. n.s., Not significant.
We next investigated whether blocking cholesterol biosynthesis influences the K604 effect on autophagosome formation in N9 cells. We first showed that, in agreement with an early study (Cheng et al., 2006), treating cells with statin or with SSI increased LC3-II levels (Fig. 10D,E; LC3). However, in statin- or SSI-treated cells, p62 levels were unchanged (Fig. 10D,F; p62). This result suggests that, similar to ACAT1 blockage, inhibiting cholesterol biosynthesis by statin or by SSI can also increase autophagosome formation; however, unlike ACAT1 blockage, statin or SSI does not facilitate autophagic flux. Adding K604 to statin-treated or SSI-treated cells further increased LC3-II levels (Fig. 10D,E; LC3). However, in the presence of statin, K604 no longer reduced p62 levels (Fig. 10D,F; p62). These data suggest that the action of K604 requires endogenous cholesterol biosynthesis. When cholesterol biosynthesis is inhibited, K604 treatment still increases autophagosome formation but fails to increase autophagic flux. Additional result showed that, in N9 cells treated with cholesterol-biosynthesis inhibitors, Torin1 also failed to reduce p62 levels (Fig. 10D,E; p62). It is known that cholesterol depletion reduces autophagosome/lysosome fusion in vitro (Koga et al., 2010). Thus, it is possible that the effect of statin or SSI seen here is through their ability to reduce cellular cholesterol levels, which leads to inhibition of fusion between autophagosomes and lysosomes and slows down autophagic flux.
A1 KO causes an increase in lysosome biogenesis in microglia in vivo
The triple transgenic AD (3XTg-AD) mouse has been extensively used for AD research. This mouse model displays memory dysfunction by 9 months of age and starts to develop significant Aβ1–42 accumulation at 10 months of age (Oddo et al., 2003). We had previously shown that A1 KO in 3XTg-AD mouse reduced human APP (hAPP) and Aβ1–42 levels, and rescued cognitive deficits (Bryleva et al., 2010). In addition, we showed that adeno-associated virus-mediated Acat1 gene KD in symptomatic 3XTg-AD mouse also reduced hAPP and Aβ1–42 levels (Murphy et al., 2013). In these studies, we noted that the effect of A1 KO on reducing Aβ1–42 content (by 80%) was more profound than its effect on reducing hAPP content (by 60%) (Bryleva et al., 2010). We also noted that Acat1 KD significantly diminished the oligomeric Aβ content in the brains of the 3XTg-AD mice (Murphy et al., 2013). These results raise the possibility that, in addition to its effect on reducing hAPP content, ACAT1 inhibition may increase Aβ1–42 clearance in the AD mouse brain. Here, to evaluate the effect of ACAT1 blockage in microglia in vivo, we first compared the expression levels of TFEB-target genes in microglia isolated from the 3XTg-AD mice with Acat1 gene (3XTg-AD/A1+) or without Acat1 gene (3XTg-AD/A1−). We isolated highly pure (93%–95%) microglia population from brains of these mice at the age of 4 or 12 months, using anti-CD11b-coated magnetic beads (Fig. 11A). Microglia isolated by using this method are thought to recapitulate their in vivo features, such as gene expressions (Nikodemova and Watters, 2012; Chiu et al., 2013). The results of qPCR experiments showed that the expression levels of TFEB-target genes were all significantly higher in microglia from the 3XTg-AD/A1− mice compared with those from the 3XTg-AD/A1+ mice (Fig. 11B,C). These data suggest that A1 KO increases lysosome biogenesis in adult AD mouse microglia and may stimulate Aβ clearance in vivo.
Figure 11.

A1 KO caused an increase in lysosome biogenesis in microglia in vivo. A, Microglia were isolated from adult CX3CR1/GFP+/+ mice as described in Materials and Methods. The GFP-positive cell population was viewed under fluorescence microscopy. Representative pictures are shown. Scale bar, 20 μm. B, C, Cd11b+ microglia were isolated from adult 3XTg-AD/A1+ and 3XTg-AD/A1− mice at (B) 4 months of age (n = 7 mice per genotype) and (C) 12 months of age (n = 8 mice per genotype). Total RNAs were isolated from microglia, and expression levels of lysosome-specific genes were analyzed by qPCR. Values are mean ± SEM. *p < 0.05. ***p < 0.001.
A1 KO stimulates Aβ clearance in vivo
We next investigated whether A1 KO stimulates Aβ clearance in vivo. In addition to the WT mice and the global A1 KO mice, we used the myeloid-specific Acat1−/− (A1-M/-M) mice, which have recently been created in this laboratory (L.-H.H. et al., unpublished observations). Biochemical analyses show that, unlike A1 KO mice, A1-M/-M mice have ACAT1 deletion in microglia but not in neurons or astrocytes (Fig. 12A). Injections of Aβ to the mouse brain have been used to reproduce pathological features of AD. For instance, intracerebroventricular injections of synthetic Aβ1–42 oligomers, but not Aβ1–42 fibrils, impair long-term memory in mice (Balducci et al., 2010). Brouillette et al. (2012) showed that repeated injections of oligomeric Aβ1–42 into the hippocampus of awake mice lead to several neuropathological hallmarks of AD, including memory dysfunction and neuronal loss; these investigators also showed that, after a single injection, most of the injected Aβ1–42 was cleared in 72 h. It was also shown that microglia are rapidly recruited to the site of microinjection (Mandrekar et al., 2009). Using a similar approach as the ones used by other investigators described above, we injected oligomeric Aβ1–42 into the dentate gyrus of the hippocampal region in age-matched female WT, A1-M/-M, and A1 KO mice and monitored the clearance of Aβ1–42 from the brains by ELISA. Twenty-four hours after injection, >60% of oligomeric Aβ1–42 were cleared from the hippocampus in these mice. The rapid Aβ clearance from the brain observed here is due to the rapid transport of Aβ through the blood–brain barrier and the interstitial fluid drainage pathways (Deane et al., 2008). The residual Aβ1–42 levels in these three different mouse strains were comparable; however, 72 h after injection, significantly less residual Aβ1–42 remained in the A1-M/-M mice and the A1 KO mice than those in the WT mice (Fig. 12B). This result is consistent with the interpretation that A1 KO in microglia promote Aβ1–42 clearance in vivo.
Figure 12.

A1 KO stimulated Aβ clearance in vivo. A, Primary microglia, astrocytes, and neurons were isolated from neonatal WT, A1 KO, and A1-M/-M mice. Cell lysates were analyzed by Western blot for ACAT1. ACAT enzyme activity was measured in primary cell cultures. Data are mean ± SEM of two experiments. **p < 0.01. ***p < 0.001. ###p < 0.001. B, WT (n = 14), A1-M/-M (n = 16), and A1 KO (n = 13) female mice at 7–8 weeks of age were anesthetized, and 1 μl/mouse of oligomeric Aβ1–42 (0.22 μg/μl) was stereotaxically injected into the dentate gyrus of the hippocampus. Mice were killed at the indicated time point, and the hippocampi were isolated. Aβ1–42 levels in detergent-soluble fractions (see Materials and Methods for details) were determined by ELISA. Horizontal bars represent median values. **p < 0.01. ***p < 0.001. n.s., Not significant.
Discussion
Lipid metabolism is closely associated with AD at several stages (Hartmann et al., 2007). Previous work from this and other laboratories showed that blocking ACAT, a key enzyme in cellular cholesterol storage, decreases amyloidopathy in cell culture and in mouse models for AD. However, the mechanistic basis to account for the beneficial actions of blocking ACAT1 remained not well understood. Depending on the model systems used, blocking ACAT1 affects the APP processing (Hutter-Paier et al., 2004; Bhattacharyya et al., 2013) or affects the full-length hAPP protein level itself (Bryleva et al., 2010; Murphy et al., 2013). Here we show that in microglia, blocking ACAT1 in mouse increases phagocytosis and cellular capacity to degrade oligomeric Aβ1–42 in cell culture and in vivo. Thus, in addition to decreasing the Aβ production, ACAT1 blockage increases Aβ clearance (i.e., ACAT1 blockage can benefit AD through multiple mechanisms). Impaired microglial clearance of Aβ is partially responsible for AD pathogenesis (Hickman et al., 2008; Griciuc et al., 2013; Lucin et al., 2013). In mouse models, promoting phagocytosis and/or degradation of Aβ in microglia has been shown to benefit AD (Jiang et al., 2008; Frenkel et al., 2013). Our current study offers a new therapeutic approach to target microglia for AD treatment. In the future, it would be interesting to test whether ACAT1 blockage in microglia alone is sufficient to rescue cognitive deficits in mouse models of AD.
Autophagy is an essential process that initiates the cellular clearance of misfolded/aggregated proteins/peptides within lysosomes (Mizushima et al., 2008). TFEB promotes lysosome biogenesis and activates the CLEAR network (Sardiello et al., 2009). Both autophagy and TFEB activation are negatively regulated by mTOR (Settembre et al., 2012; Zhou et al., 2013). Several small molecules that activate autophagy through mTOR-independent pathways have been identified (Sarkar et al., 2009). However, whether any of these molecules causes activation of the CLEAR network remains to be demonstrated. To our knowledge, our current study provides the first example that a small molecule (K604) can promote autophagy in an mTOR-independent manner to activate the CLEAR network. We find that ACAT1 blockage increases autophagosome formation. At present, it is not clear how these events occur at the molecular level. A significant portion of ACAT1 is located at the mitochondria-associated ER membrane (MAM) (Area-Gomez et al., 2012), which was shown to be an origin for autophagosomes during starvation (Hamasaki et al., 2013). Therefore, it is possible that blocking ACAT1 facilitates autophagosome formation at MAM. We also find that ACAT1 blockage increases uptake of oligomeric Aβ1–42, and scavenger receptor(s), such as SRA and/or CD36, may be involved in this process. It is possible that ACAT1 blockage causes enhancement in recycling(s) of phagocytic receptor(s) that leads to increased internalization of Aβ1–42. Further investigations are needed to explore this possibility.
The accumulation of free cholesterol at the ER and other membranes could cause cytotoxicity to cells (Tabas, 2002). To guard against the buildup of intracellular free cholesterol, cells convert cholesterol to cholesterol esters by ACAT1 and ACAT2. When ACAT1 activity is blocked, cellular free cholesterol levels increase and cells eliminate excess cholesterol by delivering it to acceptors present in the cell exterior, such as high-density lipoprotein, apoAI, and other proteins that bind to cholesterol (Chang et al., 2006). It has been shown previously that, when cells were grown without any cholesterol acceptor present in the growth medium, blocking cellular cholesterol esterification by isotype-nonspecific ACAT inhibitors (that inhibit both ACAT1 and ACAT2) caused ER stress that led to cellular apoptosis (Feng et al., 2003). Our current results show that, when microglia are grown in medium that contain lipoproteins, blocking ACAT1 alone genetically or pharmacologically does not cause ER stress. It is possible that ER stress could only be induced when both of the cholesterol esterification enzymes are blocked and when minimal cholesterol acceptor(s) is present in the growth medium.
We show that agents that affect cholesterol biosynthesis can modulate the effect of ACAT1 blockage on lysosome volume. Specifically, our results show the following: (1) when cellular cholesterol level is at normal or high level, increased autophagosome formation caused by ACAT1 blockage promotes autophagic flux and leads to an increase in lysosome volume; and (2) when cholesterol biosynthesis is blocked by statin or by SSI, ACAT1 blockage still promotes autophagosome formation but fails to increase autophagic flux. Other investigators had reported that cholesterol depletion inhibits membrane fusion (Lang et al., 2001; Koga et al., 2010). Based on these findings, we hypothesize that, in addition to promoting autophagosome formation at the MAM, ACAT1 blockage increases the cholesterol content in the autophagosome and promotes fusion between autophagosome and lysosome (Fig. 13).
Figure 13.

A working model for the ACAT1 blockage-dependent increase in autophagy and lysosome biogenesis. ACAT1 blockage causes increases in autophagy flux and TFEB-mediated lysosome biogenesis in an mTOR/ER stress-independent manner. The effect of ACAT1 inhibition on lysosome biogenesis is sensitive to endogenous cholesterol biosynthesis. Increased autophagic flux may also result in higher levels of Aβ1–42 uptake in ACAT1-inhibited microglia.
In addition to synthesizing cholesterol, the brain also synthesizes a small amount of oxysterols, with 24S-hydroxycholesterol (24S-OH) being the major oxysterol (Lütjohann et al., 1996). 24S-OH is synthesized by the enzyme 24S-hydroxylase Cyp46A1 (Russell et al., 2009). We had previously shown that, in the 3XTg-AD mice, ACAT1 blockage causes a significant increase in the 24S-OH content in the brain (Bryleva et al., 2010). Under normal condition, Cyp46 A1 is a neuron-specific enzyme (Russell et al., 2009). However, at present, we cannot rule out the possibility that the effect of ACAT1 blockage in microglia described here involves an increase in 24S-OH because, when serious brain injuries occur, astrocytes and microglial cells can also express detectable levels of Cyp46A1 (Smiljanic et al., 2010).
For the past decade, a large amount of effort has been devoted to find agents that inhibit the biosynthesis of Aβ, with the most prominent agents being the β-secretase inhibitors and the γ-secrease inhibitors (Sisodia and St George-Hyslop, 2002; De Strooper et al., 2010). At present, these agents have yet to show efficacy in clinical trials. More recently, the need for agents that increase Aβ clearance have been emphasized (Brody and Holtzman, 2008). Our current findings suggest that ACAT1 blockage in combination with secretase inhibitors may provide benefits to AD patients in an additive manner. In AD neurons, autophagic vesicles accumulate extensively because of impaired fusion between autophagosomes and lysosomes (Boland et al., 2008). ACAT1 blockage may increase autophagy/lysosomal proteolysis in AD neurons. This possibility can be tested in the future. A common event that occurs in several prevalent neurodegenerative diseases, including AD, Parkinson's disease, frontotemporal dementia, etc., is the prominent presence of specific misfolded/aggregated proteins/peptides in certain regions of the CNS (Mizushima et al., 2008). The cellular clearance of misfolded/aggregated proteins/peptides involves autophagy-mediated lysosomal proteolysis (Mizushima et al., 2008). Our results suggest that blocking ACAT1 may provide a new way to benefit several neurodegenerative diseases in general.
Footnotes
This work was supported by National Institutes of Health Grant AG37609 to T.-Y.C. We thank Dr. Brent Berwin (Dartmouth) for helpful discussions and for providing CX3CR1/GFP+/+ mice; Dr. Patrick Dolph (Dartmouth) and Aya Shibuya (Dartmouth) for helpful discussions; Dr. William Hickey (Dartmouth) for providing N9 cells; Dr. Alireza Kheirollah (Dartmouth) for assistance with the brain injection; Dr. Maximillian Rogers (Dartmouth) for advice with qPCR experiments and with cholesterol/cholesterol ester analysis; members of the Chang laboratory at Dartmouth for stimulating discussions; and Dr. Tian Ma (Dartmouth) for careful editing of the manuscript.
The authors declare no competing financial interests.
References
- Abe-Dohmae S, Ikeda Y, Matsuo M, Hayashi M, Okuhira K, Ueda K, Yokoyama S. Human ABCA7 supports apolipoprotein-mediated release of cellular cholesterol and phospholipid to generate high density lipoprotein. J Biol Chem. 2004;279:604–611. doi: 10.1074/jbc.M309888200. [DOI] [PubMed] [Google Scholar]
- Area-Gomez E, Del Carmen Lara Castillo M, Tambini MD, Guardia-Laguarta C, de Groof AJ, Madra M, Ikenouchi J, Umeda M, Bird TD, Sturley SL, Schon EA. Upregulated function of mitochondria-associated ER membranes in Alzheimer disease. EMBO J. 2012;31:4106–4123. doi: 10.1038/emboj.2012.202. [DOI] [PMC free article] [PubMed] [Google Scholar]
- Balducci C, Beeg M, Stravalaci M, Bastone A, Sclip A, Biasini E, Tapella L, Colombo L, Manzoni C, Borsello T, Chiesa R, Gobbi M, Salmona M, Forloni G. Synthetic amyloid-β oligomers impair long-term memory independently of cellular prion protein. Proc Natl Acad Sci U S A. 2010;107:2295–2300. doi: 10.1073/pnas.0911829107. [DOI] [PMC free article] [PubMed] [Google Scholar]
- Bhattacharyya R, Barren C, Kovacs DM. Palmitoylation of amyloid precursor protein regulates amyloidogenic processing in lipid rafts. J Neurosci. 2013;33:11169–11183. doi: 10.1523/JNEUROSCI.4704-12.2013. [DOI] [PMC free article] [PubMed] [Google Scholar]
- Boland B, Kumar A, Lee S, Platt FM, Wegiel J, Yu WH, Nixon RA. Autophagy induction and autophagosome clearance in neurons: relationship to autophagic pathology in Alzheimer's disease. J Neurosci. 2008;28:6926–6937. doi: 10.1523/JNEUROSCI.0800-08.2008. [DOI] [PMC free article] [PubMed] [Google Scholar]
- Brewer GJ. Isolation and culture of adult rat hippocampal neurons. J Neurosci Methods. 1997;71:143–155. doi: 10.1016/S0165-0270(96)00136-7. [DOI] [PubMed] [Google Scholar]
- Brody DL, Holtzman DM. Active and passive immunotherapy for neurodegenerative disorders. Annu Rev Neurosci. 2008;31:175–193. doi: 10.1146/annurev.neuro.31.060407.125529. [DOI] [PMC free article] [PubMed] [Google Scholar]
- Brouillette J, Caillierez R, Zommer N, Alves-Pires C, Benilova I, Blum D, De Strooper B, Buée L. Neurotoxicity and memory deficits induced by soluble low-molecular-weight amyloid-β1–42 oligomers are revealed in vivo by using a novel animal model. J Neurosci. 2012;32:7852–7861. doi: 10.1523/JNEUROSCI.5901-11.2012. [DOI] [PMC free article] [PubMed] [Google Scholar]
- Bryleva EY, Rogers MA, Chang CC, Buen F, Harris BT, Rousselet E, Seidah NG, Oddo S, LaFerla FM, Spencer TA, Hickey WF, Chang TY. ACAT1 gene ablation increases 24(S)-hydroxycholesterol content in the brain and ameliorates amyloid pathology in mice with AD. Proc Natl Acad Sci U S A. 2010;107:3081–3086. doi: 10.1073/pnas.0913828107. [DOI] [PMC free article] [PubMed] [Google Scholar]
- Caccamo A, Majumder S, Richardson A, Strong R, Oddo S. Molecular interplay between mTOR, Aβ and tau: effects on cognitive impairments. J Biol Chem. 2010;285:13107–13120. doi: 10.1074/jbc.M110.100420. [DOI] [PMC free article] [PubMed] [Google Scholar]
- Chang CC, Chang TY. Cycloheximide sensitivity in regulation of acyl coenzyme A:cholesterol acyltransferase activity in Chinese hamster ovary cells: 2. Effect of sterol endogenously synthesized. Biochemistry. 1986;25:1700–1706. doi: 10.1021/bi00355a039. [DOI] [PubMed] [Google Scholar]
- Chang CC, Chen J, Thomas MA, Cheng D, Del Priore VA, Newton RS, Pape ME, Chang TY. Regulation and immunolocalization of acyl-coenzyme A:cholesterol acyltransferase in mammalian cells as studied with specific antibodies. J Biol Chem. 1995;270:29532–29540. doi: 10.1074/jbc.270.49.29532. [DOI] [PubMed] [Google Scholar]
- Chang TY, Chang CC, Cheng D. Acyl-coenzyme A:cholesterol acyltransferase. Annu Rev Biochem. 1997;66:613–638. doi: 10.1146/annurev.biochem.66.1.613. [DOI] [PubMed] [Google Scholar]
- Chang TY, Chang CC, Ohgami N, Yamauchi Y. Cholesterol sensing, trafficking, and esterification. Annu Rev Cell Dev Biol. 2006;22:129–157. doi: 10.1146/annurev.cellbio.22.010305.104656. [DOI] [PubMed] [Google Scholar]
- Chang TY, Li BL, Chang CC, Urano Y. Acyl-coenzyme A:cholesterol acyltransferases. Am J Physiol Endocrinol Metab. 2009;297:E1–E9. doi: 10.1152/ajpendo.90926.2008. [DOI] [PMC free article] [PubMed] [Google Scholar]
- Cheng J, Ohsaki Y, Tauchi-Sato K, Fujita A, Fujimoto T. Cholesterol depletion induces autophagy. Biochem Biophys Res Commun. 2006;351:246–252. doi: 10.1016/j.bbrc.2006.10.042. [DOI] [PubMed] [Google Scholar]
- Chiu IM, Morimoto ET, Goodarzi H, Liao JT, O'Keeffe S, Phatnani HP, Muratet M, Carroll MC, Levy S, Tavazoie S, Myers RM, Maniatis T. A neurodegeneration-specific gene-expression signature of acutely isolated microglia from an amyotrophic lateral sclerosis mouse model. Cell Rep. 2013;4:385–401. doi: 10.1016/j.celrep.2013.06.018. [DOI] [PMC free article] [PubMed] [Google Scholar]
- Christian AE, Haynes MP, Phillips MC, Rothblat GH. Use of cyclodextrins for manipulating cellular cholesterol content. J Lipid Res. 1997;38:2264–2272. [PubMed] [Google Scholar]
- Deane R, Sagare A, Hamm K, Parisi M, Lane S, Finn MB, Holtzman DM, Zlokovic BV. apoE isoform-specific disruption of amyloid β peptide clearance from mouse brain. J Clin Invest. 2008;118:4002–4013. doi: 10.1172/JCI36663. [DOI] [PMC free article] [PubMed] [Google Scholar]
- De Strooper B, Vassar R, Golde T. The secretases: enzymes with therapeutic potential in Alzheimer disease. Nat Rev Neurol. 2010;6:99–107. doi: 10.1038/nrneurol.2009.218. [DOI] [PMC free article] [PubMed] [Google Scholar]
- Erbay E, Babaev VR, Mayers JR, Makowski L, Charles KN, Snitow ME, Fazio S, Wiest MM, Watkins SM, Linton MF, Hotamisligil GS. Reducing endoplasmic reticulum stress through a macrophage lipid chaperone alleviates atherosclerosis. Nat Med. 2009;15:1383–1391. doi: 10.1038/nm.2067. [DOI] [PMC free article] [PubMed] [Google Scholar]
- Fagan AM, Holtzman DM, Munson G, Mathur T, Schneider D, Chang LK, Getz GS, Reardon CA, Lukens J, Shah JA, LaDu MJ. Unique lipoproteins secreted by primary astrocytes from wild type, apoE (−/−), and human apoE transgenic mice. J Biol Chem. 1999;274:30001–30007. doi: 10.1074/jbc.274.42.30001. [DOI] [PubMed] [Google Scholar]
- Feng B, Yao PM, Li Y, Devlin CM, Zhang D, Harding HP, Sweeney M, Rong JX, Kuriakose G, Fisher EA, Marks AR, Ron D, Tabas I. The endoplasmic reticulum is the site of cholesterol-induced cytotoxicity in macrophages. Nat Cell Biol. 2003;5:781–792. doi: 10.1038/ncb1035. [DOI] [PubMed] [Google Scholar]
- Frenkel D, Wilkinson K, Zhao L, Hickman SE, Means TK, Puckett L, Farfara D, Kingery ND, Weiner HL, El Khoury J. Scara1 deficiency impairs clearance of soluble amyloid-β by mononuclear phagocytes and accelerates Alzheimer's-like disease progression. Nat Commun. 2013;4:2030. doi: 10.1038/ncomms3030. [DOI] [PMC free article] [PubMed] [Google Scholar]
- Goldstein JL, Brown MS. Regulation of the mevalonate pathway. Nature. 1990;343:425–430. doi: 10.1038/343425a0. [DOI] [PubMed] [Google Scholar]
- Griciuc A, Serrano-Pozo A, Parrado AR, Lesinski AN, Asselin CN, Mullin K, Hooli B, Choi SH, Hyman BT, Tanzi RE. Alzheimer's disease risk gene CD33 inhibits microglial uptake of amyloid beta. Neuron. 2013;78:631–643. doi: 10.1016/j.neuron.2013.04.014. [DOI] [PMC free article] [PubMed] [Google Scholar]
- Guertin DA, Sabatini DM. The pharmacology of mTOR inhibition. Sci Signal. 2009;2:pe24. doi: 10.1126/scisignal.267pe24. [DOI] [PubMed] [Google Scholar]
- Hamasaki M, Furuta N, Matsuda A, Nezu A, Yamamoto A, Fujita N, Oomori H, Noda T, Haraguchi T, Hiraoka Y, Amano A, Yoshimori T. Autophagosomes form at ER-mitochondria contact sites. Nature. 2013;495:389–393. doi: 10.1038/nature11910. [DOI] [PubMed] [Google Scholar]
- Hamazaki H. Cathepsin D is involved in the clearance of Alzheimer's β-amyloid protein. FEBS Lett. 1996;396:139–142. doi: 10.1016/0014-5793(96)01087-3. [DOI] [PubMed] [Google Scholar]
- Hartmann T, Kuchenbecker J, Grimm MO. Alzheimer's disease: the lipid connection. J Neurochem. 2007;103:159–170. doi: 10.1111/j.1471-4159.2007.04715.x. [DOI] [PubMed] [Google Scholar]
- Heider JG, Boyett RL. The picomole determination of free and total cholesterol in cells in culture. J Lipid Res. 1978;19:514–518. [PubMed] [Google Scholar]
- Hickman SE, Allison EK, El Khoury J. Microglial dysfunction and defective β-amyloid clearance pathways in aging Alzheimer's disease mice. J Neurosci. 2008;28:8354–8360. doi: 10.1523/JNEUROSCI.0616-08.2008. [DOI] [PMC free article] [PubMed] [Google Scholar]
- Hutter-Paier B, Huttunen HJ, Puglielli L, Eckman CB, Kim DY, Hofmeister A, Moir RD, Domnitz SB, Frosch MP, Windisch M, Kovacs DM. The ACAT inhibitor CP-113818 markedly reduces amyloid pathology in a mouse model of Alzheimer's disease. Neuron. 2004;44:227–238. doi: 10.1016/j.neuron.2004.08.043. [DOI] [PubMed] [Google Scholar]
- Huttunen HJ, Havas D, Peach C, Barren C, Duller S, Xia W, Frosch MP, Hutter-Paier B, Windisch M, Kovacs DM. The acyl-coenzyme A:cholesterol acyltransferase inhibitor CI-1011 reverses diffuse brain amyloid pathology in aged amyloid precursor protein transgenic mice. J Neuropathol Exp Neurol. 2010;69:777–788. doi: 10.1097/NEN.0b013e3181e77ed9. [DOI] [PMC free article] [PubMed] [Google Scholar]
- Ikenoya M, Yoshinaka Y, Kobayashi H, Kawamine K, Shibuya K, Sato F, Sawanobori K, Watanabe T, Miyazaki A. A selective ACAT-1 inhibitor, K-604, suppresses fatty streak lesions in fat-fed hamsters without affecting plasma cholesterol levels. Atherosclerosis. 2007;191:290–297. doi: 10.1016/j.atherosclerosis.2006.05.048. [DOI] [PubMed] [Google Scholar]
- Iwamoto N, Abe-Dohmae S, Sato R, Yokoyama S. ABCA7 expression is regulated by cellular cholesterol through the SREBP2 pathway and associated with phagocytosis. J Lipid Res. 2006;47:1915–1927. doi: 10.1194/jlr.M600127-JLR200. [DOI] [PubMed] [Google Scholar]
- Jiang Q, Lee CY, Mandrekar S, Wilkinson B, Cramer P, Zelcer N, Mann K, Lamb B, Willson TM, Collins JL, Richardson JC, Smith JD, Comery TA, Riddell D, Holtzman DM, Tontonoz P, Landreth GE. ApoE promotes the proteolytic degradation of Aβ. Neuron. 2008;58:681–693. doi: 10.1016/j.neuron.2008.04.010. [DOI] [PMC free article] [PubMed] [Google Scholar]
- Jung S, Aliberti J, Graemmel P, Sunshine MJ, Kreutzberg GW, Sher A, Littman DR. Analysis of fractalkine receptor CX3CR1 function by targeted deletion and green fluorescent protein reporter gene insertion. Mol Cell Biol. 2000;20:4106–4114. doi: 10.1128/MCB.20.11.4106-4114.2000. [DOI] [PMC free article] [PubMed] [Google Scholar]
- Jungbauer LM, Yu C, Laxton KJ, LaDu MJ. Preparation of fluorescently-labeled amyloid-beta peptide assemblies: the effect of fluorophore conjugation on structure and function. J Mol Recognit. 2009;22:403–413. doi: 10.1002/jmr.948. [DOI] [PMC free article] [PubMed] [Google Scholar]
- Katunuma N. Posttranslational processing and modification of cathepsins and cystatins. J Signal Transduct. 2010;2010:375345. doi: 10.1155/2010/375345. [DOI] [PMC free article] [PubMed] [Google Scholar]
- Kawarabayashi T, Younkin LH, Saido TC, Shoji M, Ashe KH, Younkin SG. Age-dependent changes in brain, CSF, and plasma amyloid β protein in the Tg2576 transgenic mouse model of Alzheimer's disease. J Neurosci. 2001;21:372–381. doi: 10.1523/JNEUROSCI.21-02-00372.2001. [DOI] [PMC free article] [PubMed] [Google Scholar]
- Kim WS, Li H, Ruberu K, Chan S, Elliott DA, Low JK, Cheng D, Karl T, Garner B. Deletion of Abca7 increases cerebral amyloid-β accumulation in the J20 mouse model of Alzheimer's disease. J Neurosci. 2013;33:4387–4394. doi: 10.1523/JNEUROSCI.4165-12.2013. [DOI] [PMC free article] [PubMed] [Google Scholar]
- Koffie RM, Meyer-Luehmann M, Hashimoto T, Adams KW, Mielke ML, Garcia-Alloza M, Micheva KD, Smith SJ, Kim ML, Lee VM, Hyman BT, Spires-Jones TL. Oligomeric amyloid beta associates with postsynaptic densities and correlates with excitatory synapse loss near senile plaques. Proc Natl Acad Sci U S A. 2009;106:4012–4017. doi: 10.1073/pnas.0811698106. [DOI] [PMC free article] [PubMed] [Google Scholar]
- Koga H, Kaushik S, Cuervo AM. Altered lipid content inhibits autophagic vesicular fusion. FASEB J. 2010;24:3052–3065. doi: 10.1096/fj.09-144519. [DOI] [PMC free article] [PubMed] [Google Scholar]
- Lang T, Bruns D, Wenzel D, Riedel D, Holroyd P, Thiele C, Jahn R. SNAREs are concentrated in cholesterol-dependent clusters that define docking and fusion sites for exocytosis. EMBO J. 2001;20:2202–2213. doi: 10.1093/emboj/20.9.2202. [DOI] [PMC free article] [PubMed] [Google Scholar]
- Laplante M, Sabatini DM. mTOR signaling in growth control and disease. Cell. 2012;149:274–293. doi: 10.1016/j.cell.2012.03.017. [DOI] [PMC free article] [PubMed] [Google Scholar]
- Lee CYD, Landreth GE. The role of microglia in amyloid clearance from the AD brain. J Neural Transm 1996. 2010;117:949–960. doi: 10.1007/s00702-010-0433-4. [DOI] [PMC free article] [PubMed] [Google Scholar]
- Lee CY, Tse W, Smith JD, Landreth GE. Apolipoprotein E promotes β-amyloid trafficking and degradation by modulating microglial cholesterol levels. J Biol Chem. 2012;287:2032–2044. doi: 10.1074/jbc.M111.295451. [DOI] [PMC free article] [PubMed] [Google Scholar]
- Lublin AL, Gandy S. Amyloid-β oligomers: possible roles as key neurotoxins in Alzheimer's disease. Mt Sinai J Med J Transl Pers Med. 2010;77:43–49. doi: 10.1002/msj.20160. [DOI] [PMC free article] [PubMed] [Google Scholar]
- Lucin KM, O'Brien CE, Bieri G, Czirr E, Mosher KI, Abbey RJ, Mastroeni DF, Rogers J, Spencer B, Masliah E, Wyss-Coray T. Microglial beclin 1 regulates retromer trafficking and phagocytosis and is impaired in Alzheimer's disease. Neuron. 2013;79:873–886. doi: 10.1016/j.neuron.2013.06.046. [DOI] [PMC free article] [PubMed] [Google Scholar]
- Lütjohann D, Breuer O, Ahlborg G, Nennesmo I, Sidén A, Diczfalusy U, Björkhem I. Cholesterol homeostasis in human brain: evidence for an age-dependent flux of 24S-hydroxycholesterol from the brain into the circulation. Proc Natl Acad Sci U S A. 1996;93:9799–9804. doi: 10.1073/pnas.93.18.9799. [DOI] [PMC free article] [PubMed] [Google Scholar]
- Mandrekar S, Jiang Q, Lee CY, Koenigsknecht-Talboo J, Holtzman DM, Landreth GE. Microglia mediate the clearance of soluble Aβ through fluid phase macropinocytosis. J Neurosci. 2009;29:4252–4262. doi: 10.1523/JNEUROSCI.5572-08.2009. [DOI] [PMC free article] [PubMed] [Google Scholar]
- Masters CL, Selkoe DJ. Biochemistry of amyloid β-protein and amyloid deposits in Alzheimer disease. Cold Spring Harb Perspect Med. 2012;2:a006262. doi: 10.1101/cshperspect.a006262. [DOI] [PMC free article] [PubMed] [Google Scholar]
- Meiner VL, Cases S, Myers HM, Sande ER, Bellosta S, Schambelan M, Pitas RE, McGuire J, Herz J, Farese RV., Jr Disruption of the acyl-CoA:cholesterol acyltransferase gene in mice: evidence suggesting multiple cholesterol esterification enzymes in mammals. Proc Natl Acad Sci U S A. 1996;93:14041–14046. doi: 10.1073/pnas.93.24.14041. [DOI] [PMC free article] [PubMed] [Google Scholar]
- Mizushima N. Autophagy: process and function. Genes Dev. 2007;21:2861–2873. doi: 10.1101/gad.1599207. [DOI] [PubMed] [Google Scholar]
- Mizushima N, Yoshimori T. How to interpret LC3 immunoblotting. Autophagy. 2007;3:542–545. doi: 10.4161/auto.4600. [DOI] [PubMed] [Google Scholar]
- Mizushima N, Yamamoto A, Hatano M, Kobayashi Y, Kabeya Y, Suzuki K, Tokuhisa T, Ohsumi Y, Yoshimori T. Dissection of autophagosome formation using Apg5-deficient mouse embryonic stem cells. J Cell Biol. 2001;152:657–668. doi: 10.1083/jcb.152.4.657. [DOI] [PMC free article] [PubMed] [Google Scholar]
- Mizushima N, Levine B, Cuervo AM, Klionsky DJ. Autophagy fights disease through cellular self-digestion. Nature. 2008;451:1069–1075. doi: 10.1038/nature06639. [DOI] [PMC free article] [PubMed] [Google Scholar]
- Mizushima N, Yoshimori T, Levine B. Methods in mammalian autophagy research. Cell. 2010;140:313–326. doi: 10.1016/j.cell.2010.01.028. [DOI] [PMC free article] [PubMed] [Google Scholar]
- Mueller-Steiner S, Zhou Y, Arai H, Roberson ED, Sun B, Chen J, Wang X, Yu G, Esposito L, Mucke L, Gan L. Antiamyloidogenic and neuroprotective functions of cathepsin B: implications for Alzheimer's disease. Neuron. 2006;51:703–714. doi: 10.1016/j.neuron.2006.07.027. [DOI] [PubMed] [Google Scholar]
- Murakami T, Saito A, Hino S, Kondo S, Kanemoto S, Chihara K, Sekiya H, Tsumagari K, Ochiai K, Yoshinaga K, Saitoh M, Nishimura R, Yoneda T, Kou I, Furuichi T, Ikegawa S, Ikawa M, Okabe M, Wanaka A, Imaizumi K. Signalling mediated by the endoplasmic reticulum stress transducer OASIS is involved in bone formation. Nat Cell Biol. 2009;11:1205–1211. doi: 10.1038/ncb1963. [DOI] [PubMed] [Google Scholar]
- Murphy SR, Chang CC, Dogbevia G, Bryleva EY, Bowen Z, Hasan MT, Chang TY. Acat1 knockdown gene therapy decreases amyloid-β in a mouse model of Alzheimer's disease. Mol Ther. 2013;21:1497–1506. doi: 10.1038/mt.2013.118. [DOI] [PMC free article] [PubMed] [Google Scholar]
- Nikodemova M, Watters JJ. Efficient isolation of live microglia with preserved phenotypes from adult mouse brain. J Neuroinflammation. 2012;9:147. doi: 10.1186/1742-2094-9-147. [DOI] [PMC free article] [PubMed] [Google Scholar]
- Oddo S, Caccamo A, Shepherd JD, Murphy MP, Golde TE, Kayed R, Metherate R, Mattson MP, Akbari Y, LaFerla FM. Triple-transgenic model of Alzheimer's disease with plaques and tangles: intracellular Aβ and synaptic dysfunction. Neuron. 2003;39:409–421. doi: 10.1016/S0896-6273(03)00434-3. [DOI] [PubMed] [Google Scholar]
- Ogata M, Hino S, Saito A, Morikawa K, Kondo S, Kanemoto S, Murakami T, Taniguchi M, Tanii I, Yoshinaga K, Shiosaka S, Hammarback JA, Urano F, Imaizumi K. Autophagy is activated for cell survival after endoplasmic reticulum stress. Mol Cell Biol. 2006;26:9220–9231. doi: 10.1128/MCB.01453-06. [DOI] [PMC free article] [PubMed] [Google Scholar]
- Puglielli L, Konopka G, Pack-Chung E, Ingano LA, Berezovska O, Hyman BT, Chang TY, Tanzi RE, Kovacs DM. Acyl-coenzyme A: cholesterol acyltransferase modulates the generation of the amyloid β-peptide. Nat Cell Biol. 2001;3:905–912. doi: 10.1038/ncb1001-905. [DOI] [PubMed] [Google Scholar]
- Reid PC, Lin S, Vanier MT, Ohno-Iwashita Y, Harwood HJ, Jr, Hickey WF, Chang CC, Chang TY. Partial blockage of sterol biosynthesis with a squalene synthase inhibitor in early postnatal Niemann-Pick type C npcnih null mice brains reduces neuronal cholesterol accumulation, abrogates astrogliosis, but may inhibit myelin maturation. J Neurosci Methods. 2008;168:15–25. doi: 10.1016/j.jneumeth.2007.09.002. [DOI] [PMC free article] [PubMed] [Google Scholar]
- Roudier E, Mistafa O, Stenius U. Statins induce mammalian target of rapamycin (mTOR)-mediated inhibition of Akt signaling and sensitize p53-deficient cells to cytostatic drugs. Mol Cancer Ther. 2006;5:2706–2715. doi: 10.1158/1535-7163.MCT-06-0352. [DOI] [PubMed] [Google Scholar]
- Russell DW, Halford RW, Ramirez DM, Shah R, Kotti T. Cholesterol 24-hydroxylase: an enzyme of cholesterol turnover in the brain. Annu Rev Biochem. 2009;78:1017–1040. doi: 10.1146/annurev.biochem.78.072407.103859. [DOI] [PMC free article] [PubMed] [Google Scholar]
- Saftig P, Klumperman J. Lysosome biogenesis and lysosomal membrane proteins: trafficking meets function. Nat Rev Mol Cell Biol. 2009;10:623–635. doi: 10.1038/nrm2745. [DOI] [PubMed] [Google Scholar]
- Sardiello M, Palmieri M, di Ronza A, Medina DL, Valenza M, Gennarino VA, Di Malta C, Donaudy F, Embrione V, Polishchuk RS, Banfi S, Parenti G, Cattaneo E, Ballabio A. A gene network regulating lysosomal biogenesis and function. Science. 2009;325:473–477. doi: 10.1126/science.1174447. [DOI] [PubMed] [Google Scholar]
- Sarkar S, Ravikumar B, Floto RA, Rubinsztein DC. Rapamycin and mTOR-independent autophagy inducers ameliorate toxicity of polyglutamine-expanded huntingtin and related proteinopathies. Cell Death Differ. 2009;16:46–56. doi: 10.1038/cdd.2008.110. [DOI] [PubMed] [Google Scholar]
- Saura J, Tusell JM, Serratosa J. High-yield isolation of murine microglia by mild trypsinization. Glia. 2003;44:183–189. doi: 10.1002/glia.10274. [DOI] [PubMed] [Google Scholar]
- Schägger H. Tricine-SDS-PAGE. Nat Protoc. 2006;1:16–22. doi: 10.1038/nprot.2006.4. [DOI] [PubMed] [Google Scholar]
- Settembre C, Di Malta C, Polito VA, Garcia Arencibia M, Vetrini F, Erdin S, Erdin SU, Huynh T, Medina D, Colella P, Sardiello M, Rubinsztein DC, Ballabio A. TFEB links autophagy to lysosomal biogenesis. Science. 2011;332:1429–1433. doi: 10.1126/science.1204592. [DOI] [PMC free article] [PubMed] [Google Scholar]
- Settembre C, Zoncu R, Medina DL, Vetrini F, Erdin S, Erdin S, Huynh T, Ferron M, Karsenty G, Vellard MC, Facchinetti V, Sabatini DM, Ballabio A. A lysosome-to-nucleus signalling mechanism senses and regulates the lysosome via mTOR and TFEB. EMBO J. 2012;31:1095–1108. doi: 10.1038/emboj.2012.32. [DOI] [PMC free article] [PubMed] [Google Scholar]
- Shankar GM, Li S, Mehta TH, Garcia-Munoz A, Shepardson NE, Smith I, Brett FM, Farrell MA, Rowan MJ, Lemere CA, Regan CM, Walsh DM, Sabatini BL, Selkoe DJ. Amyloid-β protein dimers isolated directly from Alzheimer's brains impair synaptic plasticity and memory. Nat Med. 2008;14:837–842. doi: 10.1038/nm1782. [DOI] [PMC free article] [PubMed] [Google Scholar]
- Sisodia SS, St George-Hyslop PH. γ-Secretase, notch, Aβ and Alzheimer's disease: where do the presenilins fit in? Nat Rev Neurosci. 2002;3:281–290. doi: 10.1038/nrn785. [DOI] [PubMed] [Google Scholar]
- Smiljanic K, Lavrnja I, Mladenovic Djordjevic A, Ruzdijic S, Stojiljkovic M, Pekovic S, Kanazir S. Brain injury induces cholesterol 24-hydroxylase (Cyp46) expression in glial cells in a time-dependent manner. Histochem Cell Biol. 2010;134:159–169. doi: 10.1007/s00418-010-0718-6. [DOI] [PubMed] [Google Scholar]
- Spilman P, Podlutskaya N, Hart MJ, Debnath J, Gorostiza O, Bredesen D, Richardson A, Strong R, Galvan V. Inhibition of mTOR by rapamycin abolishes cognitive deficits and reduces amyloid-β levels in a mouse model of Alzheimer's disease. PLoS One. 2010;5:e9979. doi: 10.1371/journal.pone.0009979. [DOI] [PMC free article] [PubMed] [Google Scholar]
- Stansley B, Post J, Hensley K. A comparative review of cell culture systems for the study of microglial biology in Alzheimer's disease. J Neuroinflammation. 2012;9:115. doi: 10.1186/1742-2094-9-115. [DOI] [PMC free article] [PubMed] [Google Scholar]
- Stine WB, Jr, Dahlgren KN, Krafft GA, LaDu MJ. In vitro characterization of conditions for amyloid-β peptide oligomerization and fibrillogenesis. J Biol Chem. 2003;278:11612–11622. doi: 10.1074/jbc.M210207200. [DOI] [PubMed] [Google Scholar]
- Stukas S, Robert J, Wellington CL. High-density lipoproteins and cerebrovascular integrity in Alzheimer's disease. Cell Metab. 2014;19:574–591. doi: 10.1016/j.cmet.2014.01.003. [DOI] [PubMed] [Google Scholar]
- Tabas I. Consequences of cellular cholesterol accumulation: basic concepts and physiological implications. J Clin Invest. 2002;110:905–911. doi: 10.1172/JCI16452. [DOI] [PMC free article] [PubMed] [Google Scholar]
- Terwel D, Steffensen KR, Verghese PB, Kummer MP, Gustafsson JÅ, Holtzman DM, Heneka MT. Critical role of astroglial apolipoprotein E and liver X receptor-α expression for microglial Aβ phagocytosis. J Neurosci. 2011;31:7049–7059. doi: 10.1523/JNEUROSCI.6546-10.2011. [DOI] [PMC free article] [PubMed] [Google Scholar]
- Yamanaka M, Ishikawa T, Griep A, Axt D, Kummer MP, Heneka MT. PPARγ/RXRα-induced and CD36-mediated microglial amyloid-β phagocytosis results in cognitive improvement in amyloid precursor protein/presenilin 1 mice. J Neurosci. 2012;32:17321–17331. doi: 10.1523/JNEUROSCI.1569-12.2012. [DOI] [PMC free article] [PubMed] [Google Scholar]
- Yamauchi Y, Chang CC, Hayashi M, Abe-Dohmae S, Reid PC, Chang TY, Yokoyama S. Intracellular cholesterol mobilization involved in the ABCA1/apolipoprotein-mediated assembly of high density lipoprotein in fibroblasts. J Lipid Res. 2004;45:1943–1951. doi: 10.1194/jlr.M400264-JLR200. [DOI] [PubMed] [Google Scholar]
- Yang CN, Shiao YJ, Shie FS, Guo BS, Chen PH, Cho CY, Chen YJ, Huang FL, Tsay HJ. Mechanism mediating oligomeric Aβ clearance by naïve primary microglia. Neurobiol Dis. 2011;42:221–230. doi: 10.1016/j.nbd.2011.01.005. [DOI] [PubMed] [Google Scholar]
- Yoshida H, Matsui T, Yamamoto A, Okada T, Mori K. XBP1 mRNA is induced by ATF6 and spliced by IRE1 in response to ER stress to produce a highly active transcription factor. Cell. 2001;107:881–891. doi: 10.1016/S0092-8674(01)00611-0. [DOI] [PubMed] [Google Scholar]
- Yoshimori T, Yamamoto A, Moriyama Y, Futai M, Tashiro Y. Bafilomycin A1, a specific inhibitor of vacuolar-type H(+)-ATPase, inhibits acidification and protein degradation in lysosomes of cultured cells. J Biol Chem. 1991;266:17707–17712. [PubMed] [Google Scholar]
- Zelcer N, Tontonoz P. Liver X receptors as integrators of metabolic and inflammatory signaling. J Clin Invest. 2006;116:607–614. doi: 10.1172/JCI27883. [DOI] [PMC free article] [PubMed] [Google Scholar]
- Zhou J, Tan SH, Nicolas V, Bauvy C, Yang ND, Zhang J, Xue Y, Codogno P, Shen HM. Activation of lysosomal function in the course of autophagy via mTORC1 suppression and autophagosome-lysosome fusion. Cell Res. 2013;23:508–523. doi: 10.1038/cr.2013.11. [DOI] [PMC free article] [PubMed] [Google Scholar]