

Abstract
We have established a transgenic model to facilitate the study of stress-induced gene regulation in the hypothalamus. This model, which uses a human proenkephalin-β-galactosidase fusion gene, readily permits anatomic and cellular colocalization of stress-regulated immediate early gene products (e.g. Fos) and other transcription factors [e.g. cAMP response element-binding protein (CREB)] with the product of a potential target gene. Moreover, Fos provides a marker of cellular activation that is independent of the transgene. Hypertonic saline stress induced Fos in almost all cells in the PVN that exhibited basal expression of the proenkephalin transgene; however, all cells in which the transgene was activated by stress also expressed Fos. CREB was found in essentially all neurons. Gel shift analysis with and without antisera to Fos and CREB showed that AP-1 binding activity, containing Fos protein, was induced by hyperosmotic stress. However, Fos was not detected binding to the proenkephalin second messenger-inducible enhancer even in hypothalamic cell extracts from stressed animals. In contrast, CREB formed specific complexes with both the proenkephalin enhancer and a cAMP- and calcium-regulated element (CaRE) within the c-fos gene. Moreover, we found that hypertonic saline induced CREB phosphorylation in cells that express the transgene within the paraventricular nucleus and supraoptic nucleus. These results suggest a model in which proenkephalin gene expression in the paraventricular nucleus is regulated by CREB in response to hypertonic stress.
INTRODUCTION
The DNA elements within the human proenkephalin gene that confer responsiveness to second messengers and membrane depolarization have been well characterized (1–8). To obtain uniform cells for transfection, however, the critical studies of transcriptional mechanism have largely used transformed cell lines (1–7), rather than tissues in vivo. To study transcriptional control of the proenkephalin gene in vivo, we have produced a transgenic mouse model in which human proenkephalin gene regulatory sequences (3 kilobases of 5′-flanking sequences, the first exon and intron, and 1.2 kilobases of 3′-flanking sequences) direct expression of the reporter gene, Escherichia coli β-galactosidase (9, 10).
Proenkephalin gene expression is strongly activated within the paraventricular (PVN) and supraoptic (SON) nuclei of the rat hypothalamus by hyperosmotic stress (11–13). We have established in the ENK 1.1 line of transgenic mice that basal expression of the transgene and induction by hypertonic saline injection closely parallel expression of the mouse endogenous proenkephalin gene and the regulation previously reported for the rat (10). The endogenous gene and the transgene contain similar genomic regulatory sequences, but express entirely different mRNAs; thus, the observation that they are induced in parallel is consistent with the hypothesis that stress activation of proenkephalin gene expression occurs at the transcriptional level (10).
The DNA regulatory element that has been shown to be required for regulation of the proenkephalin gene by cAMP, depolarization, and calcium entry is the proenkephalin CRE-2 element that contains the sequence TGCGTCA (4, 2, 6). This element can bind both AP-1 proteins (4, 5, 7) and cAMP response element-binding protein (CREB) (8). In cotransfection models, the proenkephalin gene can be transactivated by AP-1 proteins, including Fos (5) and JunD (7) and by CREB (14), acting via the CRE-2 element (Ref. 7 and additional data not shown). The proenkephalin CRE-2 element is similar in sequence to the calcium response element (CaRE) (TGACGTTT) found 60 bases up-stream of the transcription start site within the c-fos gene (15, 16). The CaRE element contains a nonpalindromic form of the canonical CGTCA motif of cAMP regulatory elements (2, 17) on its complementary strand. Like the proenkephalin CRE-2 element, it confers responsiveness to both cAMP and Ca2+ on its gene (15, 16).
Here we exploit the power of our transgenic model to colocalize the reporter gene product, by β-galactosidase histochemistry, with the protein products of candidate transcriptional regulators, as determined by immunohistochemistry on the same section. We find that both Fos induction and CREB phosphorylation occur in response to hyperosmotic stress in neurons that express the transgene. However, in hypothalamic cell extracts, the predominant CRE-2 and CaRE DNA-binding activities consist of CREB-like proteins, with no Fos binding detected. These findings suggest the hypothesis that proenkephalin and c-fos gene expression are coregulated by CREB in response to hyperosmotic stress.
RESULTS
Induction of the Transgene and c-Fos in the PVN by Hypertonic Saline Stress
Six hours after an ip injection of hypertonic (1.5 M) saline, expression of the proenkephalin-β-galactosidase transgene is markedly induced within the PVN (Fig. 1). Induction of transgene expression is revealed by filling of cells with the blue β-galactosidase reaction product, whereas basal expression is apparent as small blue puncta within cells (10). To evaluate the relationship between transgene induction and Fos, a candidate regulator of proenkephalin gene expression (5) and an immediate early gene marker of cellular activation, we examined the effects of acute hypertonic saline stress on the expression of Fos in the PVN. As determined by immunohistochemistry with an antiserum specific for Fos, Fos is markedly induced by 1 h (Fig. 2B), and levels decline slowly, so that 6 h after the stressor there is still a significantly greater level of expression than under basal conditions (Fig. 2, C–F). A similar pattern of Fos induction has been described in the rat (18). In mice injected with normal (0.15 M) saline, there is a minimal induction of c-fos expression at 1 h (Fig. 2A), presumably due to the stress of handling, but little or no expression at either 3 or 6 h (Fig. 2, C and E). On the basis of this time course, we chose a 6 h point for experiments aimed at colocalizing Fos with the transgene, because transgene induction is already marked (although not maximal) at this time (10). Six hours after the injection of hypertonic saline, there was robust induction of both Fos and the transgene within the PVN (Fig. 3). In contrast, after the injection of normal saline, there was minimal induction of Fos or the transgene in the PVN (Figs. 4A and 5). After this stressor, Fos and the transgene were expressed in approximately the same number of cells within the PVN, almost all colocalized (Fig. 5). With hypertonic saline stress, filling of cells with the β-galactosidase reaction product was observed within the PVN, including filling of processes (10). All filled cells, which represent approximately 10% of the total β-galactosidase-positive cells (10), were also positive for Fos protein (Fig. 4, C and D). There were also cells that expressed the transgene at low levels (equivalent to or barely greater than basal), but did not express Fos at this time point (Figs. 4D and 5). It was impossible to determine whether Fos had been activated in such cells at an earlier time. However, all cells that demonstrated a robust induction of the transgene also expressed Fos.
Fig. 1. Induction of the Transgene in the PVN of the Hypothalamus.

Panels show 50-μm sections taken every 100 μm from rostral to caudal portions of the PVN stained for β-galactosidase activity. The panel on the left shows sections from a control mouse killed 6 h after an ip injection of normal (0.15 M) saline. The panel on the right is from a mouse killed 6 h after an ip injection of hypertonic (1.5 M) saline. Note the filling of neurons within the PVN with the β-galactosidase reaction produced after the 1.5-M saline injection. Magnification: horizontal bar = 250 μm.
Fig. 2. Time Course of Fos Induction in the PVN after Hypertonic Saline Stress.

The sections shown are from mice that received an ip injection of either normal (0.15 M) saline (A, C, and E) or hypertonic (1.5 M; B, D, and F) saline and were killed after 1 h (A and B), 3 h (C and D), or 6 h (E and F). Minimal induction was observed after 1 h in the control animals (A), presumably due to the stress of handling. Magnification: horizontal bar = 100 μm.
Fig. 3. Regional Distribution of Transgene and Fos Expression in the PVN after Hypertonic Stress.
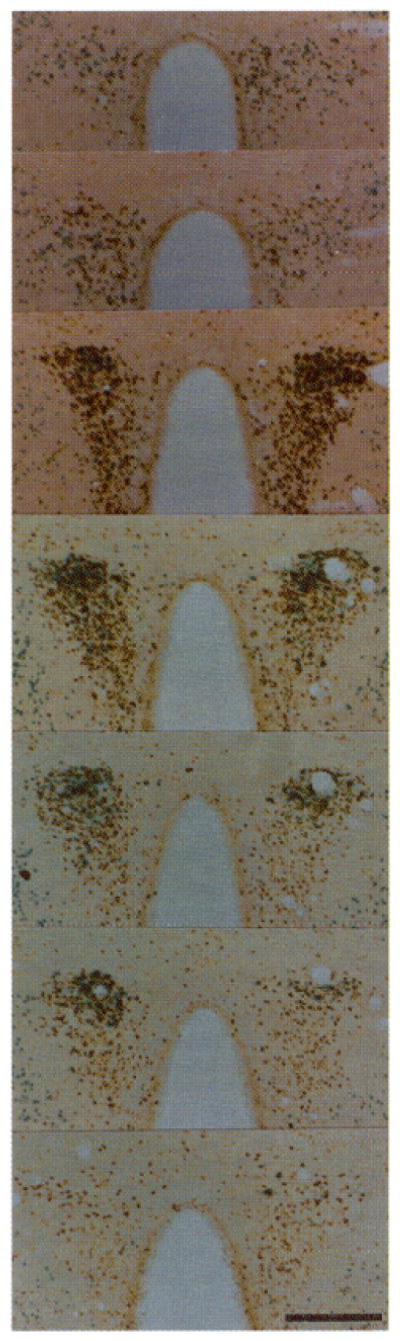
Serial sections (50 μm) taken every 100 μm are shown from rostral (top) to caudal (bottom) regions of the PVN stained for β-galactosidase activity and Fos immunoreactivity 6 h after hypertonic saline. The enhanced intensity of Fos staining seen in the double labeling experiments appears to result from processing sections through the X-Gal solution (see Materials and Methods). Magnification: horizontal bar = 250 μm.
Fig. 4. Colocalization of Transgene Expression with Fos.

All sections are stained for β-galactosidase activity and Fos immunoreactivity in animals killed 6 h after normal saline (A) or hypertonic saline (B–D) injection. A dramatic example of colocalization (horizontal arrow) is shown in C and at higher magnification in D, illustrating the staining of the nucleus for Fos and the cytoplasm (including a process) for β-galactosidase activity. Also shown in D are additional cells in which colocalization of Fos with the transgene is observed (curved arrows) or not present (vertical small arrows). Magnification: horizontal bars = 100 μm (A and B), 50 μm (C), and 10 μm (D).
Fig. 5. Quantitative Analysis of Colocalization of β-Galactosidase and Fos in the PVN.

The graph shows the number of cells staining positively for Fos, β-Gal, or both in the PVN 6 h after a 1.5-M saline injection. Tissue sections were processed for Fos alone (left histograms), β-galactosidase alone (middle histograms), or colocalized for both products (right histograms). On the right of the graph, analysis of the total number of colocalized cells (β + F), cells only positive for β-Gal (β), and cells only positive for Fos (F) is shown (mean ± SEM; n = 4 in all cases derived from similar sections through the PVN). Note that the number of cells that do not colocalize is extremely small. There is no statistically significant difference among the three groups (β, F, and β+F) by Student’s t test. The graph does not reflect the number of induced (filled) cells (see text).
Colocalization of the Transgene with CREB
CREB has been implicated as a regulator of both proenkephalin (8) and c-fos gene expression (16). To determine the localization of CREB within the PVN with respect to cells expressing the transgene, we performed combined β-galactosidase histochemistry with immunocytochemistry for CREB. CREB protein was found in essentially all cells within the PVN under basal conditions (not shown) or after hypertonic saline injection (Fig. 6). No differences in CREB protein levels could be observed by immunohistochemistry in uninjected, normal saline-injected, or hypertonic saline-injected mice.
Fig. 6. Colocalization of Transgene Expression with CREB.

The section, shown at low magnification (A) and high magnification (B), was stained for β-galactosidase activity and CREB immunoreactivity. It shows colocalization of transgene expression with CREB protein within the PVN 20 min after an ip injection of hypertonic saline. Essentially all cells that express β-galactosidase also express CREB; in fact, CREB appears to be expressed within all cells in the section. There were no differences in staining among uninjected and 0.15-and 1.5-M saline injections. Magnification: horizontal bars = 50 μm (A) and 10 μm (B).
Effects of Hypertonic Stress on CREB and Fos Binding to AP-1, CRE-2, and CaRE Oligonucleotides
Fos protein was induced by stress in nearly all cells in the PVN that expressed the transgene (Fig. 5) and in all cells in which the transgene was induced by hypertonic stress at 6 h (not shown). This finding raised the question of whether in hypothalamic neurons, Fos interacts with the critical proenkephalin CRE-2 regulatory element contained within the transgene. Alternatively, given the presence of CREB in essentially all hypothalamic neurons and the previously established interaction of CREB with both the proenkephalin and c-fos genes in other brain regions (8, 19), CREB might be involved in the regulation of both proenkephalin and c-fos gene expression in the hypothalamus. To determine whether either of these two proteins interacted with the proenkephalin CRE-2 site or the c-fos CaRE site, we performed gel shift assays in cell extracts prepared from the region of the PVN. As a control for the presence of AP-1-binding activity, we also tested binding to a consensus AP-1 oligonucleotide.
Formation of specific complexes between proteins contained within our extracts and AP-1, CRE-2, and CaRE oligonucleotides was established by competition with unlabeled oligonucleotides (Fig. 7). In these extracts, the CRE-2 and CaRE oligonucleotides were better competed by a consensus palindromic CREB-binding oligonucleotide (core sequence TGACGTCA; lanes designated 4x ATF and 8x ATF) than by an AP-1 oligonucleotide (core sequence TGACTCA; lanes designated 4x AP-1 and 8x AP-1). The opposite pattern of competition was obtained for the labeled AP-1 oligonucleotide (Fig. 7, top). It is noteworthy that these competitor oligonucleotides differ by only a single base. The unrelated proenkephalin AP-2 site (3) did not compete with any of the specific bands even in a 100-fold molar excess (lane designated 100x AP-2).
Fig. 7. Specificity of Binding to Oligonucleotide Probes.

Top, AP-1 oligonucleotide. Middle, Proenkephalin CRE-2 element. Bottom, CaRE element. Note that although the AP-1 (c) oligonucleotide competes more strongly with the AP-1 (s) oligonucleotide, the CREB/ATF oligonucleotide competes more strongly with the CRE-2 and CaRE oligonucleotides. The unrelated proenkephalin AP-2 sequence (3) does not compete effectively. See Materials and Methods for full oligonucleotide sequences. The control lane has no competitor added. 4x AP-1 (c) and 8x AP-1 (c), 4- and 8-fold molar excesses of unlabeled AP-1 oligonucleotide; 4x ATF and 8x ATF, 4- and 8-fold molar excesses of unlabeled CRE8/ATF oligonucleotide; 100x AP-2.100-fold excess of AP-2 oligonucleotide; Pl serum, binding in the presence of preimmune serum.
To determine whether DNA-binding activity was induced by hyperosmotic stress, gel shifts were performed with cell extracts derived from the PVN region 2 h after the injection of hypertonic saline, a time at which Fos induction was most robust (Fig. 8). Compared with untreated animals, there was a slight induction of binding to the AP-1 oligonucleotide [designated AP-1 (s)] in animals given normal saline (0.15 M) and a marked induction in stressed (1.5 M saline) animals (Fig. 8, top). In contrast, there was no consistent induction of binding to either the CRE-2 or CaRE oligonucleotide (Fig. 8, middle and bottom). To determine whether the specific complexes contained either Fos or CREB protein, specific antisera directed against Fos and CREB were used in an attempt to either disrupt or supershift the specific bands. Fos, but not CREB, was detected (by supershift) binding to the AP-1 oligonucleotide (Fig. 9, top); CREB, but not Fos, was detected (by disruption of specific complexes) binding to the enkephalin CRE-2 and c-fos CaRE sites (Fig. 9, middle and bottom). For the AP-1 oligonucleotide, the supershifted band was induced by hypertonic saline (Fig. 9, top, compare lanes designated 1.5 M saline with lanes designated 0.15 M saline in the c-fos α condition). Hypertonic saline administration had no effect on specific complexes formed with the CRE-2 and CREB oligonucleotides in the absence or presence of antiserum (Fig. 9, middle and bottom).
Fig. 8. Gel Shifts Showing the Effects of Stress on Binding in Extracts from PVN.

Each lane represents extracts made from the PVN regions pooled from three animals. For each oligonucleotide, the first lane represents no treatment, the next two lanes represent 1.5 M saline injection, and the last two lanes represent 0.15 M saline injection. Animals were killed 2 h after injection. Each saline condition is represented by two lanes, each representing an independent experiment. The arrows point to a specific band, as determined by competition analysis (see Fig. 7). Top, AP-1 oligonucleotide. Middle, CRE-2 oligonucleotide. Bottom, CaRE oligonucleotide.
Fig. 9. Gel Shift Analysis in the Presence of c-Fos α and CREB α.

Supershift analysis of proteins binding to the AP-1(s) oligonucleotide (top), the CRE-2 oligonucleotide (middle), and the CaRE oligonucleotide (bottom). A serum band is seen in the presence of CREB antiserum that is not affinity purified (see also Fig. 7 showing the additional band in the presence of serum). Each condition is shown in duplicate, representing entirely independent experiments. Lanes 1–4 show animals treated with hypertonic saline (lanes 1 and 2) and normal saline (lanes 3 and 4) in the absence of antibody. Lanes 5–8 show animals treated with hypertonic saline (lanes 5 and 6) and normal saline (lanes 7 and 8) in the presence of Fos antibody. Lanes 9–12 show animals treated with hypertonic saline (lanes 9 and 10) and normal saline (lanes 11 and 12) in the presence of CREB antiserum.
Colocalization of the Transgene with Phospho-CREB
CREB is constitutively expressed in most known cell types and is activated by phosphorylation on Ser133 (using the rat CREB protein sequence numbering) (20). Given the observed binding patterns in gel shift assays, we sought to determine whether hypertonic saline stress induced CREB phosphorylation in transgene-expressing neurons. We, therefore, colocalized β-galactosidase activity with phospho-CREB using an antiserum that specifically detects CREB phosphorylated on Ser133 (19). Ten minutes after an injection of 0.15 M saline, there was minimal staining for phospho-CREB in the PVN (Fig. 10A), which was indistinguishable from that in an uninjected animal (not shown). Ten minutes after an injection of 1.5 M saline, intense phospho-CREB staining was seen throughout the PVN, including all cells observed to express the transgene (Fig. 10, B and C). Immunostaining for phospho-CREB began to diminish 20 min after the stress (not shown).
Fig. 10. Colocalization of Phospho-CREB Induction with the Transgene in PVN.
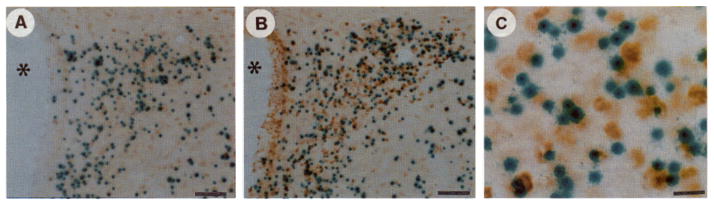
Low power sections through the PVN from transgenic mice killed 10 min after ip injection of 0.15 M saline (A) or 1.5 M saline (B). C shows high power oil immersion photomicrographs of cells stained for β-galactosidase and phospho-CREB imrnunoreactivities. The animals were handled daily for 5 days before the experiment to reduce the known effects of handling on induction of immediate early genes in the PVN. Minimal induction (as assessed by intensity of neuronal staining) is present in the PVN in both the control and 0.15 M saline groups compared with that in the stressed animals. Phospho-CREB is rapidly activated and may reflect the underlying mechanism by which CREB-like proteins bind to the regulatory sites within the proenkephalin gene, second messenger-inducible enhancer. Magnification: horizontal bars = 50 μm (A and B) and 10 μm(C).
DISCUSSION
To date, molecular analyses of DNA elements and transacting factors mediating proenkephalin gene regulation have been carried out in transformed cell lines, including CV1, C6-glioma, and PC12 (1, 3, 4, 6). Here we describe a transgenic model to study the molecular mechanisms regulating proenkephalin gene expression in vivo. Our analysis to date is consistent with a model in which stress regulates the gene at the transcriptional level in vivo. In addition, the β-galactosidase fusion has permitted a detailed study of transcription factor colocalization that would not have been feasible with such clarity using conventional double label antibody techniques.
Fos immunoreactivity is present 6 h after hypertonic saline injection. Although this is a longer time course than that observed after many stimuli, because the antiserum does not recognize Fos-related antigens, the immunoreactivity observed is likely to represent bona fide Fos. Fos expression is observed in all cells in which the transgene is induced, as determined by cellular filling with the β-galactosidase reaction product (10). However, CREB is found in all neurons observed; thus, the colocalization analysis could not decide between Fos and CREB as potential inducers of proenkephalin gene expression in hypothalamic neurons. We, therefore, performed binding studies with cell extracts from the region of the PVN. We found that despite the presence of stress-inducible AP-1 binding activity in our extracts (Fig. 8, top) that contain Fos (Fig. 9, top), quantitative protein binding to the CRE-2 and CaRE elements was not altered by stress. Despite the presence of Fos in specific complexes binding to the AP-1 oligonucleotide, Fos was not detected interacting with the CRE-2 or CaRE sites; rather, these elements appeared to interact with CREB, consistent with our previous observations in striatum (8). A potential problem that characterizes attempts to study binding in extracts made from brain regions is that multiple cell types are contained within the dissection. Thus, proteins that are not in contact with the DNA sequence of interest in vivo may interact with it in the gel shift assay. We have shown, however, that the candidate transcription factors are colocalized with the fusion gene in the PVN. What cannot be ruled out is that additional factors from the nonenkephalinergic cells interfered with physiological binding in our extracts. It is significant, therefore, that we demonstrated inducible AP-1 binding in these extracts and found that despite this AP-1 activity, which contains Fos, CREB bound to CRE-2, even after stress induction.
CREB is a constitutively expressed transcription factor, present under both basal and induced conditions in essentially all hypothalamic cells (Fig. 6). It has been shown that CREB activates transcription after phosphorylation on its amino acid residue Ser133 (20). Here we show that hypertonic saline stress causes CREB phosphorylation in PVN. As we have also shown that CREB binds the proenkephalin CRE-2 and c-fos CaRE sites in hypothalamic cell extracts, this suggests a model in which stress activates both the c-fos and proenkephalin genes by CREB phosphorylation. In this model the c-fos and proenkephalin genes are induced by a parallel process, rather than in series. This model also raises hypotheses concerning signal transduction pathways activated by hyperosmolar stress. The protein kinases that have been shown to phosphorylate CREB on Ser133 are protein kinase-A (20) and calcium-calmodulin dependent protein kinases (21). The implication is that stress induces gene expression in hypothalamic neurons via activation of one or both of these pathways.
MATERIALS AND METHODS
Animals and Treatments
Adult male ENK 1.1 transgenic mice (25–30 g) were used in all experiments (9). The animals were housed three to five per cage under a standard light-dark cycle and had free access to food and water. Each experiment was repeated at least four times. Stress paradigms were similar to those previously described for the rat (11). Mice were injected ip with 0.018 ml/g BW hypertonic saline (1.5 M) or an equal volume per BW normal saline (0.15 M).
Staining for β-Galactosidase Activity
The chromogenic substrate 5-bromo-4-chloro-3-indolyl-β-D-galactopyranoside (Boehringer Mannheim, Indianapolis, IN) was used to detect expression of β-galactosidase based on the method of Price et al. (22). Mice were anesthetized with ip injections of 0.4 ml 2.5% Avertin and then perfused with 4% paraformaldehyde in PBS. The brains were removed, postfixed in 4% paraformaldehyde for 1 h, and placed in 30% sucrose solution overnight at 4 C. Frozen serial sections (50 μm) were placed on gelatin-coated slides. X-Gal dissolved in dimethylformamide (40 mg/ml) was added to a mixer solution to give a final concentration of 1 mg/ml. The mixer solution was made up in PBS containing 35 mM K3Fe(CN)6, 35 mM K4Fe(CN)6.3H2O, 2 mM MgCl2 (Sigma, St. Louis, MO), 0.01 % sodium deoxycholate (Sigma), and 0.02% Nonidet P-40. Slides were air dried overnight, dipped in xylene, and coverslipped with mounting medium (Cytoseal, Stephens Scientific, Riverdale, NJ). Wild-type brains from C57BL/6J mice (Jackson Laboratories, Bar Harbor, ME) were put through the same protocol to rule out any endogenous expression.
Immunohistochemistry
In all immunohistochemistry experiments, the following basic procedure was followed, except where otherwise stated. Animals were anesthetized with Avertin and perfused with 150 ml 4% paraformaldehyde (pH 7.4) in 1 x PBS (2.62 g NaH2PO4 and 11.49 g Na2HPO4 in 1 liter water, pH 7.4). Brains were postfixed for 4 h and immersed in a cryoprotectant solution (30% sucrose) for 48 h. Sections (40–50 μm) were cut on a freezing microtome and placed in 10% normal goat serum (Gibco, Grand Island, NY) for 1 h. Sections were then incubated in the primary antiserum at the indicated dilutions with 2% normal goat serum, 1% sodium azide, and 0.3% Triton for 24–48 h at 4 C. After three washes in PBS (10 min/wash), sections were incubated in the secondary antibody (using the Vectastain ABC Elite kit for rabbit or mouse as indicated; Vector Laboratories, Burlingame, CA) at room temperature for 1 h. Sections were washed three times in PBS for 10 min/ wash and then incubated at room temperature with avidin-biotin-peroxidase complex from the Vector Elite kit for 60 min. After another series of washes in PBS (twice for 5 min each time) and a wash in Tris buffer (50 mM; pH 7.6), the sections were developed with 3,3′-diaminobenzidine (1 mg/ml) and 0.03% hydrogen peroxide (Fisher Scientific, Fair Lawn, NJ).
c-Fos and CREB
The same immunohistochemistry protocol was followed for c-fos and CREB antiserum. For c-fos, affinity-purified polyclonal rabbit serum (Oncogene Science, Uniondale, NY) was used (dilution, 1:1000). The CREB antiserum was a gift from Drs. David Ginty and Michael Greenberg and was used in a 1:1000 dilution. Mice stained with either antiserum were typically treated for 6 h with hypertonic or isotonic saline. This antiserum does not cross-react with ATF-1 or CREM (19).
Phospho-CREB
The antiserum (raised in rabbit) was a kind gift from Drs. David Ginty and Michael Greenberg (19) and was diluted in vehicle (1:1000). Mice were killed 0,10, and 20 min after the respective saline injection. The protocol for phospho-CREB staining was essentially the same as that described above, except that all solutions contained 50 mM sodium fluoride; vehicle consisted of 50 mM NaF, 0.3% Triton X-100, and 3% BSA (RIA grade; Sigma) in PBS.
Quantitation
Counting of cells positive for β-galactosidase was performed precisely at described by Borsook et al. (10). Briefly, cells were counted using a graticule placed over the PVN at x40 magnification. Similar coronal sections were used, as previously described (10). At this magnification, cells were easily visualized. We used the same method for counting Fos-positive cells. All Fos cells, whether lightly or darkly stained, were counted in control and experimental animals. A similar approach was used for colocalization of β-galactosidase- and Fos-positive cells. The method does not allow for easy quantification of filled cells, because lightly filled cells are difficult to define after Fos immunohistochemistry. We have previously quantitated the number of filled cells in the PVN after hypertonic saline stress (10).
Gel shifts
Adult male Swiss-Webster mice (30 g) were used in the experiments for gel shift assays. Two hours after ip injections of saline (0.018 ml/g; 1.5 or 0.15 M), animals were killed by rapid cervical dislocation. The brains were rapidly removed, and a 1 - to 2-mm thick section was made through the hypothalamus at the level of the PVN. Tissue containing the PVN was removed in approximately a 2 × 2 × 1 -mm section under a dissecting microscope, rapidly frozen on dry ice, and stored at −80 C. Three animals were used for condition. All experiments were performed in at least duplicate. Dissected tissue was sonicated in 10 μl/mg tissue in a buffer containing 20 mM HEPES (pH 7.9), 25% glycerol, 0.84 M NaCI, 1.5 mM MgCl2, 0.4 mM EDTA, 0.5 mM dithiothreitol, and 0.5 mM phenylmethylsulfonylfluoride. After sonication, the samples were centrifuged at 14,000 rpm for 10 min, and the supernatant was used for gel shift analysis. Protein concentrations were measured (23) and equalized within each experiment by dilution with the appropriate volume of sonication buffer. All samples prepared in this manner were used within 1 week. The sequences of oligonucleotides used in the gel shift assays were: 5′-GATCAGCATGAGTCACTTC-3′ for AP-1(s), 5′-GATCGGCCTGCGTCAGCTG-3′ for CRE-2, 5′-GATCGCTGACGTCAGGG-3′ for CREB/ATF, 5′-GATCCCCGTGACGTTTACA-3′ for CaRE, and 5′-GATCCAGCCCGCCGGCGATTG-3′ for AP-2. All oligonucleotides were double stranded. The core consensus sequences are indicated in bold type. Note that the AP-1(c) and AP-1(s) have identical core consensus sequences in reverse orientation. A 5′-BamHI site, shown italics, was used for a fill in the labeling reaction with [α-32P]deoxy-ATP using reverse transcriptase (Gibco-BRL, Gaithersburg, MD). The binding reaction (15 μl) was performed in binding buffer [20 mM HEPES (pH 7.9), 10% glycerol, 0.1 mM EDTA, 50 mM KCl, 2 mM MgCl2, 1 mM phenylmethylsulfonylfluoride, and 1 mM dithiothreitol] with 2 μg poly(dl/dC) and 5–10 μg protein extract. The labeled DNA fragment with or without cold competitor was added after 10 min on ice. Binding was carried out for 10 min at room temperature. Samples were electrophoresed through a 4% nondenaturing polyacrylamide gel (60:1, acrylamide-bisacrylamide) in 0.25 x TBE (1 x TBE contains 89 mM Tris, 89 mM boric acid, and 2.5 mM EDTA) and 3% glycerol, which was subsequently dried and autoradiographed, Tests for specificity of binding gel shift assays included the ability to inhibit binding with “self”-competition, but not with unrelated sequences. For supershift assays, protein extracts were prepared in the same manner with the lysate containing 1 μl Fos or CREB antiserum.
Acknowledgments
We are indebted to Drs. David Ginty and Michael Greenberg for the gift of the CREB and phospho-CREB antisera. Transgenic mice were produced in collaboration with Dr. Karl Herrup.
This work was supported in part by USPHS Grants MH-44160, MH-00892, and DA-07134 (to S.E.H.) and DA-894244 (to M.C.), and by Dr. Richard J. Kitz, Department of Anesthesia, Massachusetts General Hospital (to D.B.).
References
- 1.Comb M, Birnberg NC, Seasholtz A, Herbert E, Goodman HM. A cyclic AMP- and phorbol ester-inducible DNA element. Nature. 1986;323:353–356. doi: 10.1038/323353a0. [DOI] [PubMed] [Google Scholar]
- 2.Hyman SE, Comb M, Lin YS, Pearlberg J, Green MR, Goodman HM. A common trans-acting factor is involved in transcriptional regulation of neurotransmitter genes by cyclic AMP. Mol Cell Biol. 1988;8:4225–4233. doi: 10.1128/mcb.8.10.4225. [DOI] [PMC free article] [PubMed] [Google Scholar]
- 3.Hyman SE, Comb M, Pearlberg J, Goodman HM. An AP-2 element acts synergistically with the cyclic AMP-and phorbol ester-inducible enhancer of the human proenkephalin gene. Mol Cell Biol. 1989;9:321–324. doi: 10.1128/mcb.9.1.321. [DOI] [PMC free article] [PubMed] [Google Scholar]
- 4.Comb M, Mermod N, Hyman SE, Pearlberg J, Ross ME, Goodman HM. Proteins bound at adjacent DNA elements act synergistically to regulate human proenkephalin c AMP inducible transcription. EMBO J. 1988;7:3793–3805. doi: 10.1002/j.1460-2075.1988.tb03264.x. [DOI] [PMC free article] [PubMed] [Google Scholar]
- 5.Sonnenberg JL, Rauscher FJ, Morgan Jl, Curran T. Regulation of proenkephalin by Fos and Jun. Science. 1989;246:1622–1625. doi: 10.1126/science.2512642. [DOI] [PubMed] [Google Scholar]
- 6.Nguyen TV, Kobierski L, Comb MJ, Hyman SE. The effect of depolarization on expression of the human proenkephalin gene is synergistic with cAMP and dependent upon a cAMP-inducible enhancer. J Neurosci. 1990;10:2825–2833. doi: 10.1523/JNEUROSCI.10-08-02825.1990. [DOI] [PMC free article] [PubMed] [Google Scholar]
- 7.Kobierski LA, Chu HM, Tan Y, Comb MJ. cAMP-dependent regulation of proenkephalin by Jun D and Jun B: positive and negative effects of AP-1 proteins. Proc Natl Acad Sci USA. 1991;88:10222–10226. doi: 10.1073/pnas.88.22.10222. [DOI] [PMC free article] [PubMed] [Google Scholar]
- 8.Konradi C, Kobierski LA, Nguyen TV, Heckers SH, Comb M, Hyman SE. The cAMP-response-element-binding protein interacts, but Fos protein does not interact, with the proenkephalin enhancer in rat striatum. Proc Natl Acad Sci USA. 1993;90:7005–7009. doi: 10.1073/pnas.90.15.7005. [DOI] [PMC free article] [PubMed] [Google Scholar]
- 9.Borsook D, Rosen H, Collard M, Dressler H, Herrup K, Comb MJ, Hyman SE. Expression and regulation of a proenkephalin β-galactosidase fusion gene in the reproductive system of transgenic mice. Mol Endocrinol. 1992;6:1502–1512. doi: 10.1210/mend.6.9.1435791. [DOI] [PubMed] [Google Scholar]
- 10.Borsook D, Falkowski O, Burstein R, Strassman A, Konradi C, Dauber A, Comb M, Hyman SE. Stress-induced regulation of a human β-galactosidase fusion gene in the hypothalamus of transgenic mice. Mol Endocrinol. 1994;8:116–125. doi: 10.1210/mend.8.1.8152426. [DOI] [PubMed] [Google Scholar]
- 11.Lightman SL, Young WS. Changes in hypothalamic preproenkephalin A mRNA following stress and opiate withdrawal. Nature. 1987;328:643–645. doi: 10.1038/328643a0. [DOI] [PubMed] [Google Scholar]
- 12.Young WS, Lightman SL. Chronic stress elevates enkephalin expression in the rat paraventricular and supraoptic nuclei. Mol Brain Res. 1992;13:111–117. doi: 10.1016/0169-328x(92)90050-l. [DOI] [PubMed] [Google Scholar]
- 13.Watts AG. Disturbance of fluid homeostasis leads to temporally and anatomically distinct responses in neuropeptide and tyrosine hydroxylase mRNA levels in the paraventricular and supraoptic nuclei of the rat. Neuroscience. 1992;46:859–879. doi: 10.1016/0306-4522(92)90190-d. [DOI] [PubMed] [Google Scholar]
- 14.Huggenvik Jl, Collard MW, Stofko RE, Seasholtz AF, Uhler MD. Regulation of the human enkephalin promotor by two isoforms of the catalytic subunit of cyclic adenosine 3′,5′-monophosphate-dependent protein kinase. Mol Endocrinol. 1991;5:921–930. doi: 10.1210/mend-5-7-921. [DOI] [PubMed] [Google Scholar]
- 15.Sheng M, Dougan ST, McFadden G, Greenberg ME. Calcium and growth factor pathways of c-fos transcriptional activation require distinct upstream regulatory sequences. Mol Cell Biol. 1988;8:2787–2796. doi: 10.1128/mcb.8.7.2787. [DOI] [PMC free article] [PubMed] [Google Scholar]
- 16.Sheng M, McFadden G, Greenberg ME. Membrane depolarization and calcium induce c-fos transcription via phosphorylation of transcription factor CREB. Neuron. 1990;4:571–582. doi: 10.1016/0896-6273(90)90115-v. [DOI] [PubMed] [Google Scholar]
- 17.Fink JS, Verhave M, Kasper S, Tsukada T, Mandel G, Goodman RH. The CGT CA sequence motif is essential for biological activity of the vasoactive intestinal peptide gene cAMP-regulated enhancer. Proc Natl Acad Sci USA. 1988;85:6662–6666. doi: 10.1073/pnas.85.18.6662. [DOI] [PMC free article] [PubMed] [Google Scholar]
- 18.Sharp FR, Sagar SM, Hicks K, Lowenstein D, Hisanaga K. c-fos mRNA, Fos, and Fos related antigen induction by hypertonic saline and stress. J Neurosci. 1991;11:2321–2331. doi: 10.1523/JNEUROSCI.11-08-02321.1991. [DOI] [PMC free article] [PubMed] [Google Scholar]
- 19.Ginty DD, Kornhauser JM, Thompson MA, Bading H, Mayo KE, Takahashi JS, Greenberg ME. Regulation of CREB phosphorylation in the suprachiasmatic nucleus by light and a circadian clock. Science. 1993;260:238–241. doi: 10.1126/science.8097062. [DOI] [PubMed] [Google Scholar]
- 20.Gonzalez GA, Montminy MR. Cyclic AMP stimulates somatostatin gene transcription by phosphorylation of CREB at serine 133. Cell. 1989;59:675–680. doi: 10.1016/0092-8674(89)90013-5. [DOI] [PubMed] [Google Scholar]
- 21.Sheng M, Thompson MA, Greenberg ME. CREB: a Ca2+-regulated transcription factor phosphorylated by calmodulin-dependent kinases. Science. 1991;252:1427–1430. doi: 10.1126/science.1646483. [DOI] [PubMed] [Google Scholar]
- 22.Price J, Turner D, Cepko C. Lineage analysis in the vertebrate nervous system by retrovirus mediated gene transfer. Proc Natl Acad Sci USA. 1987;84:156–160. doi: 10.1073/pnas.84.1.156. [DOI] [PMC free article] [PubMed] [Google Scholar]
- 23.Bradford MM. A rapid and sensitive method for the quantitation of microgram quantities of protein utilizing the principle of protein-dye binding. Anal Biochem. 1976;72:248–254. doi: 10.1006/abio.1976.9999. [DOI] [PubMed] [Google Scholar]