Summary
Population variation in hypothalamic-pituitary-adrenal (HPA) activity and reactivity was assessed in a healthy sample of 48 juvenile rhesus monkeys. Cluster analysis of the HPA profiles revealed four distinct neuroendocrine phenotypes based on six indices of HPA functioning. Behavioral reactivity was also evaluated in response to novel stimuli, and revealed marked differences between animals in the highest- and lowest-cortisol clusters. Specifically, animals in the high-cortisol cluster showed larger stress-induced cortisol responses and blunted feedback sensitivity to dexamethasone. They were also emotionally reactive, displayed more aggressive behaviors, and were less likely to approach novel objects. In contrast, monkeys in the low-cortisol cluster were more likely to approach and explore novel objects. Representative animals with high or low cortisol profiles were scanned with Magnetic Resonance Imaging to evaluate structural differences in global and regional gray matter (GM) and white matter (WM) volumes. Monkeys with higher cortisol reactivity evinced less hemispheric brain asymmetry, due to decreased GM in the right hemisphere. Stress reactivity was inversely related to global GM and positively related to total cerebrospinal fluid volume. This inverse relationship was also observed in several stress-sensitive regions, including prefrontal and frontal cortices. Our study demonstrates that population variation in pituitary-adrenal activity is related to behavioral disposition and cerebral structure in this nonhuman primate species.
Keywords: cortisol, emotionality, monkey, cluster analysis, behavioral inhibition, brain structure, hemispheric symmetry
Introduction
There has been long-standing interest in characterizing individual differences in the activity of the hypothalamic-pituitary-adrenal (HPA) axis and its relationship to behavioral and neural measures in both humans and animals. Despite daily variation related to biorhythms and acute changes in stress-responsive hormones such as cortisol (Hruschka et al., 2005; Shirtcliff et al., 2005), hormone secretion and behavioral reactivity are related in a stable manner (Capitanio et al., 1998; Byrne and Suomi, 2003). Some have proposed that this variation reflects distinct endophenotypes and provides a unique means to distinguish subgroups vulnerable to stress-related illness and disease (Chrousos and Gold, 1992; Heim et al., 2000; Wust et al., 2005). For instance, surveys of healthy individuals have shown that approximately 10% of individuals do not show the typical diurnal decline in cortisol levels across the day (Smyth et al., 1997; Kirschbaum et al., 1999; Stone et al., 2001). Approximately 30% of participants do not respond with the usual increase in cortisol levels to arousing laboratory stressors (Kirschbaum et al., 1993; Dickerson and Kemeny, 2004). Individual differences in HPA activity become evident at a young age, and emerge while children are still in good health. Nevertheless, many researchers have concluded that this variation in HPA responses is an important indicator of vulnerability and can either promote health or have deleterious consequences (Plotsky et al., 1998; McEwen, 2007; Del Giudice et al., 2011). Determining whether flattened profiles or other aberrant characteristics of HPA activity are associated with behavioral profiles is thus of interest in both animals and humans.
In the current study, natural population variation in several defining features of HPA activity was determined in the rhesus monkey, a commonly studied nonhuman primate. The measures included: (a) basal levels, (b) stress responsiveness, (c) the daily rhythm with a focus on peak levels and the diurnal decline, and (d) sensitivity of the HPA axis to negative feedback, which was induced by administering dexamethasone (Dex), a synthetic glucocorticoid. Variation in HPA activity was expected to range from moderate to exaggerated stress responses, from clear to flattened diurnal rhythms, and from a high sensitivity to resistance to glucocorticoid feedback. Cluster analysis was used to create a taxonomy of HPA activity without preconceived constraints about the number of profiles or defining features. Furthering our understanding of phenotypic variation in a healthy young primate population is a crucial step towards ascertaining whether particular components of this variation reflect distinct behavioral dispositions and characteristics of neural structure.
Another advantage of examining rhesus macaques is that they have been described as outgoing or inhibited, behavioral traits that appear similar to fundamental features of human personality (Stevenson-Hinde et al., 1980; Suomi, 1997). Approach or avoidance tendencies in the presence of novel objects or in unfamiliar settings have been used as an index of temperament, similar to our approach in this study. Increased HPA activity has been associated with aspects of behavioral inhibition and the neural limbic circuitry that regulates emotional and behavioral responses to novel and challenging situations (Nachmias et al., 1996; Kalin et al., 2000). Our assessment thus included tests of the monkeys’ willingness to approach novel stimulus objects. We hypothesized that monkeys with high HPA activity would be more behaviorally inhibited and/or emotionally reactive in the context of novel objects when compared to animals with lower HPA activity. Following the delineation of population variation in HPA activity and identification of behavioral response profiles, two subgroups were selected for a neuroimaging phase to determine what neuroanatomical characteristics were also associated with this continuum.
Many structural features of the brain, including regional and global brain volumes, have been associated with emotional behavior in animals and with affective and psychiatric conditions in humans (Gur et al., 1999; McEwen, 2000). The neural circuitry of fear and anxiety largely overlaps the neural pathways governing the neuroendocrine stress response (LeDoux, 2000). High HPA activity, due to repeated or severe stress during development, can also lead to altered brain structure and function (Bremner, 1999). The hippocampus, amygdala, prefrontal cortex (PFC), and anterior cingulate are stress-sensitive (Vyas et al., 2002; Cerqueira et al., 2007; McEwen, 2007) and are influenced by glucocorticoids (Herman et al., 2003). In addition, high levels of glucocorticoids, due either to endogenous secretion or pharmacological administration, can result in hippocampal damage, including granule cell loss, dendritic atrophy, and impairments in cognitive function (Uno et al., 1994; Gould et al., 1997; Lupien et al., 2009). There is also a parallel literature indicating that the relative asymmetry of the hemispheres, as well as the predominant activational pattern of the left and right frontal poles, is associated with emotional and cognitive function (Geschwind and Galaburda, 1985; Fox et al., 2005; Ganzel et al., 2013). Therefore, we hypothesized that structural differences would be apparent at the global, regional and hemispheric level in animals with high HPA activity. Exploratory analyses were conducted to determine whether there were volumetric differences in the frontal cortex and hippocampus. Our study demonstrates that young monkeys can be categorized into distinct neuroendocrine subgroups, which also reflect significant differences in emotional and exploratory behavior and cortical brain structure.
Methods
Subjects and housing
Forty-eight juvenile rhesus macaques (18 male, 30 female) were evaluated in this survey of neuroendocrine phenotypes. Healthy juvenile monkeys ranging in age from 1.0–2.5 years (Mean = 1.6, SD = 0.4) were assessed for one week in the identical experimental paradigm. Using a standardized breeding protocol, this colony at the Harlow Primate Laboratory generates up to 100 infants every year, with similar caging and maternal rearing. All monkeys were reared by their mothers. At 6–8 months of age, infants are weaned from their mothers and housed in small age-matched, peer groups of four to six animals. To facilitate the current assessment, these peer groups were purposefully divided into smaller subgroups comprised of two to three monkeys and allowed to acclimate undisturbed for several weeks prior to the neuroendocrine and behavioral testing. The smaller group size allowed for rapid collection of blood samples and the opportunity for expression of individual behavior in the context of novel objects, while lessening the social constraints of larger social hierarchies or the stressful reaction that results when testing an isolated individual acutely. All procedures were approved by the institutional Animal Care and Use Committee (ACUC), and husbandry practices complied with the Guide for the Care and Use of Laboratory Animals.
During the experimental week, the monkeys were housed in a quiet room with a standardized single steel cage (0.9 × 1.8 × 0.9 m). No other animals were present in the room. Behavioral observations with novel objects were conducted on the majority of animals (n = 44, 16 males, 28 females) with the exception of one group because it was comprised of four animals. Groups of four or more monkeys had been found previously to alter individual responses to novelty (Coe et al., 1982). Once all neuroendocrine and behavioral data were analyzed, a representative subset of monkeys (n =18, 10 males, 8 females) was selected for structural neuroimaging. These subjects ranged in age from 1.3–2.8 years (Mean=2.0, SD=0.5).
Husbandry and environmental conditions were carefully controlled during the experimental week. The light/dark schedule was 14/10 with lights on at 0600 h, so that all blood samples could be collected at a controlled time with respect to the diurnal rhythm of the HPA axis. The main feeding occurred between 0600–0700 h, at least one hour prior to the morning blood samples. Fruit supplements were given in the afternoon after sampling. Water was available ad libitum. Extraneous noise outside of the room was minimized, and only research staff entered the room.
Sample collection and test conditions
Several features of HPA activity were assessed from six blood samples obtained across an 8 day period: Undisturbed Basal, Stress Reactivity, Acclimation, Diurnal Rhythm, and Negative Feedback. Each sample (0.5 –1.5 ml) was collected by femoral venipuncture and used to assay serum cortisol levels. On Day 1, a basal sample was collected at 1500 h under undisturbed conditions prior to moving the monkeys from their home cage. A Complete Blood Count (CBC) and differential from this sample confirmed the animals’ general health and wellbeing. On Day 4, the pair or triad was relocated to the novel cage in the unfamiliar room in order to examine the second attribute: Stress Reactivity. At 1600 h, one hour after the housing relocation, a sample was collected to capture individual differences in the acute stress response to both the handling disturbance and to the new setting. On Day 6, adaptation and acclimation to change were assessed from blood samples obtained at 0800 h and 1500 h. These samples also provided an index of the diurnal rhythm on that day. The final condition on Days 7–8 involved an overnight Dexamethasone Suppression Test (DST) to assess the HPA response to glucocorticoid feedback. On Day 7 the monkeys were injected intramuscularly at 1500 h with a low dose of dexamethasone sodium phosphate (Dex, 0.25 mg/kg). Blood samples were collected at 0800 h and 1500 h on the following day.
To preclude acute hormone elevations to the handling needed to obtain the blood samples, two teams of experienced phlebotomists collected specimens from all animals in less than 2 min, from the moment of entering the room to the final sample. Samples were transferred to serum separator tubes and centrifuged at 2000 x g for 5 min using an IEC Centra CL3R refrigerated centrifuge (Thermo Electron Corp). Sera were stored at −60 °C until assayed in duplicate determinations for cortisol concentration by iodinated radioimmunoassay (DiaSorin Inc., Stillwater, MN). Intra- and inter-assay coefficients of variation were 4.18% (288 duplicate determinations) and 4.62% (12 assays), respectively.
Behavioral data collection
On Days 5 and 7, a novel object was placed in the cage at 1200 h and the monkeys’ behavior recorded for one hour. Two different novel objects (a plastic baby doll and a Fisher Price touch-activated music-light toy) with contrasting features were used to elicit emotional and exploratory behaviors. Behaviors were scored in person and from video recordings by two independent observers who also rated the monkeys’ overall emotionality during each session. Inter-rater reliability of the independent observers was acceptable (kappas > 0.7) for behavioral scores and the global emotionality rating. Emotionality was defined by a set of expressive behaviors including frequent vocalizations and frequent pacing or stereotypic locomotion. Ratings were scored on a 10-point scale and significantly correlated between sessions (r(36) = 0.56, p < 0.001, n = 38). Latency to first touch the new objects captured the monkey’s aversion/inhibition to novelty; the time to first touch the novel objects were positively correlated across the two sessions (r(36) = 0.60, p < 0.001, n = 38). All other behavioral measures were also correlated between sessions as well (at r ≥ .38, p ≤ 0.01) with the exception of two behaviors, presenting of the rump and open-mouthed threat, as these were rarely observed and seen only in response to the baby doll. Because behaviors were so consistent across the two sessions, the scores were averaged for the final analyses. Displaced aggression was defined as the number of instances of unprovoked aggression toward others, self and/or objects. Behavioral definitions were informed by previously published primate ethological analyses (Stevenson-Hinde and Zunz, 1978; Stevenson-Hinde et al., 1980; Bolig et al., 1992).
Magnetic Resonance Imaging (MRI)
To investigate global and hemispheric differences in brain structure, MRI scans were obtained on a representative subset of 18 animals identified as having either high or low cortisol activity (n = 9 and 9, respectively). Animals were first immobilized with ketamine hydorchloride (Ketaject) (Phoenix, St. Joseph, MO) (10 mg/kg, IM) and then sedated with medetomidine hydrochloride (Domitor, Orion Pharma, Finland) (50 μg/kg, IM). Anesthesia was rapidly reversed with atipamezole hydrochloride (Antisedan, Orion Pharma, Finland) (50 μg/kg, IV). Their heads were oriented in the same stereotaxic plane within a quadrature extremity coil, 18-cm in diameter. A vitamin E gel capsule was placed near each monkey’s left ear to ensure identical orientation for image processing. Imaging was performed on a 3-Tesla General Electric scanner (SIGNA Excite). A high resolution 3D-SPGR sequence was employed for the T1-weighted scan (repetition time = 8.6 msec, echo time = 2.0 msec, flip angle = 10°, matrix = 512 × 512, field of view = 14 × 14 cm), which provided a voxel resolution of 0.234 × 0.234 × 0.4 mm (0.5 mm coronal inter-slice gap) across the entire cranium. The T2-weighted scan (repetition time = 12,000 msec, echo time = 90 msec, flip angle = 90°, field of view = 14 × 14 cm) provided a voxel resolution of 0.27 × 0.27 × 1.5 mm across the entire cranium.
An iterative, joint-deformable registration process had been employed previously to average images from a large number of monkeys in order to create a standardized, unbiased brain atlas for both T1 and T2 images (see Styner et al., 2007, for details). Use of that template significantly improved signal-to-noise ratios, and the brain atlas facilitated the determination of probabilistic tissue maps and lobar parcellation for these 18 scans. Based on the subject’s co-localized T1 and T2 image, a fully automatic segmentation process classified cortical tissue as gray matter (GM), white matter (WM), or cerebrospinal fluid (CSF). Then, the volumes of each tissue type in the parcellated lobar regions of interest were calculated (Styner et al., 2007). The focus of the current analyses is on GM and WM in the frontal, temporal, and parietal/occipital regions of the left and right hemispheres. MR images were analyzed by an independent rater (MS) who was not informed about the phenotypic designations.
Analytical Strategy
Cortisol Sampling Protocol
Cortisol levels for all 48 subjects were examined initially with repeated measures analyses of variance (ANOVA) to verify the discriminant value of the neuroendocrine test paradigm. Analysis of age and sex showed no influence of sex; however, age proved to be a significant factor and thus was included as a covariate in subsequent cortisol analyses. Behavioral responses were analyzed with respect to Cortisol Cluster membership, see description below.
Defining Neuroendocrine Phenotypes Using Cluster Analysis
Cluster analysis using SLEIPNER 2.0 was employed to generate phenotypic groupings based on the six cortisol values obtained during the week of testing. The SLEIPNER program solves many problems encountered with other types of cluster analysis (Bergman and El-Khouri, 1998). Because idiosyncratic patterns in relatively few individuals can influence the final cluster solution, the RESIDUE procedure was utilized first. This step identified seven (of the 48) individuals as multivariate outliers, defined as being distinct from any other single animal (squared Euclidean distance threshold of 0.50). These animals were excluded from subsequent analyses of cortisol or behavior by cluster membership. Second, the CLUSTER procedure was performed with Ward’s method, standardized scores, and the squared Euclidean distance to determine similarity among the remaining individuals. Ward’s method was chosen because it maximizes differences between clusters (i.e., the error sum of squares) and minimizes differences between individuals within each cluster.
Once the overall groups were designated, a repeated measures ANOVA was used to confirm that mean cortisol levels were different between clusters, with cortisol samples as a within subjects factor, cluster groups as between subjects factors, and age as a covariate (Greenhouse Geisser corrected results are presented for this analysis). Orthogonal contrasts were designed to test the interaction between cortisol samples and clusters to verify that each cluster was truly unique and differed from all other animals. For orthogonal contrasts, each cortisol sample was the outcome, group membership was the predictor, and age was a covariate. Pair-wise comparisons with Sidak correction to minimize possibilities for Type I error were used to follow up significant contrast results and further identify the unique cortisol response characteristics of each cluster compared to other clusters. Parallel analyses to those described for cortisol were conducted to determine distinct behavioral profiles of each cluster compared to all other animals. For these orthogonal contrasts, each behavior was the outcome, group membership was considered as the predictor, and age was a covariate. Analyses included animals with behavioral data and cluster membership (n =38). Once behaviors associated with a particular cluster membership were identified, additional follow up analyses were conducted using pair-wise comparisons with Sidak correction, to determine which specific clusters differed from the other clusters.
Analysis of the Structural MRI results
Assessment of possible neural correlates of HPA activity utilized a modified extreme groups approach, including six representative animals of the High and Low Cortisol clusters balanced for gender, each with three males and three females. In addition, six other monkeys were selected because they had particularly high or low cortisol values in response to housing relocation and the low-dose DST. The latter were included to ensure that the neural correlates would generalize beyond the extreme clusters to reflect the overall population variation of HPA activity. For these extended groups the terms ‘higher cortisol’ and ‘lower cortisol’ are used to indicate that the observed results are not derived solely from animals in the Cluster groups. The age range and gender composition of the two groupings were similar: the nine higher cortisol monkeys included four males and five females, ranging in age from 1.7–2.4 years; the nine monkeys in lower cortisol group were comprised of six males and three females, ranging in age from 1.3–2.8 years. Repeated measures ANOVAs examined GM and WM volumes separately, nested within hemispheres (right, left) and lobar regions (frontal, temporal, and parietal/occipital). Using an ANOVA to follow-up interactions between hemisphere and group, a difference score between right and left hemisphere volume was created to capture laterality, Cortisol Group was a between subjects factor, age and intracranial volume (ICV) were included as covariates. Additional comparisons were made for hippocampal volumes, with hemisphere as a within subject factor and cortisol profile as a between-subjects factor. Exploratory analyses examined the Pearson partial correlation between cortisol levels and global brain tissue with follow-up testing, with univariate ANOVAS including covariates, for regional associations when appropriate. Covariates for all brain analyses included: 1) age at MRI to control for potential differences related to brain maturation, and 2) ICV to correct for total brain size, which also corrected for gender differences in brain size. The statistical analyses were conducted using SPSS (version 22, IBM).
Results
Neuroendocrine Testing Paradigm
Analysis of the monkeys’ cortisol levels across the six sample (S) time points, verified that the experimental conditions reliably evoked the desired effects on HPA activity (Fig. 1). Results from the repeated measures ANOVA, with age as a covariate, indicated significant differences in cortisol levels across the sampling week (F(5, 195) = 5.86, p < 0.001). Pairwise comparisons, with Sidak correction for multiple comparisons, confirmed that relocation to a novel cage in an unfamiliar room significantly elevated cortisol above basal levels (S1 v. S2, p < 0.0001), and afternoon cortisol values were still elevated above baseline values two days after relocation to the new room (S1 v. S4, p < 0.0001). However, the animals maintained a diurnal rhythm on this third day of acclimation, as morning cortisol levels were significantly higher than afternoon levels (S3 v. S4, p < 0.0001). Compared to the Acclimation morning, the overnight treatment with a low dose of Dex was effective in reducing adrenal cortisol secretion on the following morning (S3 v. S5, p < 0.0001). Mean cortisol levels and variation across the test protocol are portrayed in Figure 1.
Figure 1.
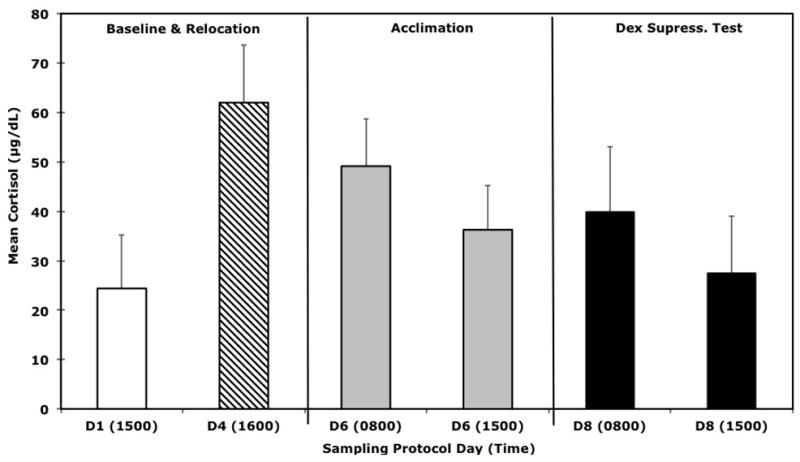
Mean (±SD) cortisol levels for all 48 animals in this survey. The day (D) and times of the six sampling conditions across the week-long protocol are shown, including responses to a low dose, overnight Dex feedback test.
Cluster Differences in Cortisol Across the Neuroendocrine Testing Paradigm
Cluster analysis was utilized to create relatively homogenous groups maximally different from each other. A four-group solution yielded profiles that were more interpretable than the five-cluster solution (change in error sum of squares = 5.95%) and the four clusters resulted in a smaller error sum of squares when compared to both the three and two cluster solutions (6.85% and 19.9%, respectively). Four individuals initially classified into one cluster were relocated in a second iteration because they appeared to be more similar to another group, resulting in more homogenous clusters. The ultimate solution contained four relatively homogenous clusters based on the mean squared averages of distances between clusters (homogeneity coefficients = 1.2 for Cluster I; 1.4 for Cluster II; 1.0 for Cluster III; 0.91 for Cluster IV). These four groupings accounted for 50.9% of the total variance in cortisol across the six experimental test conditions.
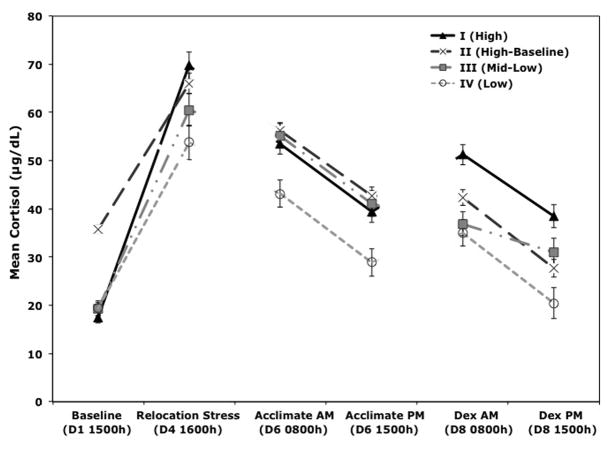
Once assigned to clusters, a repeated measures ANOVA, with age as a covariate and Greenhouse Geisser corrected df and probability values, confirmed that mean cortisol levels differed significantly across the four clusters, (F(3.6, 131.9) = 5.39, p < 0.001, result is Greenhouse Geisser corrected). These analyses also revealed a significant interaction between cortisol sample and cluster (F(10.9, 131.9) = 4.07, p < 0.001, result is Greenhouse Geisser corrected), which necessitated follow-up analyses to confirm that cluster groups differed from all other animals and to determine which cluster groups differed at each of the sampling time points. Orthogonal contrasts showed that when compared to all other animals, monkeys in the first cluster (n = 10; 5 males, 5 females; age range 1.3–2.04) had the highest cortisol levels after being relocated to a new room (F(1, 38) = 9.6, p = 0.004). Following the Dex administration, these animals also maintained high cortisol in the morning (F(1, 38) = 30.1, p < 0.0001) and in the evening (F(1, 38) = 17.3, p < 0.0001), reflecting a compensatory breakthrough reaction to the glucocorticoid feedback signal. Therefore, it was designated as the “High Cluster.” Significantly higher baseline values (F(1, 38) = 106.1, p < 0.0001) were the primary feature of the second cluster (n = 7; 4 males, 3 females; age range 1.1–1.8), distinguishing this group from the others. Therefore, this group was labeled as the “High-Baseline Cluster.” The third cluster (n = 7; 1 male, 6 females; age range 1.3–2.3) was intermediate between the other clusters, and thus labeled the “Middle-Low Cluster”. The fourth cluster (n = 17; 4 males, 13 females; age range 1.2–2.4) was also distinctive from all other animals, maintaining the lowest cortisol levels across the entire sampling week with the exception of baseline values (Relocation F(1, 38) = 16.8, p < 0.001; Acclimation AM F(1, 38) = 22.9, p < 0.001; Acclimation PM F(1, 38) = 23.9, p < 0.001; Dex AM F(1, 38) = 12.8, p < 0.001; Dex PM F(1, 38) = 19, p < 0.001). These animals comprised the “Low Cluster.”
As a follow-up to these significant findings from the orthogonal contrasts, pair-wise comparisons, with Sidak correction for multiple comparisons, were used to determine how each clusters differed from the other cluster groups. Results show that cortisol levels differed between cluster groups for the following samples: Baseline cortisol was significantly higher for High-Baseline Cluster animals compared to all other clusters (p-values < 0.001); Relocation Stress cortisol was significantly higher in the animals from the High and High-Baseline Cluster compared to Low Cluster (p < 0.001, p = 0.016, respectively); Acclimation AM cortisol was significantly higher in all clusters compared to the Low Cluster (p-values < 0.01); Acclimation PM cortisol was also significantly higher in all clusters compared to the Low Cluster (p-values < 0.01); Dex AM cortisol was significantly higher in animals from the High Clusters compared to the Mid-Low and Low Cluster (p-values < 0.001); Dex PM cortisol was significantly higher in animals from the High Clusters compared to the Low Cluster (p < 0.001). A visual illustration of these results is presented in Fig 2.
Figure 2.
Cluster analysis of hypothalamic-pituitary-adrenal (HPA) activity identified four distinct neuroendocrine typologies. Mean (±SEM) cortisol values are portrayed for each cluster group for all sampling condition: I. High (n = 10), II. High Baseline (n = 7), III. Mid-Low (n = 7), and IV. Low (n = 17). Dex Suppression Test (DST). Sampling day (D) and collection time (h) are shown.
Behavioral Responses Associated with Neuroendocrine Cluster Membership
As illustrated in Figure 3(a–c), results from orthogonal contrasts showed that animals in the High Cluster displayed more unprovoked aggressive behavior toward others and displacement reactions to objects in their environment (F(1, 35) = 10.42, p = 0.003) compared to all other animals. Follow-up analyses, using pair-wise comparisons with Sidak corrections, showed these animals differed from the Low (p < 0.01) and High-Baseline (p < 0.05) Cluster animals.
Figure 3.
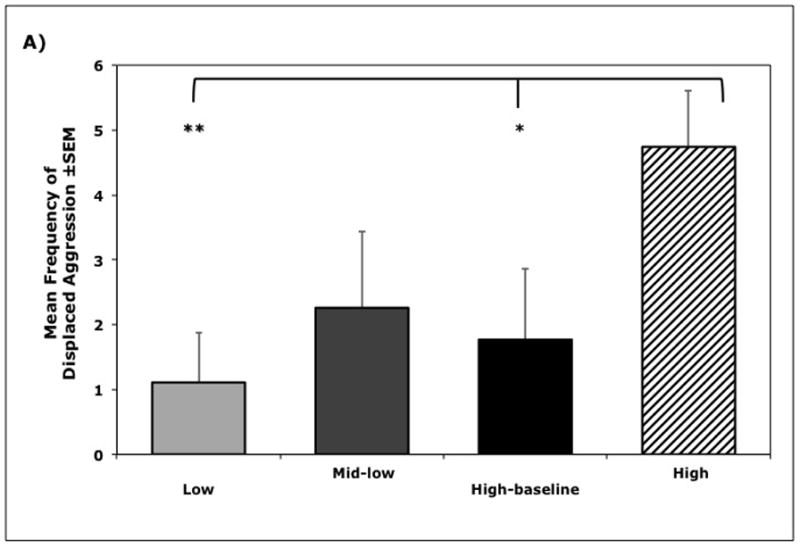
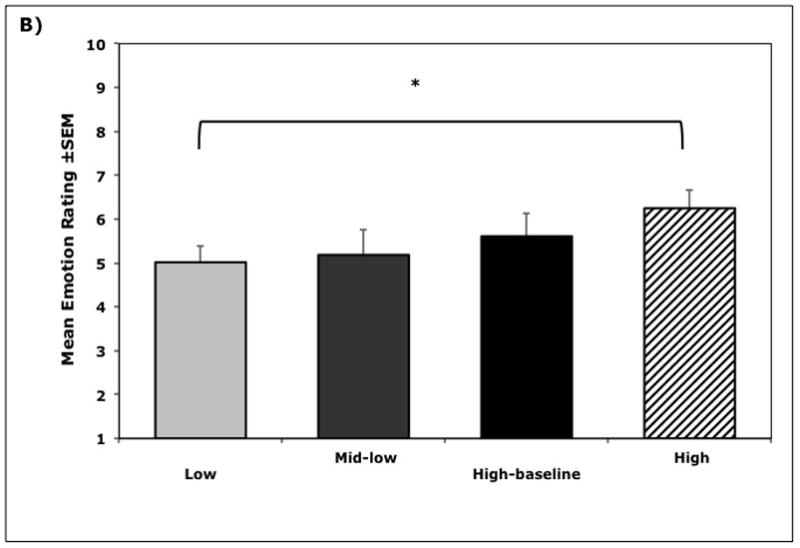
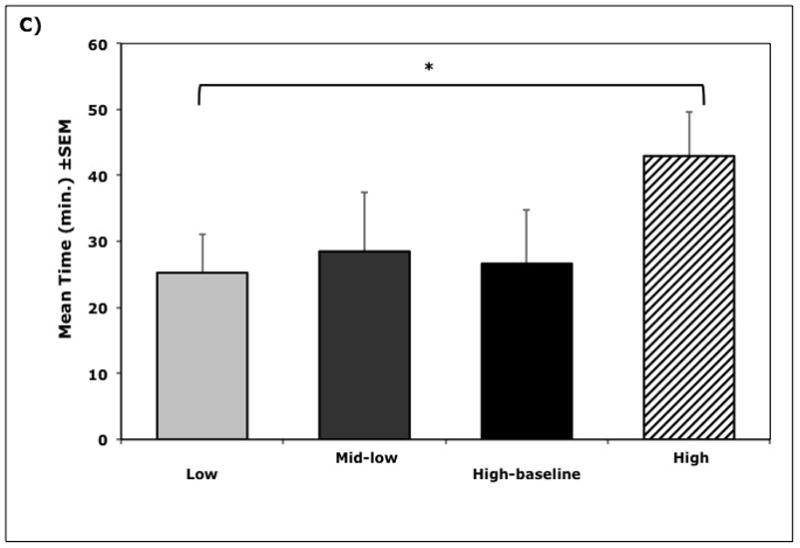
Relationships between cortisol cluster membership and behavior (n = 38). A) Mean frequency (±SEM) of displaced aggressive behaviors during exposure to novel objects, B) Mean (±SEM) emotionality ratings during exposure to novel objects, and C) Mean latency (±SEM) to approach and contact the novel objects, showing the longer latencies for High Cortisol Cluster animals (Cluster I). Significance indicated by * p < 0.05 and ** p < 0.01.
Individuals in the High Cluster were also rated significantly higher on global emotionality (F(1, 35) = 4.61, p = 0.04) compared to all other animals, but only differed significantly from the Low Cluster group (p < 0.05). High Cluster animals also took substantially longer to touch the novel object (F(1, 35) = 4.96, p = 0.03) compared to all other animals, but only differed significantly from the Low Cluster animals (p < 0.05). The High Cluster was different on every scored behavior from the Low Cluster (p values < 0.05) but not as substantially different from the two intermediate groups (p values > 0.3). Similarly, animals in the Low Cluster were not significant different from the two mid-cortisol cluster groups (p values > 0.7).
Group Differences in Brain Asymmetry
Each hemisphere was divided into three regions (frontal, temporal, parietal/occipital) and segmentation used to delineate GM and WM volumes (Table 1). Tissue volumes in the parcellated lobar regions were analyzed separately for GM and WM with age and ICV included as covariates. Larger GM volumes were evident in the right hemisphere, and a significant interaction term in the ANOVA indicated that the degree of hemispheric asymmetry differed between the lower and higher cortisol animals, (F(1, 14) = 7.35, p = 0.02). Post hoc univariate ANOVAs using the difference score (right – left) revealed that the lower cortisol animals had larger GM volumes in the right hemisphere (p < 0.03), whereas the higher cortisol animals exhibited a more symmetrical pattern with decreased GM in the right hemisphere (Fig. 4a). Analyses of the WM tissue volumes indicated a similar significant interaction between the cortisol profiles and the degree of hemispheric asymmetry, (F(1, 14) = 5.21, p = 0.04) (Fig. 4b). For those animals showing a hemispheric bias, it was due to relatively more WM in the right hemisphere, which was found to be more prominent in lower cortisol animals (p < 0.001). A significant interaction term also indicated that there were Group by WM Lobe differences in the right and left hemispheres (F(2, 13) = 4.23, p = 0.04).
Table 1.
Cortical gray and white matter volumes for the lower- and higher-cortisol animals.
| Lobes | Left Hemisphere |
Right Hemisphere |
L v. R |
||||
|---|---|---|---|---|---|---|---|
| Frontal | Temporal | Occipital/Parietal | Frontal | Temporal | Occipital/Parietal | ||
| Low | |||||||
| GM | 5795 (449) | 5996 (342) | 8063 (553) | 5869 (406) | 6078 (313) | 8073 (580) | L < R (p = .01) |
| WM | 2438 (250) | 2154 (171) | 3432 (304) | 2468 (250) | 2217 (175) | 3503 (293) | L < R (p < .001) |
| High | |||||||
| GM | 5550 (669) | 5877 (581) | 7800 (967) | 5619 (674) | 5909 (617) | 7683 (967) | L = R |
| WM | 2344 (240) | 2067 (188) | 3296 (275) | 2372 (231) | 2092 (202) | 3341 (300) | L < R (p < .001) |
Data are presented as means and SD, prior to correction for intracranial volume (ICV). Statistical comparisons of hemispheric volumes were calculated using ICV as a covariate. Gray matter (GM), white matter (WM), left (L), right (R).
Figure 4.
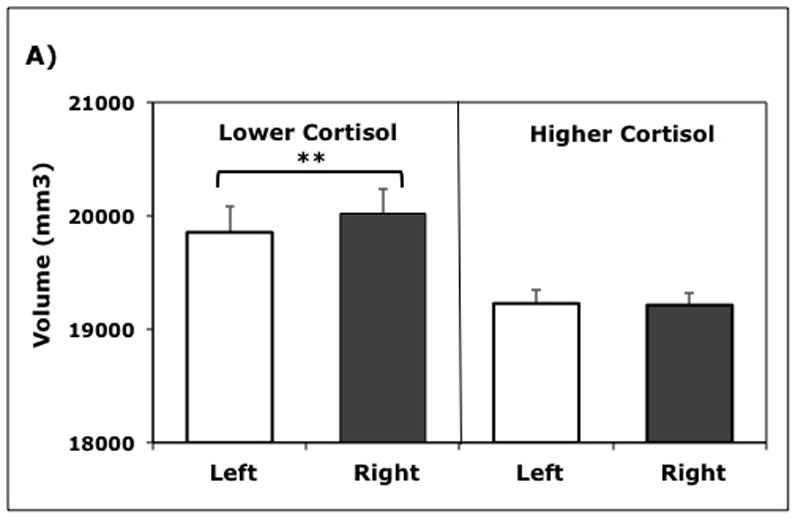
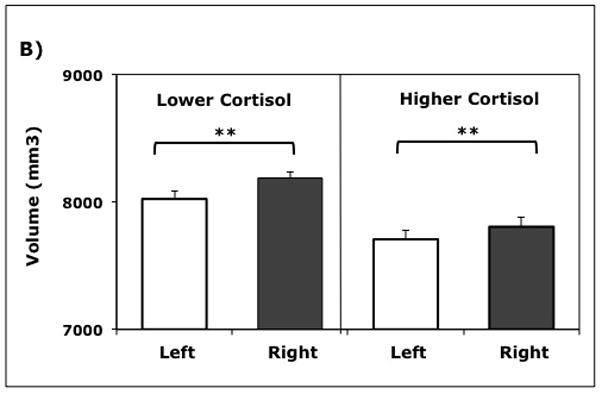
Hemispheric tissue volumes were significantly different for higher and lower cortisol animals (n = 18), both for gray matter (GM) (p = 0.013) and white matter (WM) (p = 0.034). Post hoc testing verified differences in hemispheric asymmetry: A) Right hemisphere GM was significantly larger only in low cortisol animals (p = 0.015); B) Right hemisphere WM was significantly larger in both groups of animals (p < 0.001). Mean (±SEM) tissue volumes (mm3) in each hemisphere are shown.
Correlational analyses of brain volumes and cortisol levels more specifically highlighted the linkage with individual variation in stress responses. Although the commonly reported association between HPA activity and hippocampal volume was not found, a larger cortisol response to the housing relocation was significantly associated with smaller cortical GM volumes (r(16)= −0.52, p < 0.05) and increased CSF volumes (r(16) = 0.72, p < 0.01) indicative of relatively less brain tissue (Fig. 5a, b). The robust inverse association between cortisol and global GM volumes was driven primarily by the GM volumes in specific regions: prefrontal (r(16) = −0.51, p < 0.05), frontal (r(16) = −0.68, p < 0.01), and parietal lobes (r(16) = −0.54, p < 0.05). Significant associations were not observed for the occipital and temporal lobes. In addition, the significant correlations between brain volumes and cortisol were also not as evident with basal levels or the reduced values induced by overnight treatment with Dex (data not presented).
Figure 5.
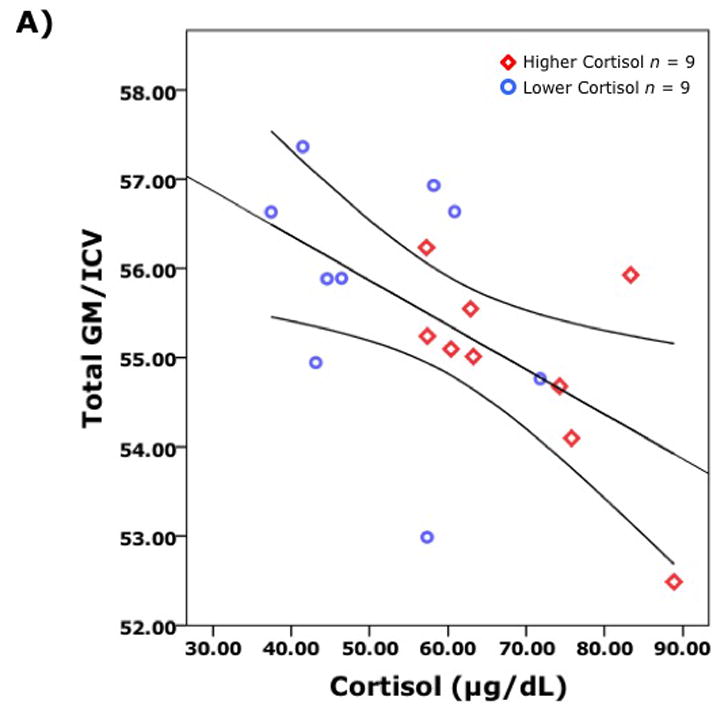
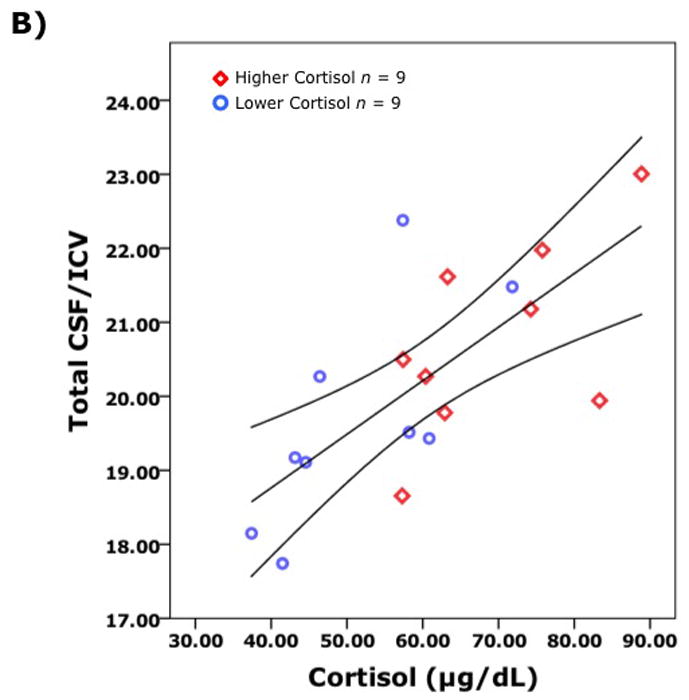
Global brain volumes were significantly correlated with cortisol levels following relocation (n = 18). Pearson partial correlations, controlling for age and intracranial volumes, are shown for: A) Total gray matter (GM) and cortisol r = −0.62 (p = 0.008) and, B) Total cerebrospinal fluid (CSF) and cortisol r =0 .67 (p = 0.003). The GM and the CSF volumes are corrected to account for differences in total brain size as indexed by intracranial volume (ICV).
Discussion
Our survey of a large number of juvenile monkeys identified patterns of HPA activity that were associated with behavioral reactivity to novel stimulus objects. Monkeys with the highest cortisol levels responded more to the new housing and also showed decreased sensitivity to the glucocorticoid feedback induced by Dex. In the presence of novel objects they were more behaviorally inhibited, (i.e., less likely to approach and explore the objects), showed more displaced aggression, and were rated as more emotionally reactive. Distinctly different behavioral dispositions were observed in monkeys that had lowest cortisol levels after the housing relocation. Specifically, the Low Cluster animals adapted quicker to the new environment and were more sensitive to Dex. These individuals were more likely to approach and interact with the novel objects and displayed fewer distress behaviors. Structural MRI scans acquired on individuals at the extreme ends of this continuum revealed that behavioral inhibition and higher cortisol activity were associated with less pronounced hemispheric brain asymmetry. The more symmetrical brains of the animals with higher cortisol were due to reduced GM in several regions of the right hemisphere. Closer inspection of the HPA profiles revealed that it was group differences in stress reactivity primarily that were associated with the variation in neural structure. Smaller cortical GM and WM volumes as well as increased CSF were significantly correlated with higher cortisol after relocation. Robust inverse associations with GM and WM volumes were evident in several cortical regions including prefrontal, frontal and parietal cortex.
The roots of the study of temperament and personality can be found in many disciplines, and speculation about typologies and their relationship to biology and health can be traced back in both western and eastern writings for over two millennia. Variation in the attributes of behavioral inhibition, such as fearfulness, timidity or shyness, are evident across many taxa, from invertebrates and fish on up to higher primates (Stevenson-Hinde et al., 1980; Gosling, 2001). Because an individual’s perception and behavioral response to the environment are integrally tied to physiological regulatory systems, heightened vigilance and behavioral reactivity can have downstream effects on physiological functioning (Cavigelli and McClintock, 2003). We speculate that these physiological patterns may have psychological and physical health implications, especially if sustained (see McEwen, 2007). Strong associations have been reported between highly fearful or inhibited temperament in childhood and the risk for mood and anxiety disorders in adults later in life (Rosenbaum et al., 1993; Biederman et al., 2001; Essex et al., 2010). Similar to the current findings on monkeys, many studies have found that inhibited children have higher heart rates and salivary cortisol levels in response to novelty and psychosocial stressors (Kagan et al., 1987; Nachmias et al., 1996). The validity of this construct is further evident in the association with brain structure and size. Individuals high in neuroticism (Knutson et al., 2001) and with greater anxiety (Ganzel et al., 2013) have reduced cortical and prefrontal GM volumes, and increased amygdala volumes. Another survey of approximately 592 juvenile monkeys also found that high stress-induced cortisol was linked with smaller total cerebral GM volumes (Fox et al., 2012). Our study emphasizes the likelihood of reciprocal biobehavioral links given that animals defined by higher cortisol levels showed unique patterns of behavioral inhibition and relative symmetry of the cortical hemispheres.
Temperament differences and reactions to novelty are commonly reported to be associated with the excitability of limbic and striatal-prefrontal circuitry (Fox et al., 2005; McEwen, 2007). There is also a parallel literature that has identified the relationship between emotionality and the asymmetry of regional activation (Davidson and Hugdahl, 1996). Our MRI analyses used a global and regional approach to investigate relative hemispheric asymmetry, based on the hypothesis that hemispheric dominance would be related to HPA activity and have behavioral consequences (Bisazza et al., 1998; Hugdahl, 2005). A prominent neural characteristic of the behaviorally inhibited monkeys was more symmetrical hemispheres due to decreased GM in the right hemisphere. Many differences in tissue volumes have been described in adolescents and adults with stress-related disorders, including depression, anxiety, and schizophrenia (Bremner, 1999; Gur et al., 1999; Knutson et al., 2001; Ganzel et al., 2013). There are also a number of neurodevelopmental disorders, including Williams Syndrome (Van Essen et al., 2006) and attention deficit disorder (Shaw et al., 2009), which present with an atypical level of cerebral symmetry, both globally and in specific cortical regions. Less asymmetry in the parietal lobe is also seen in a subset of children with dyslexia (Beaton, 1997). In addition, more symmetrical sulcal patterning of the cortex has been described in many individuals with schizophrenia (Csernansky et al., 2008). Moreover, there is substantial support for the link between relative activation of the left and right frontal cortical poles with approach-withdrawal motivational tendencies and with positive and negative affect (Buss et al., 2003; Harmon-Jones et al., 2010). Asymmetrical activation and hemispheric dominance can facilitate more efficient cognitive and sensory processing (Catani et al., 2007).
It is known that the antecedents of brain asymmetry originate early during the fetal and infancy periods (Geshwind and Galaburda, 1985; Levin, 2004). Thus, it is possible that higher cortisol levels during prenatal and early postnatal development can affect the neurogenesis and synaptogenesis related to cortical expansion and the emergence of hemispheric dominance (Reynolds, 2013). Glucocorticoid receptors are expressed on neurons throughout the brain, including the neocortex and subcortical structures (cerebellum, hippocampus, pituitary, pallidum) (Sanchez et al., 2000). Exposure to excessive glucocorticoids during the prenatal and early postnatal periods can also affect stress reactivity and sensitivity to glucocorticoid feedback later in adulthood (de Steenwinkel et al., 2014). We know that individual differences in temperament are already evident in monkeys soon after birth and are sustained over time. The cross-sectional design of our survey and the focus on the juvenile stage precluded a definitive designation of causality, but our findings do concur with the substantive literature indicating that somatic asymmetry both in the brain and periphery can affect many regulatory systems (Neveu, 1992; Westergaard et al., 2002). Once established, a more equivalent hemispheric structure could contribute in a reciprocal manner to greater difficulty in formulating and implementing behavioral strategies and the appearance of behavioral reticence in high arousal settings.
In addition to the challenge of definitively identifying the antecedent events, we should acknowledge some other limitations of the study, including the assessment of behavior in small social groups. This strategic approach was chosen to afford optimal conditions for the expression of individual behavior and normal endocrine activity in a naturally gregarious primate species, while lessening the potential confounds of either social isolation or behavioral observations in much larger and more complex groups. It is also important to acknowledge that the neuroimaging analyses were conducted with 18 monkeys. While larger than many primate neuroimaging studies, the sample size precluded further investigations into the neurobiology of all four endophenotypes, which would have required imaging of the two intermediate clusters. Despite this small number of monkeys scanned, it was possible to delineate brain-behavior associations by using an extreme group design. Selection of uniform groups representing both ends of behavioral and hormonal continuums can be a powerful and informative approach, and has often been employed in developmental research on inhibited children (Fox et al., 2005). In order to enhance our ability to generalize to other monkeys from the larger population, we also scanned 6 additional monkeys beyond those statistically grouped into the High- and Low-Cortisol Clusters and found that similar differences in neural structure were evident.
We know from other neuroimaging studies of developing monkeys that there continue to be maturational changes in brain structure beyond the juvenile period and through puberty, but it is unlikely that this neuronal pruning and cortical thinning with age would substantially alter the marked differences in the degree of hemispheric asymmetry (Knickmeyer et al., 2010). However, it remains to be determined if brain asymmetry continues to affect behavioral expression and even health in adult monkeys the way that their handedness has been reported to influence immune responses, morbidity, and even longevity (Westergaard et al., 2003). But even if evident only during the juvenile stage, this population variation in neuroendocrine and behavioral propensities would already have significant consequences under natural conditions because it would affect social interactions, exploration, and probably the age at emigration to a new troop.
In sum, the current study highlights the utility of using HPA activity to discern population variation in endophenotypes that may have predictive and consequences for health, although future studies will be required to address the long-term outcomes. Regardless, the findings build upon the extant literature that temperament and personality are instantiated within the individual’s physiology by showing that the differences in brain structure and hormone activity are discernable as well. The clusters were defined using cortisol as the biomarker, but proved to be informative at the level of behavior and brain differences as well.
Acknowledgments
Role of Funding Source
This research was supported in part by NIH funding to CLC (HD057064, AI067518) and to MAS (MH091645). SJS was supported by a NIMH predoctoral fellowship during this research and is currently supported by a K award from NIMH (1K01MH099411)
The funding source(s) did not play a role in the study design, data collection, analysis or interpretation of the data. Manuscript preparation was independent of any funding source(s) as was the decision to submit this manuscript for publication.
Special acknowledgements are due for M. Luck, H. Crispen, L. Gajewski, A. Slukvina and the Animal Care Staff for technical assistance with the animal care and experimental procedures.
Footnotes
Conflict of Interest
SJS, GRL, EAS, MAS, JHG, and CLC all declare that there is no actual or potential conflict of interest related to the submitted manuscript.
Contributors
Authors Short and Coe designed the study and wrote the protocol. Author Short, Lubach, and Coe carried out or supervised all methodological aspects of the study. Authors Gilmore and Styner were instrumental in the processing and analysis of MRI data. Authors Short and Shirtcliff undertook the statistical analyses, and author Short wrote the first draft of the manuscript. All authors contributed to and have approved the final manuscript.
Publisher's Disclaimer: This is a PDF file of an unedited manuscript that has been accepted for publication. As a service to our customers we are providing this early version of the manuscript. The manuscript will undergo copyediting, typesetting, and review of the resulting proof before it is published in its final citable form. Please note that during the production process errors may be discovered which could affect the content, and all legal disclaimers that apply to the journal pertain.
References
- Beaton AA. The relation of planum temporale asymmetry and morphology of the corpus callosum to handedness, gender and dyslexia: a review of the evidence. Brain Lang. 1997;60:255– 322. doi: 10.1006/brln.1997.1825. [DOI] [PubMed] [Google Scholar]
- Bergman LR, El-Khouri B. SLEIPNER. A statistical package for pattern-oriented analysis. Stockholm: Department of Psychology, Stockholm University; 1998. [Google Scholar]
- Biederman J, Hirshfeld-Becker DR, Rosenbaum JF, Herot C, Friedman D, Snidman N, Kagan J, Faraone SV. Further evidence of association between behavioral inhibition and social anxiety in children. Am J Psychiatry. 2001;158:1673–1679. doi: 10.1176/appi.ajp.158.10.1673. [DOI] [PubMed] [Google Scholar]
- Bisazza A, Rogers LJ, Vallortigara G. The origins of cerebral asymmetry: a review of evidence of behavioural and brain lateralization in fishes, reptiles, and amphibians. Neurosci Biobehav Rev. 1998;22:411–426. doi: 10.1016/s0149-7634(97)00050-x. [DOI] [PubMed] [Google Scholar]
- Bolig R, Price CS, O’Neill PL, Suomi SJ. Subjective assessment of reactivity level and personality traits of rhesus monkeys. Int J Primatol. 1992;13:287–306. [Google Scholar]
- Bremner JD. Does stress damage the brain? Biol Psychiatry. 1999;45:797–805. doi: 10.1016/s0006-3223(99)00009-8. [DOI] [PubMed] [Google Scholar]
- Buss KA, Malmstadt Schumacher JR, Dolski I, Kalin NH, Goldsmith H, Davidson RJ. Right frontal brain activity, cortisol and withdrawal behavior in 6-month-old infants. Behav Neurosci. 2003;117:11–20. doi: 10.1037//0735-7044.117.1.11. [DOI] [PubMed] [Google Scholar]
- Byrne G, Suomi SJ. Cortisol reactivity and its relation to home cage behavior and personality ratings in tufted capuchin Cebus paella juveniles from birth to six years of age. Psychoneuroendocrinology. 2003;27:139–154. doi: 10.1016/s0306-4530(01)00041-5. [DOI] [PubMed] [Google Scholar]
- Capitanio JP, Mendoza SP, Lerche NW. Individual differences in peripheral blood immunological and hormonal measures in adult male rhesus macaques Macaca mulatta: Evidence for temporal and situational consistency. Am J Primatol. 1998;44:29–41. doi: 10.1002/(SICI)1098-2345(1998)44:1<29::AID-AJP3>3.0.CO;2-Z. [DOI] [PubMed] [Google Scholar]
- Catani M, Allin MPG, Husain M, Pugliese L, Mesulam MM, Murray RM, Jones DK. Symmetries in human brain language pathways correlate with verbal recall. Proc Natl Acad Sci USA. 2007;104:17163–17168. doi: 10.1073/pnas.0702116104. [DOI] [PMC free article] [PubMed] [Google Scholar]
- Cavigelli SA, McClintock MK. Fear of novelty in infant rats predicts adult corticosterone dynamics and an early death. Proc Natl Acad Sci USA. 2003;100:16131–16136. doi: 10.1073/pnas.2535721100. [DOI] [PMC free article] [PubMed] [Google Scholar]
- Cerqueira JJ, Mailliet F, Almeida OF, Jay TM, Sousa N. The prefrontal cortex as a key target of the maladaptive response to stress. J Neurosci. 2007;27:2781–2787. doi: 10.1523/JNEUROSCI.4372-06.2007. [DOI] [PMC free article] [PubMed] [Google Scholar]
- Chrousos GP, Gold PW. The concepts of stress and stress system disorders. Overview of physical and behavioral homeostasis. JAMA. 1992;267:1244–1252. [PubMed] [Google Scholar]
- Coe CL, Franklin D, Smith ER, Levine S. Hormonal responses accompanying fear and agitation in the squirrel monkey. Physiol Behav. 1982;29:1051–1057. doi: 10.1016/0031-9384(82)90297-9. [DOI] [PubMed] [Google Scholar]
- Csernansky JG, Gillespie SK, Dierker DL, Anticevic A, Wang L, Barch DM, Van Essen DC. Asymmetric abnormalities in sulcal patterning in schizophrenia. Neuroimage. 2008;43:440–446. doi: 10.1016/j.neuroimage.2008.07.034. [DOI] [PMC free article] [PubMed] [Google Scholar]
- Davidson RJ, Hugdalh K. Brain Asymmetry. MIT Press; Boston, MA: 1996. [Google Scholar]
- Del Giudice M, Ellis BJ, Shirtcliff EA. The adaptive calibration model of stress responsivity. Neurosci Biobehav Rev. 2011;35:1562–1592. doi: 10.1016/j.neubiorev.2010.11.007. [DOI] [PMC free article] [PubMed] [Google Scholar]
- de Steenwinkel FDO, Hokken-Koelega ACS, Hazes JMW, Dolhain RJEM. The influence of foetal prednisone exposure on cortisol levels in the offspring. Clin Endocrinol. 2014 doi: 10.1111/cen.12388. [DOI] [PubMed] [Google Scholar]
- Dickerson SS, Kemeny ME. Acute stressors and cortisol responses: a theoretical integration and synthesis of laboratory research. Psychol Bull. 2004;130:355–391. doi: 10.1037/0033-2909.130.3.355. [DOI] [PubMed] [Google Scholar]
- Essex MJ, Klein MH, Slattery MJ, Goldsmith HH, Kalin NH. Early risk factors and developmental pathways to chronic high inhibition and social anxiety disorder in adolescence. Am J Psychiatry. 2010;167:40–46. doi: 10.1176/appi.ajp.2009.07010051. [DOI] [PMC free article] [PubMed] [Google Scholar]
- Fox AS, Oler JA, Shackman AJ, Alexander AL, Davidson RJ, Kalin NH. Cortisol predicts decreased cerebral cortical volume in 592 young non-human primates. Eur J Psychotraumatol. 2012;(S1):3. http://dx.doi.org/10.3402/ejpt.v3i0.19331.
- Fox NA, Henderson HA, Marshall PJ, Nichols KE, Ghera MM. Behavioral inhibition: linking biology and behavior within a developmental framework. Annu Rev Psychol. 2005;56:235–262. doi: 10.1146/annurev.psych.55.090902.141532. [DOI] [PubMed] [Google Scholar]
- Ganzel BL, Kim P, Gilmore H, Tottenham N, Temple E. Stress and the healthy adolescent brain: evidence for the neural embedding of life events. Dev Psychopathol. 2013;25:879–889. doi: 10.1017/S0954579413000242. [DOI] [PubMed] [Google Scholar]
- Geschwind N, Galaburda AM. Cerebral lateralization: biological mechanisms, associations and pathology. I. A hypothesis and a program of research. Arch Neurol. 1985;42:428– 459. doi: 10.1001/archneur.1985.04060050026008. [DOI] [PubMed] [Google Scholar]
- Gosling SD. From mice to men: What can we learn about personality from animal research? Psychol Bull. 2001;127:45–86. doi: 10.1037/0033-2909.127.1.45. [DOI] [PubMed] [Google Scholar]
- Gould E, McEwen BS, Tanapat P, Galea LAM, Fuchs E. Neurogenesis in the dentate gyrus of the adult tree shrew is regulated by psychosocial stress and NMDA receptor activation. J Neurosci. 1997;17:2492–2498. doi: 10.1523/JNEUROSCI.17-07-02492.1997. [DOI] [PMC free article] [PubMed] [Google Scholar]
- Gur RE, Turetsky BI, Bilker WB, Gur RC. Reduced gray matter volume in schizophrenia. Arch Gen Psychiatry. 1999;56:905–911. doi: 10.1001/archpsyc.56.10.905. [DOI] [PubMed] [Google Scholar]
- Harmon-Jones E, Gable PA, Peterson CK. The role of asymmetric frontal cortical activity in emotion-related phenomena: a review and update. Biol Psychiatry. 2010;84:451–462. doi: 10.1016/j.biopsycho.2009.08.010. [DOI] [PubMed] [Google Scholar]
- Heim C, Ehlert U, Hellhammer DH. The potential role of hypocortisolism in the pathophysiology of stress-related bodily disorders. Psychoneuroendocrinology. 2000;25:1–35. doi: 10.1016/s0306-4530(99)00035-9. [DOI] [PubMed] [Google Scholar]
- Herman JP, Figueiredo H, Mueller NK, Ulrich-Lai Y, Ostrander MM, Choi DC, Cullinan WE. Central mechanisms of stress integration: hierarchical circuitry controlling hypothalamo-pituitary-adrenocortical responsiveness. Front Neuroendocrinol. 2003;24:151–180. doi: 10.1016/j.yfrne.2003.07.001. [DOI] [PubMed] [Google Scholar]
- Hruschka DJ, Kohrt BA, Worthman CM. Estimating between- and within-individual variation in cortisol levels using multilevel models. Psychoneuroendocrinology. 2005;30:698–714. doi: 10.1016/j.psyneuen.2005.03.002. [DOI] [PubMed] [Google Scholar]
- Hugdahl K. Symmetry and asymmetry in the human brain. Eur Rev. 2005;13:119–133. [Google Scholar]
- Kagan J, Reznick JS, Snidman N. The physiology and psychology of behavioral inhibition in children. Child Dev. 1987;58:1459–1473. [PubMed] [Google Scholar]
- Kalin NH, Shelton SE, Davidson RJ. Cerebrospinal fluid corticotropin-releasing hormone levels are elevated in monkeys with patterns of brain activity associated with fearful temperament. Biol Psychiatry. 2000;47:579–585. doi: 10.1016/s0006-3223(99)00256-5. [DOI] [PubMed] [Google Scholar]
- Kirschbaum C, Kudielka BM, Gaab J, Schommer NC, Hellhammer D. Impact of gender, menstrual cycle phase and oral contraceptives on the activity of the hypothalamic– pituitary–adrenalaxis. Psychosom Med. 1999;61:154–162. doi: 10.1097/00006842-199903000-00006. [DOI] [PubMed] [Google Scholar]
- Kirschbaum C, Pirke KM, Hellhammer DH. The ‘Trier Social Stress Test’--a tool for investigating psychobiological stress responses in a laboratory setting. Neuropsychobiology. 1993;28:76–81. doi: 10.1159/000119004. [DOI] [PubMed] [Google Scholar]
- Knickmeyer RC, Styner M, Short SJ, Lubach GR, Kang C, Hamer R, Coe CL, Gilmore JH. Maturational trajecotories in cortical development through the pubertal transition. Unique species and gender differences in the monkey revealed through structural magnetic resonance imaging. Cereb Cortex. 2010;20:1053–1063. doi: 10.1093/cercor/bhp166. [DOI] [PMC free article] [PubMed] [Google Scholar]
- Knutson B, Momenan R, Rawlings RR, Fong GW, Hommer D. Negative association of neuroticism with brain volume ratio in healthy humans. Biol Psychiatry. 2001;50:685–690. doi: 10.1016/s0006-3223(01)01220-3. [DOI] [PubMed] [Google Scholar]
- LeDoux JE. Emotion circuits in the brain. Annu Rev Neurosci. 2000;23:155–184. doi: 10.1146/annurev.neuro.23.1.155. [DOI] [PubMed] [Google Scholar]
- Levin M. Embryonic origins of left-right asymmetry. Crit Rev Oral Biol Med. 2004;15:197– 206. doi: 10.1177/154411130401500403. [DOI] [PubMed] [Google Scholar]
- Lupien SJ, McEwen BS, Gunnar MR, Heim C. Effects of stress throughout the lifespan on the brain, behaviour and cognition. Nat Rev Neurosci. 2009;10:434–445. doi: 10.1038/nrn2639. [DOI] [PubMed] [Google Scholar]
- McEwen BS. The neurobiology of stress: from serendipity to clinical relevance. Brain Res. 2000;886:172–189. doi: 10.1016/s0006-8993(00)02950-4. [DOI] [PubMed] [Google Scholar]
- McEwen BS. Physiology and neurobiology of stress and adaptation: central role of the brain. Physiol Rev. 2007;87:873–904. doi: 10.1152/physrev.00041.2006. [DOI] [PubMed] [Google Scholar]
- Nachmias M, Gunnar M, Mangelsdorf S, Parritz RH. Behavioral inhibition and stress reactivity: the moderating role of attachment security. Child Dev. 1996;67:508–522. [PubMed] [Google Scholar]
- Neveu PJ. Asymmetrical brain modulation of immune reactivity in mice: a model of studying inter-individual differences and physiological population heterogeneity. Life Sci. 1992;50:1–6. doi: 10.1016/0024-3205(92)90190-z. [DOI] [PubMed] [Google Scholar]
- Plotsky PM, Owens MJ, Nemeroff CB. Psychoneuroendocrinology of depression. Hypothalamic-pituitary-adrenal axis. Psychiatr Clin North Am. 1998;21:293–307. doi: 10.1016/s0193-953x(05)70006-x. [DOI] [PubMed] [Google Scholar]
- Reynolds RM. Glucocorticoid excess and the developmental origins of disease: two decades of testing the hypothesis. Psychoneuroendocrinology. 2013;38:1–11. doi: 10.1016/j.psyneuen.2012.08.012. [DOI] [PubMed] [Google Scholar]
- Rosenbaum JF, Biederman J, Bolduc-Murphy EA, Faraone SV, Chaloff J, Hirshfeld DR, Kagan J. Behavioral inhibition in childhood: a risk factor for anxiety disorders. Harv Rev Psychiatry. 1993;1:2–16. doi: 10.3109/10673229309017052. [DOI] [PubMed] [Google Scholar]
- Sanchez MM, Young LJ, Plotsky PM, Insel TR. Distribution of corticosteroid receptors in the rhesus brain: relative absence of glucocorticoid receptors in the hippocampal formation. J Neurosci. 2000;20:4657–4668. doi: 10.1523/JNEUROSCI.20-12-04657.2000. [DOI] [PMC free article] [PubMed] [Google Scholar]
- Shaw P, Lalonde F, Lepage C, Rabin C, Eckstrand K, Sharp W, Greenstein D, Evans A, Giedd JN, Rapoport J. Development of cortical asymmetry in typically developing children and its disruption in attention deficit/hyperactivity disorder. Arch Gen Psychiatry. 2009;66:888–896. doi: 10.1001/archgenpsychiatry.2009.103. [DOI] [PMC free article] [PubMed] [Google Scholar]
- Shirtcliff EA, Granger DA, Booth A, Johnson D. Low salivary cortisol levels and externalizing behavior problems in youth. Dev Psychopathol. 2005;17:167–184. doi: 10.1017/s0954579405050091. [DOI] [PubMed] [Google Scholar]
- Smyth J, Ockenfels M, Gorin A, Catley D, Porter L, Kirschbaum C, Hellhammer D, Stone A. Individual differences in the diurnal cycle of cortisol. Psychoneuroendocrinology. 1997;22:89–105. doi: 10.1016/s0306-4530(96)00039-x. [DOI] [PubMed] [Google Scholar]
- Stevenson-Hinde J, Stillwell-Barnes R, Zunz M. Individual differences in young rhesus monkeys: consistency in change. Primates. 1980;21:498–509. [Google Scholar]
- Stevenson-Hinde J, Zunz M. Subjective assessment of individual rhesus monkeys. Primates. 1978;19:473–482. [Google Scholar]
- Stone AA, Schwartz JE, Smyth J, Kirschbaum C, Cohen S, Hellhammer D, Grossman S. Individual differences in the diurnal cycle of salivary free cortisol: a replication of flattened cycles for some individuals. Psychoneuroendocrinology. 2001;26:295–306. doi: 10.1016/s0306-4530(00)00057-3. [DOI] [PubMed] [Google Scholar]
- Styner M, Knickmeyer R, Joshi S, Coe C, Short SJ, Gilmore JH, Pluim JPW, Teinhardt JM. Automatic brain segmentation in rhesus monkeys. Proc SPIE. 2007;6512:65122L. [Google Scholar]
- Suomi SJ. Early determinants of behavior: evidence from primate studies. Br Med Bull. 1997;53:170–184. doi: 10.1093/oxfordjournals.bmb.a011598. [DOI] [PubMed] [Google Scholar]
- Uno H, Eisele S, Sakai A, Shelton S, Baker E, DeJesus O, Holden J. Neurotoxicity of glucocorticoids in the primate brain. Horm Behav. 1994;28:336–348. doi: 10.1006/hbeh.1994.1030. [DOI] [PubMed] [Google Scholar]
- Van Essen DC, Dierker D, Snyder AZ, Raichle ME, Reiss AL, Korenberg J. Symmetry of cortical fold abnormalities in Williams Syndrome revealed by surface-based analyses. J Neurosci. 2006;26:5470–5483. doi: 10.1523/JNEUROSCI.4154-05.2006. [DOI] [PMC free article] [PubMed] [Google Scholar]
- Vyas A, Mitra R, Shankaranarayana Rao BS, Chattarji S. Chronic stress induces contrasting patterns of dendritic remodeling in hippocampal and amygdaloid neurons. J Neurosci. 2002;22:6810–6818. doi: 10.1523/JNEUROSCI.22-15-06810.2002. [DOI] [PMC free article] [PubMed] [Google Scholar]
- Westergaard GC, Suomi SJ, Higley JD. Handedness is associated with immune functioning and behavioral reactivity in rhesus macaques. Laterality. 2002;7:359–368. doi: 10.1080/13576500143000230. [DOI] [PubMed] [Google Scholar]
- Westergaard GC, Chavanne TJ, Lussier ID, Houser L, Cleveland A, Suomi SJ, Higley JD. Left handedness is correlated with CSF monoamine metabolite and plasma cortisol concentrations and with impaired sociality in free-ranging adult male rhesus macaques. Laterality. 2003;8:169–187. doi: 10.1080/713754484. [DOI] [PubMed] [Google Scholar]
- Wüst S, Federenko IS, van Rossum EF, Koper JW, Hellhammer DH. Habituation of cortisol responses to repeated psychosocial stress-further characterization and impact of genetic factors. Psychoneuroendocrinology. 2005;30:199–211. doi: 10.1016/j.psyneuen.2004.07.002. [DOI] [PubMed] [Google Scholar]


