

Abstract
ABL1 tyrosine-kinase inhibitors (TKI) are a front-line therapy for chronic myelogenous leukemia and represent the best known examples of targeted cancer therapeutics. However, the dynamic uptake of low molecular weight TKIs into cells and their intracellular behavior is largely unknown due to the difficulty of observing non-fluorescent small molecules at subcellular resolution. Here we report the direct label-free visualization and quantification of two TKI drugs – imatinib and nilotinib inside living cells using hyperspectral stimulated Raman scattering imaging. Both drugs were enriched over 1000-fold in lysosomes as a result of their lysosomotropic properties. In addition, low solubility appeared to contribute significantly to the surprisingly large accumulation of nilotinib. We further show that the lysosomal trapping of imatinib was reduced by more than 10-fold when using chloroquine simultaneously, suggesting that chloroquine may increase the efficacy of TKIs through lysosome mediated drug-drug interaction besides the commonly proposed autophagy inhibition mechanism.
Keywords: Raman spectroscopy, Hyperspectral SRS imaging, Tyrosine kinase inhibitor, Lysosomotropism
INTRODUCTION
The Abelson tyrosine kinase (ABL1) is an enzyme which is ubiquitously expressed in cells. Its tyrosine phosphorylation capacity is tightly regulated. Genetic damage in a hematopoietic cell can lead to a t(9;22)(q34,q11) chromosome translocation resulting in expression of the chimeric BCR-ABL1 oncoprotein, in which ABL1 is constitutively active. This oncoprotein causes chronic myeloid leukemia (CML), which is invariably fatal if left untreated1. Imatinib (Gleevec®, Novartis Pharmaceuticals) is the first-in-class ABL1 tyrosine kinase inhibitor, used for the treatment of Philadelphia chromosome positive CML; nilotinib (Tasigna®, Novartis Pharmaceuticals) is a more potent and more selective drug, used in the same indication2. Whereas imatinib and nilotinib are ATP-competitive inhibitors of ABL which bind within the substrate ATP binding pocket of the kinase, two other agents, GNF-2 and GNF-5 are compounds which specifically inhibit the kinase activity of ABL1 via an allosteric mechanism3.
Recently chloroquine, a drug used to treat malaria, has been found to have synergistic effect with imatinib in models of CML and gastrointestinal stromal tumors (GIST)4,5. Chloroquine significantly increased imatinib-induced BCR-ABL expressing cell death from ~50% to 75%. Similar effects were observed in GIST cells. It was suggested that chloroquine, known to inhibit the autophagy pathway by neutralizing lysosomal pH6, could prevent the imatinib-treated CML and GIST cells from going through the autophagy-related survival mechanism, and thus providing the synergistic effect. This exciting possibility initiated clinical trials with combination drug treatment regimens in hematopoietic malignancies as well as in solid tumors. While autophagy inhibition was frequently proposed as a mechanism of synergistic effect of chloroquine or its hydroxychloroquine analog with targeted or cytotoxic cancer therapeutic agents4,5,7–9, studies on both small cell lung cancer and breast cancer cells found that the effects of chloroquine were non-specific and independent of autophagy10,11. The contribution of autophagy inhibition remains unclear in the synergistic effects observed in combination drug treatment.
The molecular biology, pharmacology and tissue distribution of imatinib and nilotinib are well established. However, little is known about their intracellular distribution. Eukaryotic cells provide compartmental conditions for most biochemical reactions. Endogenous small molecules, including inorganic ions, cofactors, amino acids, lipids and carbohydrates, are regulated and usually dependent on specific transporter to cross plasma, organelle and nuclear membranes12. In contrast, pharmaceuticals and xenobiotics, most of which have both lipophilic and hydrophilic groups, can only passively diffuse through the lipid-bilayer membrane in neutral form. Despite the subcellular behavior of drugs and xenobiotics being of great importance in pharmacology, toxicology and drug discovery, the membrane permeability, cytosol and organelle distribution, and transportation of such agents are poorly understood. The main reason for this is the lack of a technology capable of observing low-molecular-weight (LMW) compounds without labeling, and with enough spatial and temporal resolution to obtain time-lapse subcellular information.
Confocal Raman microscopy, a non-invasive and label-free imaging technique, has been shown to be able to trace drugs in living cells, but with limited speed and sensitivity13–17. Stimulated Raman Scattering (SRS) microscopy, with much improved sensitivity achieved by using a high-frequency phase-sensitive lock-in detection scheme, allows high-speed label-free chemical imaging with 3-D subcellular spatial resolution18. It has been used for the imaging of lipids, proteins, DNA and other high concentration species in cells and tissue19–21. However, direct imaging of the intracellular distribution of small drug-like molecules has not been demonstrated. Traditional SRS microscopy probes one Raman band at a time. Biological cells have strong background SRS signals, especially in the fingerprint region. In order to distinguish different molecules, both multiplex SRS and hyperspectral SRS (hsSRS) microscopy which allow imaging at multiple Raman frequencies have been developed22–25, enabling direct imaging of LMW compounds inside a living cell.
Here we report the first direct observation and quantification of imatinib, nilotinib and GNF-2/-5, so-called 1st, 2nd and 3rd generations of TKIs in living CML cells using hsSRS imaging. We show that both the lysosomotropic property and the solubility of these drugs play important roles in their uptake and selective accumulation inside cellular organelles. We also directly studied the interplay between chloroquine and these TKIs in living cells, providing new insights into the mechanism of their synergistic effect at the subcellular level.
RESULTS AND DISCUSSION
Spontaneous Raman spectroscopy of drug molecules
To identify suitable spectral range for hsSRS imaging, we first measured the spontaneous Raman spectra of five drug molecules with a commercial Horiba-Jobin-Yvon Raman spectrometer. The chemical structures of the drug molecules are shown in Fig. 1a and their corresponding Raman spectra are shown in Fig. 1b. The spectral regions of particular interests are around 1300 cm−1 and 1600 cm−1. Both imatinib and nilotinib exhibited strong Raman signals in these two regions, while GNF-2 and GNF-5 exhibited strong Raman signal in the 1600 cm−1 region. The Raman peaks around 1300 cm−1 were tentatively assigned to the C-C stretching of the bond between pyrimidine and pyridine based on Raman measurements of a tool compound 4-(3-pyridinyl)-2-pyrimidine amine; while the Raman peaks around 1600 cm−1 were attributed to overlapping aromatic ring stretching26. Chloroquine had a major peak around 1370 cm−1, which was attributed to quinoline ring stretching mode27.
Figure 1. Structure and spectral properties of five drug molecules imatinib, nilotinib, chloroquine, GNF-2, and GNF-5.

a, Chemical structures of the drug molecules. b, spontaneous Raman spectra of the drug molecules in the fingerprint region from 700 cm−1 to 1700 cm−1. The major peaks used for SRS imaging for each drug are marked with shaded vertical lines (~1300 cm−1 for imatinib and nilotinib, 1370 cm−1 for chloroquine, and ~1600 cm−1 for GNF2 and GNF5).
hsSRS imaging of drug accumulation inside cells
We imaged imatinib and nilotinib treated cells with a total of 20 SRS frames evenly spaced between 1236 cm−1 and 1497 cm−1 at a speed of 1.6 sec/frame. Fig. 2a and 2b show SRS images at 1305 cm−1 of 20 μM imatinib and nilotinib treated BaF3/BCR-ABL1 cells, respectively (supplementary Movie S1 show the hsSRS imaging data). Compared with the control cell treated only with DMSO (Fig. 2c), we observed several bright spots within both drug treated cells which resulted from drug accumulation inside the cell. The SRS spectra of the enclosed regions of interest (ROI, yellow circle) matched that of the SRS spectra of drugs in solution (Fig. 2d and 2e), but were different from cytosol spectra which had a broad peak around 1340 cm−1 (assigned to C-H deformation). Moreover, the drug spectra were similar to their spontaneous Raman counterpart (Fig. 1b) except for reduced spectral resolution due to the limitation of the current spectral focusing hsSRS setup. In both cases, SRS spectra substantiated that the bright spots within cells are indeed accumulation of drugs, not metabolic or morphological responses of cells. Because SRS signal of drugs exhibit linear relationship with concentration (supplementary Fig. S2), the concentration of drugs inside cells can be quantitatively determined based on calibrations of drug solutions at known concentration. In the cytosol, we did not observe cytosol SRS spectral shape change when compared to control cells without drug treatment (Fig. 2f), suggesting that cytosolic drug concentrations were below the current limit of detection (1–2 mM).
Figure 2. hsSRS microscopy reveals enrichment of drugs in living cells: the SRS spectra of bright spots in drug-treated cells match the SRS spectra of the drug in solution, but differ from that of cytosol.

a, Representative SRS images at 1305 cm−1 of 20 μM imatinib treated BaF3/BCR-ABL1 cells for 4 hours. b, Representative SRS images at 1305 cm−1 of 20 μM nilotinib treated BaF3/BCR-ABL1 cells for 4 hours. c. Representative SRS images at 1305 cm−1 of control cells treated with DMSO. d, SRS spectra of selected ROI (yellow polygon) in a and b. e, SRS spectra of 100 mM imatinib and 100 mM nilotinib solutions. f, comparison of average SRS spectra of cytosol (excluding brighter regions, n = 6) of imatinib treated, nilotinib treated and control BaF3/BCR-ABL1 cells. Scale bar: 5 μm.
To examine whether the accumulation of drugs was due to the binding of drugs to their targets, we imaged the drug uptake in BaF3/wt cells, which lack the BCR-ABL1 protein. Similar drug accumulations were observed in these control cells compared to that of BaF3/BCR-ABL1 cells (supplementary Fig. S3). Further comparison of the spectral intensities of accumulated drugs revealed that drug accumulations were comparable in these two types of cells (supplementary Fig. S3), suggesting that drug accumulations are independent of their binding to their target protein BCR-ABL1.
Determining the mechanism of drug accumulation
The three-dimensional distributions of drug accumulation revealed that both imatinib and nilotinib accumulated outside cell nuclei (supplementary Movie S2). Because both drugs are weak bases that can be protonated in acidic environment, the most likely sites of accumulation are lysosomes or related acidic organelles. To examine this hypothesis, we imaged drug treated BaF3/BCR-ABL1 cells that were simultaneously labeled with Lysotracker Red (Invitrogen), a fluorescent marker for lysosomes. Cells were incubated in the presence of 20 μM imatinib or nilotinib together with 50 nM Lysotracker Red for 4 hours before imaging. Both the SRS image and the two-photon fluorescence image were acquired simultaneously. Fig. 3a and 3d show the maximum intensity projection of three-dimensional SRS images of cells treated with imatinib or nilotinib at 1305 cm−1, while Fig. 3b and 3e show the maximum intensity projection of three-dimensional fluorescence images of the same cells (supplementary Movies S2 shows the corresponding three-dimensional sectioning images with 0.5 μm Z step). In both cases, the exact spatial overlap confirms that drugs are accumulated in lysosome or lysosome-related acidic organelles (Fig. 3c and 3f). Lysosomes were also stained in control cells not treated with any drug, but they did not show any difference in SRS intensity compared to the rest of the cytoplasm (Fig. 3g–i).
Figure 3. Accumulations of drugs in lysosomes are confirmed by simultaneous two-photon fluorescence imaging of lysotracker and SRS imaging of drug accumulation.

a–b, Maximum intensity projection of three-dimensional SRS images at 1305 cm−1 (a) and Lysotracker-Red fluorescence images (b) of 20 μM imatinib treated BAF3/BCR-ABL1 cells for 4 hours. c, Spatial overlap of the fluorescence image (red) and SRS image (green). d–e, Maximum intensity projection of three-dimensional SRS images at 1305 cm−1 (d) and Lysotracker-Red fluorescence images (e) of 20 μM nilotinib treated BaF3 cells for 4 hours. f, Spatial overlap of the fluorescence image (red) and SRS image (green). g–h, Maximum intensity projection of three-dimensional SRS images at 1305 cm−1 (g) and Lysotracker-Red fluorescence images (h) of control BaF3 cells. Scale bar: 5μm. j, Modified thermodynamic equilibrium model on lysosomotropism which includes solubility equilibrium. Protonated drug (DH+) needs to be deprotonated (neutral form D) in order to diffuse through the plasma membrane and the lysosomal membrane. Inside the lysosome, the drug exists mainly in protonated form due to the low pH and is no longer membrane-permeable. When the concentration of the protonated drug goes beyond its solubility, it would precipitate (DH+A−) inside the lysosome with counter ion A−.
It is known that many weak bases can readily diffuse through cell membranes in their neutral form, but will be trapped within lysosomes in the protonated form due to the pH difference between the two regions separated by the lysosomal membrane. This is commonly referred to as the lysosomotropic effect, which was discussed in great detail by C. De Duve in 197428. The much lower pH (pH = 4.5–5) of the lysosome compared with that of the cytoplasm (pH = 7–7.5) provides a driving force for intra-lysosomal accumulation of weak bases. Based on De Duve’s theory, drug molecules in their neutral form permeate the membrane at a much higher rate compared to their protonated form. The maximum concentration ratio is determined by the ratio of the lysosomal pH and extracellular pH. Assuming the pH in the lysosomes to be 4.5 and that in the medium to be 7.2, that ratio is 500. For weakly basic drugs that have pKa lower than 7 or drugs that have a high ratio of permeability rates, the maximum concentration ratio is lower.
One of the best known lysosomotropic agents is the anti-malaria drug chloroquine. To quantitatively examine the uptake of chloroquine into lysosomes, we incubated BaF3/BCR-ABL1 cells with 50 μM chloroquine for 2 hours. hsSRS imaging showed that the chloroquine accumulated inside lysosomes to give an average concentration of 50 mM (supplementary Fig. S4). Based on the SRS signal intensities, we calculated the concentration ratios of lysosomal drug to extracellular drug: chloroquine was enriched by 1000 (±128) fold, imatinib by 933 (±354) fold, and nilotinib by 2520 (±1520) fold. Both chloroquine and imatinib have pKa values larger than 8 (chloroquine pKa1 = 10.2, pKa2 = 8.3, imatinib pKa = 8.1), leading to an accumulation of ~1000-fold, a factor of 2 larger than predicted. The difference could be due to our rather simplified prediction model. A more complicated model taking into account the diffusion property, adsorption to lipids, and electrical attraction or repulsion has been shown to predict higher accumulation of chloroquine and other drugs29. Surprisingly, nilotinib accumulated by a factor of 80 times more than its predicted value of 32 based on its measured pKa of 6. We believe this is due to the relatively poor solubility of nilotinib at acidic pH (measured solubility is 2.6 μM at pH 2 and 0.4 μM at pH 6.8). As the accumulation of nilotinib in the lysosome exceeds its solubility, precipitation of nilotinib follows. The precipitation shifts the equilibrium such that more nilotinib molecules are transported into the lysosome and results in a much higher apparent nilotinib concentration inside the lysosome. In contrast, both imatinib and chloroquine have excellent water solubility at pH 4–5 (>400 mM) and therefore would not be subject to precipitation.
We further lowered the extracellular concentration of both drugs to determine whether the precipitation of nilotinib was responsible for the observed abnormal accumulation. When the extracellular concentration of both drugs were lowered from 20 μM to 4 μM, lysosomal drug concentration decreased by roughly 4- to 5-fold for imatinib, but by at least 30-fold for nilotinib (supplementary Fig. S5). The concentration-independent enrichment of imatinib (within experimental error) is consistent with the acid-base equilibrium predictions. In contrast, the strong concentration dependence of nilotinib enrichment supports our hypothesis that its precipitation plays an important role in lysosomal trapping: when the enriched nilotinib concentration is below its solubility, precipitation will not occur and the enrichment ratio will follow that predicted by acid-base equilibrium. Determination of the exact enrichment ratio for nilotinib without precipitation is limited by the inaccuracy in determining lysosomal drug SRS spectra at sub-mM concentration. Nonetheless, we show to our knowledge for the first time that the precipitation of low solubility compounds, in addition to the protonation of weak basic groups, provides another trapping mechanism for their lysosomal enrichment. The lysosomotropic model should therefore be modified to include the solubility equilibrium to better describe situations where the compound under study has low solubility (Fig. 3j).
To further examine whether autophagy plays an important role in imatinib/nilotinib uptake into lysosomes, we pre-incubated the BaF3/BCR-ABL1 cells with 5 mM 3-methyladenine (3MA) for 4 hours, before incubating the cells with drugs (20 μM) for another 2 hours. 3MA is a known autophagy inhibitor which works by blocking autophagosome formation via the inhibition of type III phosphatidylinositol 3-kinases30. No significant difference in lysosomal drug accumulation was observed for either imatinib or nilotinib (supplementary Fig. S5), suggesting that autophagy is not responsible for the observed drug enrichment in lysosomes.
For drugs that have pKa < 4.5, we do not expect to observe drug accumulation in lysosomes. GNF-2 and GNF-5 are two highly selective allosteric inhibitors of BCR-ABL13. Both drugs are predominantly unprotonated at pH 4–7. We incubated BaF3/BCR-ABL1 cells with the two drugs at a concentration of 50 μM for 2 hours. As predicted, hsSRS imaging did not reveal any significant accumulation in lysosomes (Fig. 4a). SRS images at 1600 cm−1 showed that neither drug penetrated into the nucleus. Therefore, the nucleus spectra did not change while the cytoplasm spectra had moderate increases in intensity around 1600 cm−1 (Fig. 4b). After subtracting the nucleus spectra from the cytoplasm spectra, we plotted the difference in subtracted spectra between drug treated cells and control cells (Fig. 4c). They were similar to the drug solution spectra (Fig. 4d), suggesting that the increases were due to drug accumulation in the cytoplasm. Based on the calibration of pure drug solutions, the cytosolic concentrations of both drugs were calculated to be around 2–3 mM, about 40–50 fold increase compared to extracellular concentration (Fig. 4e). The reason of such cytosolic enrichment remains unclear and requires further investigation.
Figure 4. hsSRS imaging of intracellular uptake of GNF-2/GNF-5 drug show that only cytoplasm spectra has moderate intensity increases at ~1600 cm−1 due to drug accumulation.

a, Representative SRS images at 1600 cm−1 of control BaF3/BCR-ABL1 cells, GNF-2 treated BaF3/BCR-ABL1 cells, and GNF-5 treated BaF3 cells show that both GNF-2 and GNF-5 selectively accumulate in the cytoplasm. b, Average SRS spectra (n =6) of cytosol (red), and nucleus (green) for control cells, GNF-2 treated cells, and GNF-5 treated cells. c, Subtraction of GNF-2 cytoplasm-nucleus difference spectra with that of control (pink) and subtraction of GNF5 cytoplasm-nucleus difference spectra with that of control cell (cyan). d, SRS spectra of 100 mM GNF-2 and GNF-5 solutions. Shaded area of the same color indicated the standard deviation of SRS spectral measurement on six cells. e, Calculated concentrations of GNF2 and GNF5 in the cytoplasm of drug treated BaF3/BCR-ABL1 cells. Scale bar: 5 μm.
Time course of drug uptake into lysosomes
Both the membrane permeation dynamics and thermodynamic equilibrium partition are important in determining the lysosomal uptake of drugs. To quantitatively evaluate the uptake rate of drugs into the lysosome, we performed hsSRS imaging of drug treated cells at different time points and determined the lysosomal concentrations of both imatinib and nilotinib. Fig. 5a and 5b show the average SRS spectra of different subcellular components in BaF3/BCR-ABL1 cells (n=6) at 1, 2, 4 and 8 hours for imatinib and nilotinib, respectively (supplementary Fig. S6 shows representative SRS images at 1305 cm−1). The lysosome SRS spectra exhibited large cell-to-cell variations, which could be due to different lysosome pH or different cell cycle stages. Fig. 5c and 5d show the calculated apparent concentration of lysosomal drugs as a function of incubation time. Compared to the extracellular drug concentration of 20 μM, both drugs were enriched over 1000-fold in the lysosome within several hours. We note that even at 8 hours, both drug accumulations do not reach steady-state. Effective accumulated drug concentrations keep increasing. Similar phenomena has been observed before for clofazimine, an antibiotic drug that is known to form insoluble aggregates in cells13. The non-steady state behavior deviates from that predicted by De Duve’s theory. In the case of nilotinib, we believe the deviation is due to slow drug precipitation, which increases the size of precipitates and the apparent drug concentration over time; in the case of imatinib, the deviation could be due to formation of other complexes or drug degradation.
Figure 5. Time course of lysosomal drug uptake monitored by hsSRS imaging reveal that both imatinib and nilotinib are enriched over 1000-fold in the lysosome within a few hours, and they do not reach steady-state even after 8 hours; the rate of nilotinib enrichment is higher than that of imatinib.

a, Average SRS spectra of lysosome (blue), cytosol (red) and nucleus (blue) at 1, 2, 4 and 8 hours for imatinib treated BaF3/BCR-ABL1 cells (n=6). Shaded curves show corresponding standard deviation of the spectra of different cells. At 8 hrs, the nuclei of some cells were not visible and therefore the nucleus spectra were not plotted for imatinib treated cells. b, Average SRS spectra of lysosome (blue), cytosol (red) and nucleus (blue) at 1, 2, 4 and 8 hours for nilotinib treated BaF3/BCR-ABL1 cells (n=6). c–d, Lysosomal drug concentration increases with incubation time as calculated from SRS spectra in a and b, respectively. The error bars are standard deviations of calculated drug concentrations of the six cell samples at each time point.
The rate of nilotinib enrichment was much higher than that of imatinib, which is consistent with the presumption that only the neutral form of the drug is permeable through the lysosome membrane. At cytosolic pH, nilotinib has a much larger fraction of molecules in neutral form than imatinib, therefore its rate of diffusion across membrane appears higher. Accompanying the increase of drug accumulation over time, the number and size of lysosomes containing drugs often increased (supplementary Fig. S6). After 8 hours of incubation, some cells already showed signs of apoptosis, such as disappearance of nucleus structure.
Lysosome-mediated chloroquine-TKI drug interaction
Drug distribution within cells is important for drug efficacy. Although many anticancer drug including TKIs are weakly basic and therefore subject to lysosomal trapping, the clinical implications of this effect are often overlooked, due to the lack of quantitative measurements. Lysosomal trapping of drugs may have two important consequences: first, it effectively decreases cytosolic drug concentration; second, it can inhibit autophagy by disrupting autophagosome fusion with lysosomes31. The predominant explanation for the drug sensitization effect of chloroquine and hydroxychloroquine in TKI treatment of CML and several other cancers is that they inhibit autophagy, which plays a key role in the survival of cancer cells (including cancer stem cells). Despite the many different studies of the autophagy-inducing effect of TKI drugs, the assessment of intracellular interactions of drug combinations remains elusive. Here we demonstrate that hsSRS imaging can directly image and quantify TKI drug interactions with chloroquine and the dynamics of drug enrichment in lysosomes.
We incubated BaF3/BCR-ABL1 cells with both 20 μM imatinib and chloroquine at two concentrations of either 20 or 50 μM for 3 hours. hsSRS imaging data show clear contrast changes in the lysosomes with increasing chloroquine concentrations (supplementary Movie S3, Fig. 6a–c). We further quantified the spectral change (Fig. 6d). The spectral peak at 1370 cm−1 corresponding to chloroquine increased in amplitude as chloroquine concentration increased from 0 to 50 μM. Accompanying this change, the intensity of the spectral peak at 1305 cm−1 corresponding to imatinib decreased to almost the same level as that of cytoplasm. The lysosomal concentration of imatinib decreased by roughly 5-fold at 20 μM chloroquine concentration, and by more than 10-fold at 50 μM chloroquine concentration (Fig. 6d). This measurement suggests that imatinib is driven out of the lysosome due to the accumulation of chloroquine. It can be explained by the two drugs’ competition for protons: chloroquine is a stronger base with two protonation sites that have a pKa > 8, while imatinib is a weaker base having only one protonation site that has a pKa > 8. Chloroquine protonation increases the intra-lysosomal pH and reduces imatinib accumulation in lysosomes. If acid-base equilibrium plays the major role here, the intra-lysosomal pH must have increased by at least one unit upon incubation in 50 μM chloroquine solution, which agrees with previous measurement by pH-dependent fluorescence32,33. We conclude that lysosome mediated drug interaction of imatinib and chloroquine can effectively reduce lysosomal trapping of imatinib and increase its cytosolic availability. This offers an alternative explanation of the sensitization effect of chloroquine in imatinib based CML chemotherapy4. Cell-based assays confirmed this finding - chloroquine not only sensitized BaF3/BCR-ABL1 cells from imatinib (supplementary Table S1) but also shifted imatinib’s EC50 in the phospho-Stat5 assay (supplementary Table S2).
Figure 6. Intracellular interaction of TKI drugs with chloroquine measured by hsSRS imaging show that the increase of chloroquine accumulation (SRS peak at 1370 cm−1) in the lysosome significantly reduce imatinib but not nilotinib enrichment in the lysosome (both have SRS peak at 1305 cm−1).
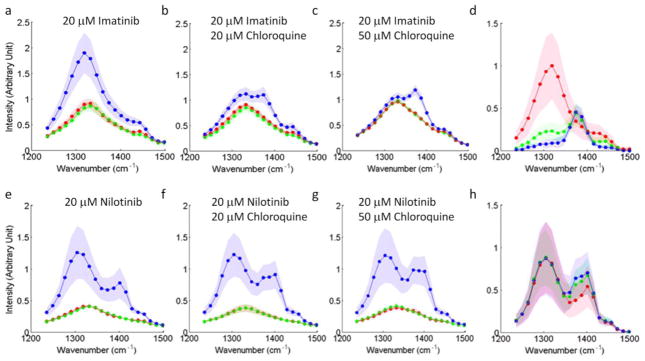
a–c, e–g, SRS spectra of lysosomes, cytosol and nucleus for BaF3/BCR-ABL1 cells treated with different combinations of drugs for 3 hours: 20 μM imatinib (a), 20 μM imatinib + 20 μM chloroquine (b), 20 μM imatinib + 50 μM chloroquine (c), 20 μM nilotinib (e), 20 μM nilotinib + 20 μM chloroquine (f), and 20 μM nilotinib + 50 μM chloroquine (g). d, h, To visualize the drug accumulation induced spectra change, the difference spectra of lysosome and cytosol are plotted: difference spectra of imatinib treated cells at increasing chloroquine concentrations corresponding to a (red), b (green) and c (blue), respectively (d) and difference spectra of nilotinib treated cells at different chloroquine concentrations corresponding to e (red), f (green) and g (blue), respectively (h). Shaded curves show corresponding standard deviation of measurement on six different cells.
Surprisingly, when BaF3/BCR-ABL1 cells were treated with 20 μM nilotinib and either 20 or 50 μM chloroquine simultaneously for 3 hours, we did not observe any significant reduction of nilotinib accumulation, even though chloroquine concentration still increases in lysosomes (Fig. 6e–h). Considering that chloroquine can increase the pH by about one unit to pH = 5–6, the theoretical enrichment of nilotinib would be less than 10-fold based on acid-base equilibrium considerations. This small enrichment factor cannot explain the high accumulation ratio observed. We suspect that the faster dynamics of nilotinib precipitation inside the lysosome is responsible for this phenomenon. Nilotinib diffuses into lysosomes faster than chloroquine and forms precipitates before the pH is elevated by chloroquine accumulation. This phenomenon would change with lower nilotinib concentration. However, directly observing such effects would require at least ten times higher SRS detection sensitivity than currently achievable.
CONCLUSIONS
In summary, hsSRS combines the high specificity of Raman spectroscopy with the high sensitivity provided by SRS microscopy, which allows for unprecedented capability in label-free imaging of drug-cell interaction at subcellular resolution. Most TKI drugs have lysosomotropic properties, rendering them amenable to lysosomal trapping. At 20 μM concentration, both imatinib and nilotinib are enriched by more than 1000-fold in lysosomes, which can be explained by De Duve’s theory modified with the addition of solubility equilibrium. This large enrichment reduces the availability of cytosolic drug and thus decreases drug efficacy. In CML patients treated with these two drugs, mean blood plasma trough concentrations of imatinib and nilotinib are 4 μM and 2μM34,35, respectively. They are 5–10 times lower than the concentration used in this experiment. Nevertheless, we have shown that even at 4 μM drug concentration, we were able to observe drug enrichment in lysosome using hsSRS imaging. More importantly, for imatinib, which does not precipitate after enrichment, the enrichment factor is independent on drug concentration. Thus the lysosomal trapping of imatinib will reduce its efficacy in CML patients. The effect would be even more severe for drugs that have large enrichment (high pKa) and low water solubility.
We have further shown that hsSRS imaging can directly monitor the interaction of imatinib with chloroquine. We determined that 50 μM of chloroquine can increase the pH of lysosome by at least one unit, which results in a 10-fold decrease of lysosomal imatinib enrichment. We believe this lysosome-mediated drug interaction is at least partly responsible for the sensitizing effect of chloroquine for imatinib-treated CML patients. Because lysosomotropism is such a universal mechanism based mostly on the acid-base equilibrium partition of weakly basic molecules on the two sides of the lysosomal membrane, the synergistic effect must also be applicable to other weakly basic drugs and cancer cells as well. However, the lysosome-mediated interaction would be strongest for drugs that have pKa > 6. For drugs that have lower pKa such as nilotinib, such interaction is expected to be weaker. Another caveat is that the dynamics of drug uptake may also play an important role. Faster uptake of nilotinib and the precipitation that follows can significantly lower the impact of chloroquine accumulation induced lysosomal pH increase.
We believe that this is the first time that intracellular TKI drugs are visualized and quantified at submicron resolution; we also demonstrate the first quantitative measurement of drug-drug interaction with label-free imaging. Further improvement in SRS sensitivity will enable this technique to be broadly applicable to the study of many different drugs in living cells. This could potentially be achieved with higher power lasers in combination with longer wavelength to reduce photodamage. We have shown hsSRS imaging in the fingerprint region, especially focused on C=C stretching and aromatic ring breathing. It is worth noting that it is also possible to design deuterated drugs or alkyne tagged drugs for which the physical and chemical properties are largely intact, but their Raman signals are shifted into a low background region36, enabling easier and more sensitive SRS detection.
METHODS
Materials
Imatinib and nilotinib were obtained from Novartis. Chloroquine, GNF-2, and GNF-5 were purchased from Sigma-Aldrich. 3-Methyladenine was purchased from R&D systems. Lysotracker Red was purchased from Lonza. Interleukine-3 was purchased from Calbiochem.
Cell culture
The murine bone marrow-derived cell line BaF3 was used to generate the appropriate cell line models. BaF3 cells were obtained from the German Collection of Microorganisms and Cell Cultures (DSMZ, Braunschweig and DSMZ No. ACC 300). Parental BaF3 cells depend on interleukine-3 (IL-3) for growth and survival and were used as the reference cell line that does not depend on BCR-ABL1 activity for growth and survival37. These cells are referred to as BaF3/wt. To generate BaF3 cells that depend on BCR-ABL1 expression for growth and survival, BaF3 cells were engineered to express BCR-ABL1 using retroviral transduction with a MSCV based retroviral vector containing a p210 BCR-ABL1 expression cassette. When grown in the absence of IL-3, the proliferation of the cells is dependent on the expression of BCR-ABL138. These cells are referred to as BaF3/BCR-ABL1. BaF3/BCR-ABL1 cells were cultured in RPMI 1640 medium supplemented with 10% FBS and 1% Pen/Strep. BaF3/wt cells were cultured in RPMI 1640 medium supplemented with 10% FBS, 1% Pen/Strep and 5ng/ml mouse IL-3. Both cells were grown in suspension at 37°C with 5% CO2 and were passaged every other day with a 1:5 split ratio.
Hyperspectral SRS imaging
The experimental setup we used for fingerprint hsSRS imaging was published previously24 (supplementary Fig. S1). In brief, two synchronized femtosecond lasers were chirped to about 2 ps using SF57 glass rods. One laser was fixed at 1040 nm wavelength and the other was tunable from 750 nm to 970 nm. We chose the center wavelength of the tunable laser to be at 914 nm and 890 nm for hsSRS imaging in the 1300 cm−1 region and 1600 cm−1 region, respectively. The wavenumbers were calibrated with oleic acid spectral peaks using linear fitting. Spectral resolution is about 20–30 cm−1. The temporal delay between the two pulsed lasers was controlled by a motorized stage (Newport MFA-PP). A 60X water immersion objective (Olympus UPLSAPO60X, NA = 1.2) was used to focus the lasers onto the sample, with typical optical power at the sample of 40 mW for the pump beam and 40 mW for the Stokes beam. Each SRS image has 512 × 512 pixels and takes 1.65 sec to acquire.
hsSRS imaging of drug treated cells
Imatinib, nilotinib, GNF-2 and GNF-5 were dissolved in deuterated DMSO at 10 mM stock concentration. For drug treatment studies, different amounts of drug stock solution were added to freshly passaged cell suspensions and were grown in the incubator for a few hours. Even though some drugs (especially nilotinib) have poor solubility in water, they all have excellent solubility in DMSO (> 50 mM). We did not observe any precipitation of the drugs in the culture medium at all conditions. Before imaging, 20 μL of cell suspension were deposited onto a coverslip with a pipette. A coverslide was immediately applied on top to form a single layer of cells, which were then sealed with nail polish. Cells were immediately imaged at room temperature within 20 minutes.
To obtain lysosomal drug SRS spectra, ROIs of lysosomes were first selected based on their SRS intensity at 1305 cm−1. Typical size of a ROI can range from 0.5μm–3μm. Paired background SRS spectra were obtained from cytoplasmic ROI regions that do not contain any bright lysosomal drug inclusions. To calculate lysosomal drug concentration, the background SRS spectra were subtracted from the lysosomal spectra. The peak intensities of the resulting spectra were used to calculate the concentration of drugs by comparing them to peak SRS intensities of pure drug solutions at 100 mM.
Two-photon fluorescence imaging of Lysotracker Red
The same lasers used for SRS imaging can excite Lysotracker fluorescence based on two-photon excitation. We used a bandpass filter (605 nm/55 nm) to select the two-photon fluorescence of Lysotracker Red and detected it with a PMT amplifier (Hamamatsu). The epi-fluorescence signal from PMT and SRS signal from the photodiode were detected simultaneously during the beam scanning.
Supplementary Material
Figure S1: Schematic diagram of hyperspectral SRS imaging setup. SF57 is the glass rod for pulse stretching. EOM: electro-optical modulator; QWP: quarter wave plate; PBS: polarizing beam splitter. Two lasers with pulses stretched to ~2ps were combined on a dichroic mirror and sent into a laser scanning microscope for hsSRS imaging.
Figure S2: Calibration curve of SRS peak intensity over drug concentration. a, SRS intensity of Imatinib at 1310 cm−1 plotted over imatinib concentration (dissolved in deuterated DMSO). b, SRS intensity of Imatinib at 1305 cm−1 plotted over nilotinib concentration (dissolved in deuterated DMSO). A sensitivity limit of 2 mM can be achieved for both drugs.
Figure S3: Comparison of imatinib and nilotinib uptake in BaF3 cells transfect with BCR-ABL1 fusion protein with that of wild-type BaF3 cells. a–d, SRS imaging at 1305 cm−1 of BaF3/wt cells treated with 20 μM imatinib for 2 hours (a), BaF3/wt cells treated with 20 μM nilotinib for 2 hours (b), BaF3/BCR-ABL1 cells treated with 20 μM imatinib for 2 hours (c), and BaF3/BCR-ABL1 cells treated with 20 μM nilotinib for 2 hours (d). e, Box plots of SRS intensities of lysosomes for a–d (n= 15 for each sample).
Figure S4: Lysosomotropic effect of chloroquine visualized by hyperspectral SRS imaging. a, representative maximum intensity projection of 20 SRS images from 1236 cm−1 to 1497 cm−1 of 50 μM chloroquine treated BaF3/BCR-ABL1 cells for 2 hours. b, Average SRS spectra of lysosome (blue curve), cytosol (red curve) and nucleus (green curve) for six cells. Shaded curve show standard deviation. c, Calculated average concentration of lysosomal chloroquine of the six cells. Error bar shows standard deviation.
Figure S5: Intralysosomal drug uptake at different incubation concentrations and the effect of autophagy inhibition. a–b, Comparing accumulated drug SRS spectra (lysosome SRS spectra subtracted by cytosol SRS spectra) of BaF3/BCR-ABL1 cell treated with two different concentrations of imatinib (a) and different concentrations of nilotinib (b) for 2 hours. c–d, Comparing lysosome SRS intensity at 1305 cm−1 of 20 μM imatinib (c) or 20 μM nilotinib (d) treated BaF3/BCR-ABL1 cells to that of 20 μM imatinib+5 mM 3MA or 20 μM nilotinib+ 5mM 3MA treated BAF3/BCR-ABL1 cells.
Figure S6: Representative SRS images of drug treated BaF3/BCR-ABL1 cells at different incubation times. a, 20 μM imatinib incubated for 1 hr, 2 hrs, 4 hrs and 8 hrs. b, 20 μM nilotinib incubated for 1 hr, 2 hrs, 4 hrs and 8 hrs.
Acknowledgments
We thank Steve Martin, John Hastewell, Minbiao Ji, Fa-ke Lu, Christian Freudiger and Wenlong Yang for helpful discussions. We also thank Serge Moss for his help with Raman peak assignments. This work was supported by the National Institute of Health’s T-R01 (1R01EB010244-01) awarded to X. Sunney Xie.
Footnotes
Supplementary information and chemical compound information are available in the online version of the paper.
Reprints and permissions information is available online at www.nature.com/reprints.
Author contributions
D.F. and J.Z. contributed equally to the study. D.F., J.Z., Y.K.W. and S.X.X conceived the study. D.F. and J.Z. designed the study. D.F., J.Z., Y.K.W., S.X.X, and P.M participated extensively in the scientific discussion about the study. D.F. performed hsSRS imaging study and analyzed imaging data. S.W.Z. performed the cell proliferation and phospho-STAT5 assay, with supervision from A.W. J.Z., S.W.Z., A.W. and T.H. prepared the drug and cell samples. D.F., J.Z., P.M. and S.X.X wrote the manuscript with contributions from S.W.Z, A.W. and T.H.
References
- 1.Melo JV, Barnes DJ. Chronic myeloid leukaemia as a model of disease evolution in human cancer. Nat Rev Cancer. 2007;7:441–453. doi: 10.1038/nrc2147. [DOI] [PubMed] [Google Scholar]
- 2.Manley PW, et al. Structural resemblances and comparisons of the relative pharmacological properties of imatinib and nilotinib. Biorg Med Chem. 2010;18:6977–6986. doi: 10.1016/j.bmc.2010.08.026. [DOI] [PubMed] [Google Scholar]
- 3.Adrian FJ, et al. Allosteric inhibitors of Bcr-abl-dependent cell proliferation. Nat Chem Biol. 2006;2:95–102. doi: 10.1038/nchembio760. [DOI] [PubMed] [Google Scholar]
- 4.Bellodi C, et al. Targeting autophagy potentiates tyrosine kinase inhibitor-induced cell death in Philadelphia chromosome-positive cells, including primary CML stem cells. J Clin Invest. 2009;119:1109–1123. doi: 10.1172/JCI35660. [DOI] [PMC free article] [PubMed] [Google Scholar]
- 5.Gupta A, et al. Autophagy inhibition and antimalarials promote cell death in gastrointestinal stromal tumor (GIST) Proc Natl Acad Sci. 2010;107:14333–14338. doi: 10.1073/pnas.1000248107. [DOI] [PMC free article] [PubMed] [Google Scholar]
- 6.Lee CM, Tannock IF. Inhibition of endosomal sequestration of basic anticancer drugs: influence on cytotoxicity and tissue penetration. Br J Cancer. 2006;94:863–869. doi: 10.1038/sj.bjc.6603010. [DOI] [PMC free article] [PubMed] [Google Scholar]
- 7.Rubinsztein DC, Codogno P, Levine B. Autophagy modulation as a potential therapeutic target for diverse diseases. Nat Rev Drug Discov. 2012;11:709–730. doi: 10.1038/nrd3802. [DOI] [PMC free article] [PubMed] [Google Scholar]
- 8.Verschooten L, et al. Autophagy Inhibitor Chloroquine Enhanced the Cell Death Inducing Effect of the Flavonoid Luteolin in Metastatic Squamous Cell Carcinoma Cells. Plos One. 2012;7:e48264. doi: 10.1371/journal.pone.0048264. [DOI] [PMC free article] [PubMed] [Google Scholar]
- 9.Lamoureux F, et al. Blocked Autophagy Using Lysosomotropic Agents Sensitizes Resistant Prostate Tumor Cells to the Novel Akt Inhibitor, AZD5363. Clin Cancer Res. 2013;19:833. doi: 10.1158/1078-0432.CCR-12-3114. [DOI] [PubMed] [Google Scholar]
- 10.Zinn R, et al. Combination treatment with ABT-737 and chloroquine in preclinical models of small cell lung cancer. Mol Cancer. 2013;12:16. doi: 10.1186/1476-4598-12-16. [DOI] [PMC free article] [PubMed] [Google Scholar]
- 11.Maycotte P, et al. Chloroquine sensitizes breast cancer cells to chemotherapy independent of autophagy. Autophagy. 2012;8:200–212. doi: 10.4161/auto.8.2.18554. [DOI] [PMC free article] [PubMed] [Google Scholar]
- 12.Satori CP, et al. Bioanalysis of Eukaryotic Organelles. Chem Rev. 2013;113:2733–2811. doi: 10.1021/cr300354g. [DOI] [PMC free article] [PubMed] [Google Scholar]
- 13.Baik J, Rosania GR. Molecular Imaging of Intracellular Drug–Membrane Aggregate Formation. Mol Pharm. 2011;8:1742–1749. doi: 10.1021/mp200101b. [DOI] [PMC free article] [PubMed] [Google Scholar]
- 14.Ling J, Weitman SD, Miller MA, Moore RV, Bovik AC. Direct Raman Imaging Techniques for Study of the Subcellular Distribution of a Drug. Appl Opt. 2002;41:6006–6017. doi: 10.1364/ao.41.006006. [DOI] [PubMed] [Google Scholar]
- 15.Salehi H, et al. Label-free detection of anticancer drug paclitaxel in living cells by confocal Raman microscopy. Appl Phys Lett. 2013;102:113701. [Google Scholar]
- 16.Matthäus C, et al. In: Confocal Raman Microscopy Vol. 158 Springer Series in Optical Sciences. Dieing Thomas, Hollricher Olaf, Toporski Jan., editors. Ch 7. Springer; Berlin Heidelberg: 2011. pp. 137–163. [Google Scholar]
- 17.Harada Y, et al. Intracellular dynamics of topoisomerase I inhibitor, CPT-11, by slit-scanning confocal Raman microscopy. Histochem Cell Biol. 2009;132:39–46. doi: 10.1007/s00418-009-0594-0. [DOI] [PubMed] [Google Scholar]
- 18.Freudiger CW, et al. Label-Free Biomedical Imaging with High Sensitivity by Stimulated Raman Scattering Microscopy. Science. 2008;322:1857–1861. doi: 10.1126/science.1165758. [DOI] [PMC free article] [PubMed] [Google Scholar]
- 19.Wang MC, Min W, Freudiger CW, Ruvkun G, Xie XS. RNAi screening for fat regulatory genes with SRS microscopy. Nat Methods. 2011;8:135–138. doi: 10.1038/nmeth.1556. [DOI] [PMC free article] [PubMed] [Google Scholar]
- 20.Freudiger CW, et al. Multicolored stain-free histopathology with coherent Raman imaging. Lab Invest. 2012 doi: 10.1038/labinvest.2012.109. [DOI] [PMC free article] [PubMed] [Google Scholar]
- 21.Zhang X, et al. Label-Free Live-Cell Imaging of Nucleic Acids Using Stimulated Raman Scattering Microscopy. Chemphyschem. 2012;13:1054–1059. doi: 10.1002/cphc.201100890. [DOI] [PMC free article] [PubMed] [Google Scholar]
- 22.Fu D, et al. Quantitative Chemical Imaging with Multiplex Stimulated Raman Scattering Microscopy. J Am Chem Soc. 2012;134:3623–3626. doi: 10.1021/ja210081h. [DOI] [PMC free article] [PubMed] [Google Scholar]
- 23.Ozeki Y, et al. High-speed molecular spectral imaging of tissue with stimulated Raman scattering. Nat Photonics. 2012;6:845–851. [Google Scholar]
- 24.Fu D, Holtom G, Freudiger C, Zhang X, Xie XS. Hyperspectral Imaging with Stimulated Raman Scattering by Chirped Femtosecond Lasers. J Phys Chem B. 2013;117:4634–4640. doi: 10.1021/jp308938t. [DOI] [PMC free article] [PubMed] [Google Scholar]
- 25.Zhang D, et al. Quantitative Vibrational Imaging by Hyperspectral Stimulated Raman Scattering Microscopy and Multivariate Curve Resolution Analysis. Anal Chem. 2013;85:98–106. doi: 10.1021/ac3019119. [DOI] [PMC free article] [PubMed] [Google Scholar]
- 26.Colthup NB, Daly LH, Wiberley SE. Introduction to Infrared and Raman Spectroscopy. Academic Press; 1990. [Google Scholar]
- 27.Cîntǎ-Pînzaru S, et al. FT-Raman and NIR-SERS characterization of the antimalarial drugs chloroquine and mefloquine and their interaction with hematin. J Raman Spectrosc. 2006;37:326–334. [Google Scholar]
- 28.De Duve C, et al. Lysosomotropic agents. Biochem Pharmacol. 1974;23:2495–2531. doi: 10.1016/0006-2952(74)90174-9. [DOI] [PubMed] [Google Scholar]
- 29.Trapp S, Rosania GR, Horobin RW, Kornhuber J. Quantitative modeling of selective lysosomal targeting for drug design. Eur Biophys J. 2008;37:1317–1328. doi: 10.1007/s00249-008-0338-4. [DOI] [PMC free article] [PubMed] [Google Scholar]
- 30.Codogno P, Meijer AJ. Autophagy and signaling: their role in cell survival and cell death. Cell Death Differ. 2005;12:1509–1518. doi: 10.1038/sj.cdd.4401751. [DOI] [PubMed] [Google Scholar]
- 31.Kimura T, Takabatake Y, Takahashi A, Isaka Y. Chloroquine in Cancer Therapy: A Double-Edged Sword of Autophagy. Cancer Res. 2013;73:3–7. doi: 10.1158/0008-5472.CAN-12-2464. [DOI] [PubMed] [Google Scholar]
- 32.Poole B, Ohkuma S. Effect of weak bases on the intralysosomal pH in mouse peritoneal macrophages. J Cell Biol. 1981;90:665–669. doi: 10.1083/jcb.90.3.665. [DOI] [PMC free article] [PubMed] [Google Scholar]
- 33.Zheng N, Zhang X, Rosania GR. Effect of Phospholipidosis on the Cellular Pharmacokinetics of Chloroquine. J Pharmacol Exp Ther. 2011;336:661–671. doi: 10.1124/jpet.110.175679. [DOI] [PMC free article] [PubMed] [Google Scholar]
- 34.Larson RA, et al. Imatinib pharmacokinetics and its correlation with response and safety in chronic-phase chronic myeloid leukemia: a subanalysis of the IRIS study. Blood. 2008;111:4022–4028. doi: 10.1182/blood-2007-10-116475. [DOI] [PubMed] [Google Scholar]
- 35.Deininger MW. Nilotinib. Clin Cancer Res. 2008;14:4027–4031. doi: 10.1158/1078-0432.CCR-07-5015. [DOI] [PubMed] [Google Scholar]
- 36.Yamakoshi H, et al. Alkyne-Tag Raman Imaging for Visualization of Mobile Small Molecules in Live Cells. J Am Chem Soc. 2012;134:20681–20689. doi: 10.1021/ja308529n. [DOI] [PubMed] [Google Scholar]
- 37.Palacios R, Steinmetz M. IL3-dependent mouse clones that express B-220 surface antigen, contain ig genes in germ-line configuration, and generate B lymphocytes in vivo. Cell. 1985;41:727–734. doi: 10.1016/s0092-8674(85)80053-2. [DOI] [PubMed] [Google Scholar]
- 38.Daley GQ, Baltimore D. Transformation of an interleukin 3-dependent hematopoietic cell line by the chronic myelogenous leukemia-specific P210bcr/abl protein. Proc Natl Acad Sci. 1988;85:9312–9316. doi: 10.1073/pnas.85.23.9312. [DOI] [PMC free article] [PubMed] [Google Scholar]
Associated Data
This section collects any data citations, data availability statements, or supplementary materials included in this article.
Supplementary Materials
Figure S1: Schematic diagram of hyperspectral SRS imaging setup. SF57 is the glass rod for pulse stretching. EOM: electro-optical modulator; QWP: quarter wave plate; PBS: polarizing beam splitter. Two lasers with pulses stretched to ~2ps were combined on a dichroic mirror and sent into a laser scanning microscope for hsSRS imaging.
Figure S2: Calibration curve of SRS peak intensity over drug concentration. a, SRS intensity of Imatinib at 1310 cm−1 plotted over imatinib concentration (dissolved in deuterated DMSO). b, SRS intensity of Imatinib at 1305 cm−1 plotted over nilotinib concentration (dissolved in deuterated DMSO). A sensitivity limit of 2 mM can be achieved for both drugs.
Figure S3: Comparison of imatinib and nilotinib uptake in BaF3 cells transfect with BCR-ABL1 fusion protein with that of wild-type BaF3 cells. a–d, SRS imaging at 1305 cm−1 of BaF3/wt cells treated with 20 μM imatinib for 2 hours (a), BaF3/wt cells treated with 20 μM nilotinib for 2 hours (b), BaF3/BCR-ABL1 cells treated with 20 μM imatinib for 2 hours (c), and BaF3/BCR-ABL1 cells treated with 20 μM nilotinib for 2 hours (d). e, Box plots of SRS intensities of lysosomes for a–d (n= 15 for each sample).
Figure S4: Lysosomotropic effect of chloroquine visualized by hyperspectral SRS imaging. a, representative maximum intensity projection of 20 SRS images from 1236 cm−1 to 1497 cm−1 of 50 μM chloroquine treated BaF3/BCR-ABL1 cells for 2 hours. b, Average SRS spectra of lysosome (blue curve), cytosol (red curve) and nucleus (green curve) for six cells. Shaded curve show standard deviation. c, Calculated average concentration of lysosomal chloroquine of the six cells. Error bar shows standard deviation.
Figure S5: Intralysosomal drug uptake at different incubation concentrations and the effect of autophagy inhibition. a–b, Comparing accumulated drug SRS spectra (lysosome SRS spectra subtracted by cytosol SRS spectra) of BaF3/BCR-ABL1 cell treated with two different concentrations of imatinib (a) and different concentrations of nilotinib (b) for 2 hours. c–d, Comparing lysosome SRS intensity at 1305 cm−1 of 20 μM imatinib (c) or 20 μM nilotinib (d) treated BaF3/BCR-ABL1 cells to that of 20 μM imatinib+5 mM 3MA or 20 μM nilotinib+ 5mM 3MA treated BAF3/BCR-ABL1 cells.
Figure S6: Representative SRS images of drug treated BaF3/BCR-ABL1 cells at different incubation times. a, 20 μM imatinib incubated for 1 hr, 2 hrs, 4 hrs and 8 hrs. b, 20 μM nilotinib incubated for 1 hr, 2 hrs, 4 hrs and 8 hrs.