

Abstract
Purified long-term multilineage repopulating marrow stem cells have been considered to be homogenous, but functionally these cells are heterogeneous. Many investigators urge clonal studies to define stem cells but, if stem cells are truly heterogeneous, clonal studies can only define heterogeneity. We have determined the colony growth and differentiation of individual lineage negative, rhodamine low, Hoechst low (LRH) stem cells at various times in cytokine culture, corresponding to specific cell cycle stages. These highly purified and cycle synchronized (98% in S phase at 40 h of culture) stem cells were exposed to two cytokine cocktails for 0, 18, 32, or 40 h and clonal differentiation assessed 14 days later. Total heterogeneity as to gross colony morphology and differentiation stage was demonstrated. This heterogeneity showed patterns of differentiation at different cycle times. These data hearken to previous suggestions that stem cells might be similar to radioactive isotopes; decay rate of a population of radioisotopes being highly predictable, while the decay of individual nuclei is heterogeneous and unpredictable (Till et al., 1964). Marrow stem cells may be most adequately defined on a population basis; stem cells existing in a continuum of reversible change rather than a hierarchy.
A dichotomy exists as to the phenotype of marrow stem cells. Data from the classic work of Till and McCulloch (1961) on colony-forming unit spleen have indicated a stochastic mode of regulation with a heterogeneous population of stem cells. In contrast, many investigators have put forward single cell clonal engraftment as the gold standard for defining a hematopoietic stem cell. This latter, of course, implies homogeneity of the stem cell population. In studies on CFU-S, the first valid clonal stem/progenitor cell assay, Till et al. (1964) compared these cells to radioactive nuclei. The decay rate of a population of radioisotopes is highly predictable and can be accurately determined, however, the decay of individual nuclei is totally heterogeneous and unpredictable.
The CFU-S population is heterogeneous, containing cells with varying degrees of engraftment and renewal potential, but even when highly purified cells, separated by expression of surface epitopes and characterized by long-term in vivo repopulation in lethally irradiated mice, were evaluated, heterogeneity was described. One aspect of heterogeneity of these cells is cell cycle status, since most have a percentage in S phase. For instance, Fleming et al. (1993) showed that 18–22% of Lin− c-kit+Sca-1+ thy-1lo (LT-HSC) were in S-phase, although in latter studies utilizing pyronin/Hoechst staining of LT-HSC. Passegue et al. (2005) indicated that all LT-HSC were in G0. Studies by Necas and Znojil (1987) on colony-forming unit spleen (CFU-S), the original stem cell assay, on large numbers of individual mice over time, showed large variations in both quantitative numbers per femur and in the proliferative rate as measured by tritiated thymidine suicide. The percent CFU-S in S-phase ranged from 0% to 60%. These investigators, based on this work and work on the response of CFU-S to low-dose irradiation in vivo (Necas and Znojil, 1988), suggested that proliferation of CFU-S in vivo may occur in discrete waves. Thus, even in highly characterized or purified stem cells, the percent in cell cycle appears to be highly heterogeneous.
Perhaps one of the most highly purified and best characterized murine marrow stem cells is the lineage negative, Hoechst low, rhodamine low (LRH) cell (Bertoncello et al., 1991). One in 3–4 of these cells have repopulation potential and up to 90% will form high-proliferative potential (HPP) colonies in the presence of 6–7 cytokines. These cells are separated on the basis of quiescence, thus giving a highly synchronized population that is in G0/earlyG1 and that progress through cell cycle in a highly synchronized fashion when stimulated by cytokines (Reddy et al., 1997). We have used this population to characterize the heterogeneity of purified marrow stem cells in early G0/G1 (at isolation) and at different points in synchronized cell cycle progression under cytokine stimulation.
Many stem cell characteristics show reversible changes with cell cycle passage (Habibian et al., 1998; Becker et al., 1999; Berrios et al., 2001; Cerny et al., 2002; Reddy et al., 2002; Lambert et al., 2003). Work by three different groups, employing continuous oral administration of BrdU to mice, has indicated that stem cells are a cycling population (Bradford et al., 1997; Cheshier et al., 1999; Pang et al., 2003). In addition, studies on lineage negative c-kit+Sca-1+Thylo and on Lin− Sca-1+ marrow stem cells indicates that approximately 20% of these cells are in S phase at isolation (Fleming et al., 1993). These latter observations, representing a window on the cycle characteristics of a stem cell, also indicate that the marrow stem cell is cycling. Subsets of these primitive stem cells as defined by pyronin staining, presumably in G0, have been reported to represent most long-term repopulating cells, although this remains to be confirmed (Osawa et al., 1996; Zhong et al., 1996).
Evaluation of long-term engraftment, global gene expression, and differentiation in response to cytokines at different points in a cytokine stimulated cell cycle transit indicates that stem cells show reversible changes in phenotype (Habibian et al., 1998; Lambert et al., 2003; Colvin et al., 2004). These observations have formed the basis for a continuum model of hematopoiesis, in which the phenotype of the hematopoietic stem cell continuously changes on a cell cycle related continuum (Quesenberry et al., 2002, 2005; Quesenberry, 2006). This model is similar to the “stochastic” model of Roeder et al. (2005). These models suggest that any purified marrow stem cell population would be heterogenous, based on differences connected with cell cycle phase and environmental exposures. The original work of Till et al. (1964) showed that the self-renewal capacity of CFU-S was very heterogeneous and that the heterogeneity varied over time. As noted above, they compared the CFU-S to radioisotopes in which the decay of radioactivity for the whole population was highly predictable, but was very heterogeneous and unpredictable for individual nuclei (see above). More recently, both in vivo and in vitro studies have shown extensive heterogeneity for the phenotype of the marrow stem cell (Jordan and Lemischka, 1991; Smith et al., 1991; Keller, 1992; Abkowitz et al., 2000; Guenechea et al., 2001; Muller-Sieburg et al., 2002; Uchida et al., 2003; Roeder et al., 2005).
An unanswered question is whether the marrow stem cell would be homogeneous in a specific cell cycle phase. Perhaps one of the most highly purified and best characterized murine marrow stem cells is the doubly effluxed LRH cell (Reddy et al., 2002) separated on the basis of quiescence (Bertoncello et al., 1991; Wolf et al., 1993; Colvin et al., 2007). As noted above, one in 3–4 of these cells has repopulation potential and up to 90% will form HPP colonies in the presence of 6–7 cytokines. This is equivalent in purity to any other described stem cell population. LRH cells are a population isolated in G0/earlyG1 and that progress through cell cycle in a highly synchronized fashion when stimulated by cytokines (Reddy et al., 1997). These cells maintain their synchrony out to six population doublings (Reddy et al., 1997). The cell cycle status of these cells has been analyzed at isolation and during cytokine induced cell cycle transit by thymidine suicide, propidium labeling, and population doublings. When these cells are cultured in thrombopoietin (TPO), FLT3L, and steel factor for 40 h, 98% were found to be in S phase (Colvin et al., 2007). These LRH cells provide an opportunity for analyzing heterogeneity at specific points in cell cycle. In the present study, we have cultured these cells in TPO, FLT3L, and steel factor, and then at isolation or at different points in cell cycle progression subcultured them on a single cell basis in the presence of two cytokine cocktails: granulocyte–macrophage colony-stimulating factor (GM-CSF), granulocyte colony-stimulating factor (G-CSF), and steel factor or GM-CSF, G-CSF, steel factor, TPO, and FLT3L. We then analyzed colony number, gross colony morphology and determined the differentiated lineages within each colony. These data show heterogeneity at isolation and also at specific points in cell cycle, but with different patterns of differentiation at different points in cycle. This work supports the continuum model of hematopoiesis.
Experimental Procedures
Mice
Six- to 8-week-old congenic male B6.SJL-PtprcaPep3b/Boy.J (B6.SJL) were purchased from Jackson Lab (Bar Harbor, ME) and housed in a conventional clean facility for at least a week before experimental use, certified to be specific pathogen free, and given ad libitum access to autoclaved mouse chow and acidified water. The animals were maintained in accordance with guidelines, and all experiments approved by the hospitals Institutional Animal Care and Use Committee.
Hematopoietic stem cell purification
Isolation of lineage negative, rhodamine-123lowHoechst-33342low (LRH) purified stem cells was obtained using bone marrow isolated from the iliacs, femurs, and tibiae of B6.SJL mice 6–8 weeks of age. A low-density fraction (<1.077 g/cm2) was isolated on Nycoprep 1.077A (Accurate Chemical and Scientific Corporation, Westbury, NY). The cells were lineage depleted with the following primary rat antibodies: anti-B220, anti-MAC-1, anti-GR1, anti-Lyt-2, anti-L3T4, and Ter119 (BD PharMingen, San Diego, CA). Each batch of antibody was evaluated by flow cytometry analysis for the concentration, which resulted in the greatest shift in mean channel fluorescence and/or the greatest percentage of positive cells detected. The optimal dilution for each antibody was in the range of 1:10–1:900 (final). After a 15-min incubation on ice, the labeled cells were washed in PBS 5% HI FCS and resuspended at 108 cells/ml in PBS buffer. The cells were incubated with washed sheep anti-rat IgG conjugated immunomagnetic polystyrene spheres (M-450 Dynabeads; Dynal, Lake Success, NY) at 4°C for 20 min by adding beads in a drop-like fashion to obtain a 1:5 bead to cell ratio. The beads were suspended in PBS buffer and, when added to the cells, resulted in 1.5 times the original cell volume. After the 20 min incubation, immunomagnetic, bead-rosetted cells were removed using a magnetic particle concentrator (Dynal, MPC-6), and the unrosetted cells remaining in suspension were harvested by pipette. The lineage depleted cells were labeled with Rhodamine-123 at a concentration of 0.1 mg/ml and Hoechst-33342 at 10 mM. Cells were incubated in the dark for 30 min at 37°C, washed and followed by an additional incubation for 20 min at 37°C, allowing time for efflux of rhodamine. The last incubation was carried out twice before sorting. A population with both low expression of Hoechst and rhodamine fluorescence was isolated by FACS using a high-speed multi-laser MoFlo® cell sorter (Cytomation, Fort Collins, Colorado).
Cell cycle induction culture
The purified stem cells were cultured at a density of 1,000 ± cells/ml in a base media of Dulbecco’s Modified Essential Medium low-glucose (Life Technologies, Carlsbad, CA, Gibco/BRL, Carlsbad, CA) containing 15% heat-inactivated fetal calf serum (HyClone Laboratories, Logan, UT), 1% penicillin (100 U/ml), 1% streptomycin (100 μg/ml), and 1% L-glutamine (100 μg/ml). The cytokine cocktail utilized combined recombinant murine (rm) FLT3L 100 ng/ml (R&D Systems, Minneapolis, MN), rm TPO 200 ng/ml (R&D), and rm steel factor 50 ng/ml (R&D). The bone marrow was cultured with the above cytokines for various times in non-adherent teflon bottles in a humidified 5% CO2, 37°C water-jacketed incubator (Forma Scientific, Inc., Marietta, OH).
Single cell (clonal) culture technique
A minimum of 200 purified marrow stem cells were placed in 5 ml Falcon polystyrene tube (BD PharMingen) in at least 200 μl of PBS buffer supplemented with blue FlouroSpheres® beads (Molecular Probes, Eugene, Oregon) (647 nm excitation, 730 nm emission) at a concentration of 500,000 beads per analysis (Fig. 1). The beads were first washed 2× with PBS to eliminate sodium azide. The beads were used to minimize “waste” of the limited purified stem cell population. A high-speed multi-laser MoFlo® cell sorter (Cytomation) was used to place a single cell in each inner well of a U-bottom 96-well plate (BD PharMingen). The fluorescent blue beads are diverted to waste. The outside well of the 96-well plates were first filled with distilled water to maintain humidity of the culture. The inner 60 wells are filled with 250 μl of media containing Dulbecco’s Modified Essential Medium low glucose (Life Technologies, Gibco/BRL) with 15% heat-inactivated fetal calf serum (HyClone Laboratories), 1% penicillin (100 U/ml), 1% streptomycin (100 μg/ml), and 1% L-glutamine (100 μg/ml). The differentiation cytokine cocktails tested were as follows: The granulocyte colony-stimulating factor (G-CSF), granulocyte-macrophage CSF (GM-CSF), and steel combinations kept steel at 50 ng/ml, and at level B GM-CSF was 0.375 and G-CSF 0.75 ng/ml, at level C GM-CSF was 0.0375 ng/ml and G-CSF 0.075 ng/ml, and at level D GM-CSF was 0.00375 ng/ml and G-CSF 0.0075 ng/ml. The TPO, FLT3L, GM-CSF, G-CSF, and steel combinations also kept steel factor at 50 ng/ml, while at level B GM-CSF was 0.375 ng/ml, G-CSF 0.75 ng/ml, FLT3L was 10 ng/ml, and TPO 20 ng/ml. Levels C and D represented sequential log reductions in concentrations of each cytokine except steel factor. The plates are placed in a humidified 5% CO2, 37°C water-jacketed incubator (Forma Scientific, Inc.) for 2 weeks time. The experimental set-up is shown in Figure 1.
Fig. 1.

Experimental design. LRH marrow cells are separated by fluorescent activated cell sorting (FACS), cultured in primary cytokines for 0–40 h, then deposited as single cells into microtiter wells with different secondary cytokine combinations. An evaluation of colony number, morphology, and differentiation then occurs 14 days later.
Differential cell count
Cells from culture samples were centrifuged onto slides (350 rpm for 5 min) by cytospin (Shandon, Pittsburgh, PA). Slides were stained with Wright-Giemsa (Sigma) staining. All cells on the slide were monitored and individual counts of 100–200 cells or more carried out. If there were fewer than 100 cells, all cells on the slide were counted. Proliferative granulocytes =myeloblasts, promyelocytes, and myelocytes; non-proliferative granulocytes =metamyelocytes, bands; and polyporphonucelar granulocytes, MCC =macrophages and megs =megakaryocytes.
Microscope
Photomicrographs were obtained using a Zeiss zoom inverted microscope.
Statistics
For all statistical analysis we used STATA®9.0(STATA Corp., College Station, TX). We performed descriptive statistics, utilizing means and standard deviations as measures of central tendency and dispersion, respectively. We then calculated the coefficients of variation (COV) assuming that the underlying data was ratio data in nature. We performed bar graphs, box plots, pie graphs, and array graphics for graphical display, using Microsoft Office Excel 2003, STATA 9.0, and the R-program, respectively. We performed logistic regression analysis for the expression of different cell types setting a 95% confidence interval of an odds ratio <>1 and a two-sided P-value of <0.05 as significance levels. Bonferroni correction was performed to maintain the relevance of P values while performing multiple comparisons in the same experiment.
Results
Cell cycle analysis of LRH cells stimulated by thrombopoietin FLT3 and steel factor in culture
LRH cells were separated on the basis of quiescence and were tightly synchronized in G0/earlyG1 at isolation. When exposed to cytokines which induce cell cycle passage, they tightly progress through cell cycle. This we previously documented with cell cycle studies on LRH stem cells which showed synchronized cycle passage which persisted through a total of six cycles. A tightly synchronized cycle progression also occurs with stimulation with TPO, steel factor, and FLT3. This is shown in Figure 2.
Fig. 2.

Cell cycle status of LRH cells at different points in cell cycle transit after stimulation with thrombopoietin (TPO), FLT-3, and steel factor for different time periods. Cells were stained with propidium iodide and analyzed by FACS. (Reproduced courtesy of Colvin et al., 2007.)
We searched to analyze the measures of central tendency and dispersion in the differentiation expression pattern of our single cell assayed, clonal stem cell population. We investigated those statistical measures on several different levels.
Cloning efficiency
We evaluated the clonal efficiency. The ranges of efficient cloning were large, ranging from 8.3% to 65%. The mean was 31.7% with a large standard deviation of 16.6%, reflecting the large variability around our cell populations across different experimental conditions.
Gross colony morphology
A striking feature of these clonal studies on LRH cells at different points in cell cycle passage is the total heterogeneity of gross colony morphology. This is illustrated in Figure 3. There were moon shaped colonies, superficial colonies, ragged colonies, large and small colonies, and a wide variation of colony size, outline, and density. There were virtually no look-a-like colonies.
Fig. 3.

A–D: Gross colony morphology. LRH marrow cells were cultured in steel factor, FLT-3, and thrombopoietin for different times; 0, 18, 32, and 40 h, and differentiation stimulated with G-CSF, GM-CSF, and steel factor at level C. [Color figure can be viewed in the online issue, which is available at www.interscience.wiley.com.]
Essentially, all clonal units showed different gross colony morphology whether stimulated by G-CSF, GM-CSF, and steel factor or G-CSF, GM-CSF, steel factor, TPO, and FLT3. There was essentially total heterogeneity as to colony morphology.
Second, we analyzed the measures of central tendency and dispersion of the total cell expression (counts) per well. We calculated the means and standard deviation of the total cell expression for every specific condition at time points 0, 18, 32, and 40 h (Table 1). To illustrate the magnitude of dispersion around the mean, we also calculated the COV for selected conditions. The COV represents the quotient of the standard deviation (σ) by the mean (μ) and is expressed as percent value of the mean (μ). Since the standard deviation is dependent on the number of total experiments, the COV is just used for illustrative purposes in our report. Also, we graphically displayed the variation around the mean by box plots juxtaposing the different experimental conditions and their total cell count patterns (Figure 4).
TABLE 1.
Total cell count expression per colony
| Timea | Cytokine type and cytokine level
|
|||||
|---|---|---|---|---|---|---|
| Bb
|
Cb
|
Db
|
||||
| TFSGGMc | GGMSc | TFSGGMc | GGMSc | TFSGGMc | GGMSc | |
| 0 | 165,555 (87,189) | 148,685 (65,842) | 133,613 (119,416) | 66,843 (53,823) | 113,321 (65,856) | 116,069 (64,433) |
| 18 | 183,366 (100,032) | 191,305 (94,914) | 80,969 (42,261) | 0 (0) | 83,671 (44,166) | 45,860 (74,894) |
| 32 | 139,349 (81,928) | 142,460 (89,095) | 72,106 (102,240) | 96,764 (83,214) | 34,351 (42,773) | 46,187 (42,666) |
| 40 | 120,366 (89,088) | 176,148 (54,910) | 81,259 (12,082) | 110,136 (87,080) | 67,991 (108,724) | 93,686 (77,442) |
The table above displays the means of cell count expression and their standard deviation (in parenthesis).
Time in primary cytokine.
At level B, the GGMS combination contained GM-CSF and G-CSF at concentrations of 0.375 and 0.75 ng/ml, respectively, while the TFSGGM combination contained at level B GM-CSF at 0.375 ng/ml, G-CSF at 0.75 ng/ml, G-CSF at 0.75 ng/ml, Flt3l at 10 ng/ml, and thrombopoietin at 20 ng/ml. Levels C and D represented sequential log reductions in concentrations of each cytokine except steel factor for both cytokine cocktails.
Two different cytokine cocktails are listed as: TFSGGM (TPO, Flt3l, steel, G-CSF, GM-CSF) and GGMS (G-CSF, GM-SCF, steel). For both cytokine combinations, TFSGGM and GGMS, the steel factor level is kept at 50 ng/ml for all levels.
Fig. 4.

Box plots for the total cell count expression for different experimental conditions. Subparts (B–D) represent different levels of the cytokine cocktails (see Experimental Procedures Section). [Color figure can be viewed in the online issue, which is available at www.interscience.wiley.com.]
Total cell count expression
The means of total cell count expression as well as the corresponding standard deviations are displayed in Table 1. The standard deviations as a measure of dispersion or variability were consistently very high. This was reflected by high COV, which had an average of 76% (range 14–160%). The graphical illustration, using box plots, drives the fact of a large degree of heterogeneity within identical conditions home (Fig. 4).
The box plots demonstrate the median of total cell count expression over the different time points and conditioning media (central line in the box) and the range of one standard deviation (upper and lower margin of the box). The whiskers represent the last values within the fence of two standard deviations. The remaining plots represent the outliers, the values that are further than two standard deviations distanced from the median.
These data show the quantitative differences between clonal entities. The wide variances and large amount of statistical outliers as well as the differences of the medians in between the different conditioning media demonstrate essentially total heterogeneity at isolation of the stem cells, at different times in cell cycle, with different cytokine combinations and at different cytokine concentrations. This is also reflected by the large COV, average of 76% (range 14–160%).
Third, we analyzed the expression of different cell types over time as well as across different conditioning media. Again, we calculated the mean as well as the standard deviation of the expression of different cell type counts (Table 2A–D). We then performed logistic regression, defining the expression of a cell type as dependent variable and, hence, as the binary outcome event. The type and concentration of cytokine cocktail used in the culture medium, as well as the cell cycle time point of the synchronized cell population, have been demonstrated in the past to influence the expression of different cell types in previous stem cell experiments and were, hence, retained in our final model. We analyzed the magnitude and statistical significance of all three covariates (i.e., cytokine cocktail, level or concentration of the cytokine cocktail, and cell cycle time point) on the expression of each single cell type. A Bonferroni correction was applied to prevent inflation of the total alpha error by multiple comparisons (Table 3).
TABLE 2.
(A) Proliferative granulocytes count expression; (B) non-proliferative granulocytes count expression; (C) macrophage count expression; (D) megakaryocyte count expression
| Timea | Bb
|
Cb
|
Db
|
|||
|---|---|---|---|---|---|---|
| TFSGGMc | GGMSc | TFSGGMc | GGMSc | TFSGGMc | GGMSc | |
| (A) Proliferative granulocytes | ||||||
| 0 | 27,400 (94,275) | 6,014 (7,882) | 37,323 (52,891) | 88,015 (58,906) | 11,469 (16,368) | 20,169 (27,281) |
| 18 | 38,357 (81,403) | 11,970 (19,910) | 28,983 (46,878) | 68,588 (82,444) | 0 (0) | 3,913 (11,587) |
| 32 | 80,664 (9,646,220) | 6,024 (9,227,950) | 9,857 (24,042) | 56,421 (54,506) | 40,827 (58,934) | 11,056 (15,019) |
| 40 | 19,807 (42,252) | 1,633 (52,861) | 3,235 (5,963) | 28,951 (53,420) | 19,305 (18,946) | 27,294 (26,092) |
| (B) Non-proliferative granulocytes | ||||||
| 0 | 22,138 (36,384) | 57,994 (78,037) | 61,028 (61,639) | 35,015 (36,868) | 44,859 (51,855) | 91,915 (66,797) |
| 18 | 44,284 (47,495) | 27,227 (28,315) | 35,689 (31,561) | 76,159 (82,094) | 0 (0) | 27,107 (52,369) |
| 32 | 49,530 (59,771) | 45,680 (95,840) | 18,597 (64,169) | 53,289 (64,169) | 54,049 (48,358) | 31,056 (64,971) |
| 40 | 42,700 (53,510) | 27,878 (50,112) | 25,832 (30,438) | 54,295 (46,370) | 78,638 (61,960) | 62,561 (82,688) |
| (C) Macrophages | ||||||
| 0 | 117,718 (75,013) | 69,605 (78,303) | 14,636 (17,654) | 26,284 (46,944) | 10,514 (20,037) | 3,985 (7,010) |
| 18 | 100,559 (75,025) | 41,609 (37,288) | 18,856 (36,956) | 44,672 (56,754) | 0 (0) | 14,268 (25,889) |
| 32 | 9,585 (22,691) | 20,158 (24,438) | 5,889 (8,104) | 31,824 (41,814) | 1,888 (3,902) | 4,075 (6,865) |
| 40 | 44,661 (46,693) | 19,625 (28,513) | 2,893 (4,909) | 92,902 (53,429) | 12,193 (14,747) | 1,131 (2,993) |
| (D) Megakaryocytes | ||||||
| 0 | 0 (0) | 0 (0) | 335 (875) | 125 (584) | 0 (0) | 0 (0) |
| 18 | 126 (398) | 163 (518) | 144 (431) | 0 (0) | 0 (0) | 1,571 (7,201) |
| 32 | 0 (0) | 244 (838) | 8 (24) | 12 (76) | 0 (0) | 0 (0) |
| 40 | 5,511 (15,500) | 1,558 (5,171) | 37 (117) | 0 (0) | 0 (0) | 0 (0) |
The table above displays the means of the total cell count expression and their standard deviation (in parenthesis).
Time in primary cytokine.
At level B, the GGMS combination contained GM-CSF and G-CSF at concentrations of 0.375 and 0.75 ng/ml, respectively, while the TFSGGM combination contained at level B GM-CSF at 0.375 ng/ml, G-CSF at 0.75 ng/ml, Flt3l at 10 ng/ml, and thrombopoietin at 20 ng/ml. Levels C and D represented sequential log reductions in concentrations of each cytokine except steel factor for both cytokine cocktails.
Two different cytokine cocktails are listed as: TFSGGM (TPO, Flt3l, steel, G-CSF, GM-CSF) and GGMS (G-SCF, GM-SCF, steel). For both cytokine combinations, TFSGGM and GGMS, the steel factor level is kept at 50 ng/ml for all levels.
TABLE 3.
Logistic regression for specific cell type
| Variable | PG | 95% CIa | P* | NPG | 95% CIa | P* | MAC | 95% CIa | P* | MEG | 95% CIa | P* |
|---|---|---|---|---|---|---|---|---|---|---|---|---|
| 0 h | 1* | NA | NA | 1* | NA | NA | 1* | NA | NA | 1* | NA | NA |
| 18 h | 0.36 | 0.22–0.61 | <0.01 | 0.35 | 0.18–0.65 | <0.01 | 0.8 | 0.48–1.33 | 0.39 | 1.29 | 0.4–4.1 | 0.67 |
| 32 h | 1.87 | 1.03–3.4 | 0.04 | 0.59 | 0.30–1.16 | 0.13 | 0.39 | 0.24–0.65 | <0.01 | 0.7 | 0.2–2.4 | 0.57 |
| 40 h | 0.53 | 0.29–0.97 | 0.04 | 0.63 | 0.29–1.4 | 0.27 | 0.59 | 0.32–1.1 | 0.09 | 3.4 | 1.16–10.2 | 0.03 |
| GGMS | 1* | NA | NA | 1* | NA | NA | 1* | NA | NA | 1* | NA | NA |
| TFSGGM | 0.51 | 0.34–0.76 | <0.01 | 0.97 | 0.61–1.5 | 0.88 | 1.74 | 1.2–2.57 | 0.01 | 6.5 | 2.39–17.5 | <0.01 |
| Level 1 | 1* | NA | NA | 1* | NA | NA | 1* | NA | NA | 1* | NA | NA |
| Level 2 | 0.39 | 0.25–0.61 | <0.01 | 0.40 | 0.24–0.66 | <0.01 | 0.59 | 0.38–0.91 | 0.02 | 0.77 | 0.32–1.87 | 0.57 |
| Level 3 | 0.44 | 0.26–0.73 | <0.01 | 0.55 | 0.31–0.97 | 0.04 | 0.52 | 0.32–0.84 | 0.01 | 1.07 | 0.4–2.9 | 0.89 |
Results of our logistic regression, modeling the expression of proliferative granulocyte (PG), non-proliferative granulocytes (NPG), macrophages (MCC), and megakaryocytes (MEG) as binary events.
PG, proliferative granulocyte; NPG, non-proliferative granulocytes; MAC, macrophages; MEG, megakaryocytes.
P values for the odds ratio, Bonferroni corrected for the issue of multiple comparisons.
95% confidence intervals for the odds of the different cell type expressions, including cytokine type, cytocline level, and time points in the logistic regression model.
Cell type expression
We again calculated the means, standard deviations, and selected COV for the total counts of specific cell types across time as well as the two different cytokine cocktails and their three different levels. The large standard deviations are again a mathematical reflection of the large variability around the mean of the cell type expression, reflects the decreasing number of experiments (n) as well, though. A trend towards a higher expression of the different cell types was observed with the higher cytokine cocktail concentrations (level B). Also, a higher expression of megakaryocytes was observed at the 40 h time point. Overall, a large variability within the different experimental conditions as well as within experiments following identical experimental conditions was observed.
Table 2A–D outline the average cell count of the four different cell types investigated under the different experimental conditions over time (0, 18, 32, and 40 h) and Figures 5 and 6 illustrate the variation between individual clones under different conditions and at different cycle times.
Fig. 5.
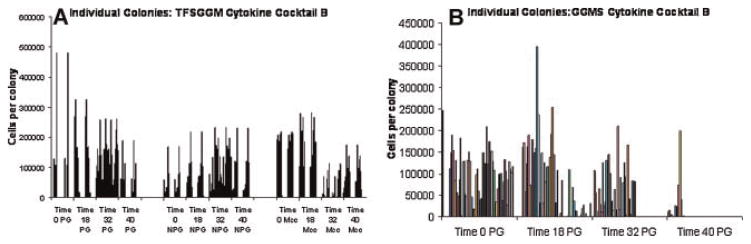
A: Individual colony numbers. This graph illustrates the expression of proliferative granulocytes (PG), non-proliferative granulocytes (NPG), and macrophages (Mac) at different time points with the cytokine cocktail TFSGGM at level B. All colonies for this specific experimental condition are displayed. B: Proliferative granulocytes. This figure provides a closer look at the expression of proliferative granulocytes at different timepoints, utilizing the GGMS cytokine cocktail at level B. Both graphs again demonstrate the large variability in the expression of the different cell types, even when cultured under identical conditions.
Fig. 6.

Patterns of differentiation. PG, proliferative granulocytes; NPG, non-proliferative granulocytes; MCC, macrophages; megs, megakaryocytes.
We performed logistic regression to model the odds of the expression of a specific cell type, introducing time, cytokine cocktail, and cytokine concentration as independent variables (Table 3).
Table 3 displays the odds ratio for a specific cell type being expressed under specific conditions. Of note is that the expression of a cell type was considered a binary event, regardless of the magnitude of the expression. It becomes obvious, that the utilization of TFSGGM as cytokine cocktail, as well as the 40 h time point in the cell cycle, were statistically significantly associated with the expression of megakaryocytes, when compared with GGMS and time point 0 h as reference values. Also, a tendency of higher odds for the expression for proliferative granulocytes with increasing concentrations of the GGMS cytokine cocktail were observed.
Fourth, we examined the patterns of expression. Here, the expression of a certain cell type was coded as a binary event. We then demonstrated the density with which the possible patterns (24) were expressed, using pie graphs (Fig. 6).
Patterns
The pie graphs in Figure 6 describe the distribution of expression patterns at different time points, using the TFSGGM at cytokine level B. Here, the expression of a cell type was considered as binary event (i.e., was it expressed or not). The pie graphs outline a large diversity of different observed cell type expression combinations. However, they also illustrate that the expression of megakaryocytes containing combinations were more prevalent at the 40 h time point and that there were different patterns for specific lineages at different time in culture or cycle points. Note that relatively large pattern shifts for different lineage combinations.
Global expression
We performed a global, synoptic graphical display of the variability of the different cell type expression patterns in an array graphic (Fig. 7). This allows integration of the magnitude of the cell lineage expression.
Fig. 7.

An array graphic. This graphic is plotted in software R by the function called image, and the high expression of each experiment is indicated in bright red and light green indicates low expression. PG, proliferative granulocytes; NPG, non-proliferative granulocytes; MCC, macrophages; meg, megakaryocytes.
We juxtaposed the experiments in the following categorical manner: time points, cytokine cocktails, cytokine levels. The graphic in Figure 7 outlines in a synoptic view that all single cell experiments were associated with different expression patterns. Also, the overall higher expression of megakaryocytes is easily visible in the upper right corner of the graph.
Discussion
Highly purified lineage negative rhodamine low Hoechst low cells showed virtually total heterogeneity at isolation and at different points in a cytokine stimulated cell cycle transit. Thus, the stem cell shows almost complete heterogeneity even at synchronized points in cell cycle. These observations indicate that the phenotype of the stem cell must exist in a continuum in which phenotypic changes occur over short intervals of time. They are inconsistent with there being a limited number of discrete stem cell subsets as suggested by the article of Muller-Sieburg et al. (2002). In this latter communication using limiting dilution approaches and stem cell transplantation, repopulation kinetics were grouped according to overall shape. Only 16 types of repopulation kinetics were found among the HSC clones even though 54 groups were possible. The interpretation of these data was that the hematopoietic stem cell compartment consisted of a limited number of distinct HSC subsets with predictable behavior. However, as we have shown in this communication, evaluation of other functional parameters, such as differentiation in response to a set number of cytokines, significantly extends the number of subsets. A striking feature of the present results is that the heterogeneity was virtually total for all considered differentiation parameters.
Stem cell heterogeneity has been reported for time of engraftment and differentiation. Further, heterogeneity is seen as to membrane phenotype, movement in stromal Dexter cultures, and in vivo homing to marrow (Wolf et al., 1993; Zhong et al., 1996; Colvin et al., 2007). We have observed cell cycle related alterations of phenotype with lineage –Sca-1+ and LRH marrow stem cells as to cytokine receptor and transcription factor expression, and the surface expression of different putative stem cell epitopes such as Sca-1, c-kit, and CD34. We have also observed marked fluctuations in mRNA expression for Mac-1 and CD4 as stem cells pass through cell cycle, and there is further evidence of heterogeneity based on mRNA expression of cytokine receptors and stem cell markers.
One mechanism underlying this observed heterogeneity may be the intrinsic stochastic nature of the stem cells. However, the continuum theory, which posits that the stem cell is always changing phenotype with cell cycle passage and other data that indicates that the stem cell is in fact a cycling cell, would predict that there would be a total and continually changing phenotype for these cells. We and others have previously reported on significant shifts in hematopoietic cellular phenotype with circadian rhythm. Our studies showed that this held for engraftable stem cells and for the cell cycle status of progenitors. Thus, another possible explanation for these results is continual changes with circadian rhythm which in turn might be related to cell cycle status. The underlying mechanism is approachable by experimental studies.
These data indicate that marrow stem cells are most adequately defined on a population basis. Clonal studies, while of interest in showing the ultimate potential of an individual stem cell will, in general, be misleading and generally serve only to demonstrate the intrinsic heterogeneity of the stem cell population under consideration. This type of heterogeneity would seem to be a reasonable safeguard against the extinction of a critical cell population by toxic or differentiation stresses and further suggests a continuous spectrum of stem cell phenotype probably connected to cell cycle phase.
The studies on individual colony differentiation and on observed patterns of differentiation echo the comments of Till et al. (1964). The individual colony data is unpredictable and gives widely varied results even in the face of specific patterns of differentiation. These data on heterogeneity of stem cell differentiation phenotype at isolation and at different points in a cytokine induced cell cycle transit, are most consistent with a continuum model of hematopoiesis and serve to give a proper perspective to stem cell clonal studies.
Acknowledgments
Contract grant sponsor: National Institutes of Health (NCRR);
Contract grant number: P20RR018757;
Contract grant sponsor: National Institutes of Health (NIDDK);
Contract grant numbers: R01 DK60084, R01 DK60090-01A1, K08DK6498, DK27424-18;
Contract grant sponsor: Rhode Island Foundation;
Contract grant numbers: 20040186, 20040331.
Footnotes
Authorship: Gerald Colvin performed the research, analyzed and interpreted data, and wrote the manuscript. David Berz analyzed and interpreted data and provided statistical analysis. Liansheng Liu performed the research. Mark Dooner performed the research. Gerri Dooner performed the research and wrote the manuscript. Sheila Pascual analyzed and interpreted data. Samuel Chung analyzed and interpreted data. Yunxia Sui provided statistical analysis. Peter J. Quesenberry designed and performed the research analyzed and interpreted data and wrote the manuscript.
Literature Cited
- Abkowitz JL, Golinelli D, Harrison DE, Guttorp P. In vivo kinetics of murine hemopoietic stem cells. Blood. 2000;96:3399–3405. [PubMed] [Google Scholar]
- Becker PS, Nilsson SK, Li Z, Berrios VM, Dooner MS, Cooper CL, Hsieh CC, Quesenberry PJ. Adhesion receptor expression by hematopoietic cell lines and murine progenitors: Modulation by cytokines and cell cycle status. Exp Hematol. 1999;27:533–541. doi: 10.1016/s0301-472x(98)00037-x. [DOI] [PubMed] [Google Scholar]
- Berrios VM, Dooner GJ, Nowakowski G, Frimberger A, Valinski H, Quesenberry PJ, Becker PS. The molecular basis for the cytokine-induced defect in homing and engraftment of hematopoietic stem cells. Exp Hematol. 2001;29:1326–1335. doi: 10.1016/s0301-472x(01)00734-2. [DOI] [PubMed] [Google Scholar]
- Bertoncello I, Bradley TR, Hodgson ES, Dunlop JM. The resolution, enrichment, and organization of normal bone marrow high proliferative potential colony-forming cell subsets on the basis of rhodamine-123 fluorescence. Exp Hematol. 1991;19:174–178. [PubMed] [Google Scholar]
- Bradford GB, Williams B, Rossi R, Bertoncello I. Quiescence, cycling, and turnover in the primitive hematopoietic stem cell compartment. Exp Hematol. 1997;25:445–453. [PubMed] [Google Scholar]
- Cerny J, Dooner M, McAuliffe C, Habibian H, Stencil K, Berrios V, Reilly J, Carlson J, Cerny AM, d’Hondt L, Benoit B, Lambert JF, Colvin G, Nilsson S, Becker P, Quesenberry PJ. Homing of purified murine lymphohematopoietic stem cells: A cytokine-induced defect. J Hematother Stem Cell Res. 2002;11:913–922. doi: 10.1089/152581602321080574. [DOI] [PubMed] [Google Scholar]
- Cheshier SH, Morrison SJ, Liao X, Weissman IL. In vivo proliferation and cell cycle kinetics of long-term self-renewing hematopoietic stem cells. Proc Natl Acad Sci USA. 1999;96:3120–3125. doi: 10.1073/pnas.96.6.3120. [DOI] [PMC free article] [PubMed] [Google Scholar]
- Colvin GA, Lambert JF, Moore BE, Carlson JE, Dooner MS, Abedi M, Cerny J, Quesenberry PJ. Intrinsic hematopoietic stem cell/progenitor plasticity: Inversions. J Cell Physiol. 2004;199:20–31. doi: 10.1002/jcp.10436. [DOI] [PubMed] [Google Scholar]
- Colvin GA, Dooner MS, Dooner GJ, Sanchez-Guijo FM, Demers DA, Abedi M, Ramanathan M, Chung S, Pascual S, Quesenberry PJ. Stem cell continuum: Directed differentiation hotspots. Exp Hematol. 2007;35:96–107. doi: 10.1016/j.exphem.2006.09.005. [DOI] [PubMed] [Google Scholar]
- Fleming WH, Alpern EJ, Uchida N, Ikuta K, Spangrude GJ, Weissman IL. Functional heterogeneity is associated with the cell cycle status of murine hematopoietic stem cells. J Cell Biol. 1993;122:897–902. doi: 10.1083/jcb.122.4.897. [DOI] [PMC free article] [PubMed] [Google Scholar]
- Guenechea G, Gan OI, Dorrell C, Dick JE. Distinct classes of human stem cells that differ in proliferative and self-renewal potential. Nat Immunol. 2001;2:75–82. doi: 10.1038/83199. [DOI] [PubMed] [Google Scholar]
- Habibian HK, Peters SO, Hsieh CC, Wuu J, Vergilis K, Grimaldi CI, Reilly J, Carlson JE, Frimberger AE, Stewart FM, Quesenberry PJ. The fluctuating phenotype of the lymphohematopoietic stem cell with cell cycle transit. J Exp Med. 1998;188:393–398. doi: 10.1084/jem.188.2.393. [DOI] [PMC free article] [PubMed] [Google Scholar]
- Jordan CT, Lemischka IR. Clonal and systemic analysis of long-term hematopoiesis in the mouse. Genes Dev. 1991;4:220–232. doi: 10.1101/gad.4.2.220. [DOI] [PubMed] [Google Scholar]
- Keller G. Clonal analysis of hematopoietic stem cell development in vivo. Curr Top Microbiol Immunol. 1992;177:41–57. doi: 10.1007/978-3-642-76912-2_4. [DOI] [PubMed] [Google Scholar]
- Lambert JF, Liu M, Colvin GA, Dooner M, McAuliffe CI, Becker PS, Forget BG, Weissman SM, Quesenberry PJ. Marrow stem cells shift gene expression and engraftment phenotype with cell cycle transit. J Exp Med. 2003;197:1563–1572. doi: 10.1084/jem.20030031. [DOI] [PMC free article] [PubMed] [Google Scholar]
- Muller-Sieburg CE, Cho RH, Thoman M, Adkins B, Sieburg HB. Deterministic regulation of hematopoietic stem cell self-renewal and differentiation. Blood. 2002;100:1302–1309. [PubMed] [Google Scholar]
- Necas E, Znojil V. CFU-S content and cycling rate in several strains of mice. Exp Hematol. 1987;15:759–764. [PubMed] [Google Scholar]
- Necas E, Znojil V. Bone marrow response to single small doses of irradiation: Implications for stem cell functional organization. Exp Hematol. 1988;16:871–875. [PubMed] [Google Scholar]
- Osawa M, Hanada K, Hamada H, Nakauchi H. Long-term lymphohematopoietic reconstitution by a single CD34-low/negative hematopoietic stem cell. Science. 1996;273:242–245. doi: 10.1126/science.273.5272.242. [DOI] [PubMed] [Google Scholar]
- Pang L, Reddy PV, McAuliffe CI, Colvin G, Quesenberry PJ. Studies on BrdU labeling of hematopoietic cells: Stem cells and cell lines. J Cell Physiol. 2003;197:251–260. doi: 10.1002/jcp.10357. [DOI] [PubMed] [Google Scholar]
- Passegue E, Wagers AJ, Giuriato S, Anderson WC, Weissman IL. Global analysis of proliferation and cell cycle gene expression in the regulation of hematopoietic stem and progenitor cell fates. J Exp Med. 2005;202:1599–1611. doi: 10.1084/jem.20050967. [DOI] [PMC free article] [PubMed] [Google Scholar]
- Quesenberry PJ, Colvin GA, Lambert JF. The chiaroscuro stem cell: A unified stem cell theory. Blood. 2002;100:4266–4271. doi: 10.1182/blood-2002-04-1246. [DOI] [PubMed] [Google Scholar]
- Quesenberry PJ. The continuum model of marrow stem cell regulation. Curr Opin Hematol. 2006;13:216–221. doi: 10.1097/01.moh.0000231417.08031.ac. [DOI] [PubMed] [Google Scholar]
- Quesenberry PJ, Colvin GA, Abedi M, Dooner G, Dooner M, Aliotta J, Keaney P, Luo L, Demers D, Peterson A, Foster B, Greer D. The stem cell continuum. Ann NY Acad Sci. 2005;1044:228–235. doi: 10.1196/annals.1349.028. [DOI] [PubMed] [Google Scholar]
- Reddy GP, Tiarks CY, Pang L, Wuu J, Hsieh CC, Quesenberry PJ. Cell cycle analysis and synchronization of pluripotent hematopoietic progenitor stem cells. Blood. 1997;90:2293–2299. [PubMed] [Google Scholar]
- Reddy GP, McAuliffe CI, Pang L, Quesenberry PJ, Bertoncello I. Cytokine receptor repertoire and cytokine responsiveness of Ho(dull)/Rh(dull) stem cells with differing potentials for G1/S phase progression. Exp Hematol. 2002;30:792–800. doi: 10.1016/s0301-472x(02)00814-7. [DOI] [PubMed] [Google Scholar]
- Roeder I, Kamminga LM, Braesel K, Dontje B, de Haan G, Loeffler M. Competitive clonal hematopoiesis in mouse chimeras explained by a stochastic model of stem cell organization. Blood. 2005;105:609–616. doi: 10.1182/blood-2004-01-0282. [DOI] [PubMed] [Google Scholar]
- Smith LG, Weissman IL, Heimfeld S. Clonal analysis of hematopoietic stem-cell differentiation in vivo. Proc Natl Acad Sci USA. 1991;88:2788–2792. doi: 10.1073/pnas.88.7.2788. [DOI] [PMC free article] [PubMed] [Google Scholar]
- Till JE, McCulloch EA. A direct measurement of the radiation sensitivity of normal mouse bone marrow cells. Radiat Res. 1961;14:213–222. [PubMed] [Google Scholar]
- Till JE, McCulloch EA, Siminovitch L. A stochastic model of stem cell proliferation based on the growth of spleen colony-forming cells. Proc Natl Acad Sci USA. 1964;51:29–36. doi: 10.1073/pnas.51.1.29. [DOI] [PMC free article] [PubMed] [Google Scholar]
- Uchida N, Dykstra B, Lyons KJ, Leung FY, Eaves CJ. Different in vivo repopulating activities of purified hematopoietic stem cells before and after being stimulated to divide in vitro with the same kinetics. Exp Hematol. 2003;31:1338–1347. doi: 10.1016/j.exphem.2003.09.001. [DOI] [PubMed] [Google Scholar]
- Wolf NS, Kone A, Priestly GV, Bartelmez SH. In vivo and in vitro characterization of long-term repopulating primitive hematopoietic cells isolated by sequential Hoechst 33342-rhodamine 123 FACS selection. Exp Hematol. 1993;21:614–622. [PubMed] [Google Scholar]
- Zhong RK, Astle CM, Harrison DE. Distinct developmental patterns of short-term and long-term functioning lymphoid and myeloid precursors defined by competitive limiting dilution analysis in vivo. J Immunol. 1996;157:138–145. [PubMed] [Google Scholar]