Abstract
The effective speed of a swept source optical coherence tomography (SSOCT) imaging system was quadrupled using efficient sweep buffering along with coherence revival and spatial multiplexing. A polarizing beam splitter and fold mirror assembly were used to create a dual spot sample arm with a common objective designed for near-diffraction-limited retinal imaging. Using coherence revival, a variable optical delay line allowed for separate locations within a sample to be simultaneously imaged and frequency encoded by carefully controlling the optical path length of each sample path. This method can be used to efficiently quadruple the imaging speedof any SSOCT system employing a low duty-cycle laser that exhibits coherence revival. The system was used to image the retina of healthy human volunteers.
OCIS codes: (110.4500) Optical coherence tomography, (110.4190) Multiple imaging, (170.4460) Ophthalmic optics and devices
Optical coherence tomography (OCT) is a three-dimensional interferometric imaging technique capable of achieving micrometer scale resolution. It is now a standard of care in ophthalmology, where it is used to improve the accuracy of early diagnosis, to better understand the source of pathophysiology, and to monitor disease progression and response to therapy. In particular, retinal imaging has been the most prevalent clinical application of OCT, but researchers and companies alike are developing OCT systems for cardiology, dermatology, dentistry, and a myriad of other medical applications. Despite the burgeoning demand for OCT systems, acquisition speeds often limit the practitioner's ability to obtain high-quality three-dimensional images. As the scan time is extended to obtain an entire three-dimensional data set, patient motion corrupts and distorts the image. This has driven engineers to develop methods to increase the acquisition speed of OCT. Most of this effort has been to increase the speed of the hardware by making a laser that can sweep more rapidly, using a low duty-cycle laser along with buffering to effectively increase the sweep speed, or using a faster camera in the case of spectral domain OCT. Another approach, demonstrated fairly recently, has been to use multiple beams to increase the effective A-line rate.
In some ways, the history of multiple beams in OCT started as early as 1991, with efforts to reduce motion artifacts using the anterior corneal surface as a reference [1,2], but these efforts did not increase the A-line rate. The first demonstration of multiple beams to increase the acquisition speed of an OCT system was made using the central 6 channels of a 12 channel optical fan-out cable, each paired with a separate interferometer, reference arm, and receiver [3]. Similar efforts followed, demonstrating multiple spot swept source optical coherence tomography (SSOCT) imaging of the human nail fold [4] and the human eye [5]. These studies were successful in increasing the imaging speed. However, one drawback remains unresolved by these techniques: every time they add a beam, they need to add another reference arm, interferometer, and receiver, rendering the system increasingly complex, expensive, and more difficult to maintain.
We introduced coherence-revival-based SSOCT [6] to extend the imaging depth by resolving the complex conjugate ambiguity. Next, the technique was applied to simultaneous imaging of the anterior and posterior segment of the eye [7]. In this Letter, we describe an efficient method to quadruple the imaging speed of an SSOCT system without the use of an additional reference arm, interferometer, digitizer, and receiver. This is achieved by employing optical-switch-based sweep buffering [8] and by combining coherence-revival-based SSOCT with a polarization-encoded spatially multiplexed sample arm. To demonstrate its application in vivo, the system was used to image the retinas of healthy human volunteers.
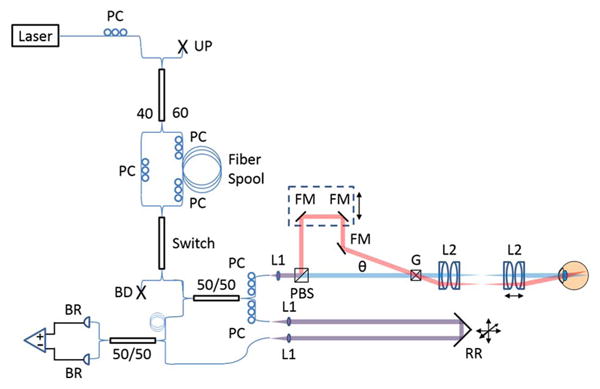
An SSOCT system (Fig. 1) with a Mach–Zehnder topology was constructed using an Axsun Technologies laser with a central wavelength of 1040 nm, a 100 nm bandwidth, and a 100 kHz sweep rate. The buffering stage consisted of a fused fiber coupler, a fiber spool, an optical switch, and polarization controllers. A 60/40 coupler was used to compensate the 1.5 dB attenuation of the fiber spool so that both the original and buffered sweeps had similar power. The polarization controllers were used to adjust the polarization states of the inputs to the spool and both ports of the switch. This was particularly important for managing polarization mode dispersion generated in the spool and switch. In the sample arm, a polarizing beam splitter (1000: 1 transmission and 100: 1 reflection extinction ratio, specified by the manufacturer) was used to split the single input into two beams and a fold mirror assembly was used to create a spatial offset between the two spots on the retina. Polarization paddles were adjusted to balance the power on each spot to deliver 900 μW in each beam, giving a total power, consistent with the ANSI limit [9], of 1.8 mW. The first beam (the “primary beam”) was matched to the reference path, giving a conventional configuration. A variable optical delay line allowed for the second beam (the “secondary beam”) to be offset from the reference path by one cavity length, giving a coherence revival configuration. This served to encode the secondary beam with a carrier frequency to create separate coherence gates for the two images. Adjustment of the variable optical delay line was achieved using a translation stage (dashed box in Fig. 1). In order to keep the back-coupling efficiency insensitive to the position of the variable optical delay, we aligned the system so that the galvo entrance beams were coplanar. The spatial offset on the retina was achieved by setting the angle θ to approximately 10 deg.
Fig. 1.

SSOCT buffered, dual spot system with Mach-Zehnder topology. PC, polarization controller; UP, unused port; BD, beam dump; BR, balanced receiver. Sample arm: blue and red lines depict the primary and secondary beams, respectively. Overlapping paths are shown in purple. L1 and L2, lenses. PBS, polarizing beamsplitter; FM, fold mirror; G, galvanometers; θ, angle between primary and secondary beams. Transmissive reference arm: RR, retroreflector. Adjustability shown with black arrows.
Optical detection was performed using a 1.0 GHz InGaAs fiber-coupled balanced amplified receiver (PDB481C-AC, Thorlabs Inc.) and digitized at 1 GS/s on an 8 bit (6.37 effective number of bits), 500 MHz bandwidth digitizer (ATS9870, Alazar Tech). Output from the balanced receiver was further amplified using an RF amplifier (HD24388, HD Communications Corp.). Data acquisition and processing were performed in LabVIEW and C. Separate dispersion compensation algorithms were applied for each depth [6] and for each of the original and buffered sweeps [8].
The optical design of the sample arm was optimized in Zemax using off-the-shelf achromatic doublets and an eye model with a gradient index lens [10]. An aspherized achromatic lens was used as a collimator to produce a 2.4 mm beam diameter. The design was optimized over a 20 deg field of view. Near-diffraction-limited performance was achieved, giving a simulated lateral resolution of 18 μm (defined as the mean full width at half-maximum of the point spread function across the field of view). The axial resolution for both paths varied somewhat with depth from 7 to 14 μm (in tissue) over the entire imaging range. The observed change in axial resolution with imaging depth is likely due to residual uncompensated dispersion or imperfect wavenumber calibration. More importantly, over the relatively small imaging range used, the resolution was constant at 7 and 10 μm for the conventional and coherence revival configurations, while the theoretical axial resolution, after applying the spectral shaping window in processing, was 7 μm.
The polarization encoding scheme achieves optimal optical power conservation since all of the light whose polarization is not modified in the sample returns in the appropriate polarization channel. Conversely, had a standard beam splitter been used, half of the backscattered light would be rejected from each channel. The scheme is also effective for crosstalk rejection due to both the orthogonal polarizations of the light returning from each spot and more importantly due to the employment of separate coherence gates for each path. Thus, cross talk between polarization states due to imperfect rejection at the PBS is further mitigated by coherence gating. However, this technique has the drawback that, since the two channels are of orthogonal polarization states, the reference beam cannot be simultaneously aligned to both polarization states. Assuming linear polarization states at the detector, the signal amplitude is reduced by the cosine of the angle between the reference polarization and the sample polarization. As the full reference power still generates shot noise in each channel, the sensitivity is expected to be reduced by the same factor. Therefore, when balancing the reference power evenly between the two channels, we expect a 3 dB sensitivity penalty in each channel. Experimentally, the reference paddles were adjusted to nearly balance the peak sensitivity of each channel and an approximately 3 dB reduction in the peak sensitivity of each channel was observed. It is worth noting that the reference polarization can be optimized to improve the signal in either channel at the expense of the other.
Collection efficiency, peak sensitivity, and sensitivity falloff profiles were measured for each channel of the sample arm. A mirror and a 25 mm focal length lens were placed in the sample arm and aligned to obtain maximum back-coupling. Both the optical power on the sample mirror and the power returning to one receiver channel were measured. We define twice the ratio of these as the collection efficiency, since the power on one channel of the receiver was approximately half of the total power incident on the balanced receiver. The primary and secondary beam collection efficiencies were 24% and 21%, respectively. The secondary beam collection efficiency was slightly lower than that of the primary beam due to the presence of additional mirrors and the off-axis entrance into the galvo pair.
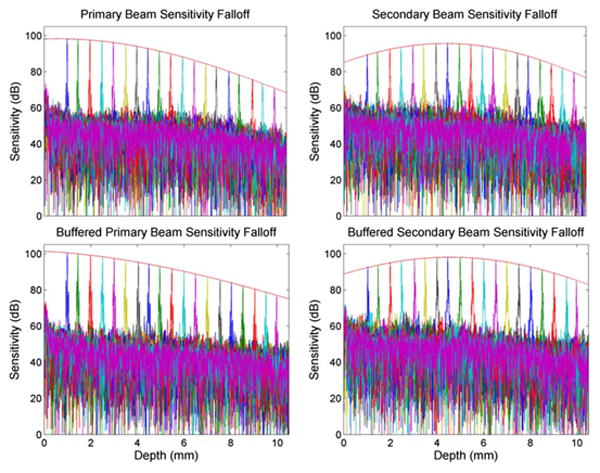
The peak sensitivity and sensitivity falloff profiles were measured using an aperture diaphragm. The attenuation was measured as 48 dB for the primary beam and 50 dB for the secondary beam. Sensitivity was computed as the ratio of the A-scan peak to the standard deviation of the noise floor. The mean peak sensitivity was 98 and 95 dB for the primary and secondary channels, respectively, and the theoretical shot noise limited sensitivity was 99 and 98 dB, respectively. The discrepancy between theoretical and measured sensitivity was mainly due to coupling losses, unbalanced relative intensity noise, and digitization noise. The sensitivity falloff profiles of the primary and secondary channels for both the original and buffered sweeps are shown in Fig. 2. The falloff envelope was obtained with a Gaussian fit of the peak intensity of each A-scan. Using the falloff envelope, we defined the imaging range as the region over which the sensitivity loss measured from the zero path length difference position was 6 dB. For the primary channel, we observed an imaging range of 4.7 mm in air (3.5 mm in tissue). For the secondary channel, the peak sensitivity position appeared at approximately 4.5 mm in depth, and the imaging range spanned 8.0 mm in air (6.0 mm in tissue) from 0.5 to 8.5 mm.
Fig. 2.

Sensitivity falloff profiles and axial resolution (in air) for the primary (left) and secondary (right) imaging channels and for both the unbuffered (top) and buffered (bottom) sweeps. The red fit lines indicate the falloff envelope.
To demonstrate the applicability of buffered dual spot SSOCT in vivo, images were acquired from healthy human volunteers. B-scans were acquired at 200 Hz with 1000 (lateral) × 2304 (axial) pixel images, and volumes were composed of 200 B-scans. Each B-scan consisted of two 500 (lateral) × 2304 (axial) images obtained from the original and buffered sweeps [8]. The original and buffered images were interlaced to obtain the 1000 A-scan per B-scan images. The variable optical delay line was adjusted so that each image was located at the peak sensitivity for its respective configuration. Thus, the image obtained from the primary beam was located near the zero-depth position and the image obtained from the secondary beam was located at a depth position of approximately 4.5 mm.
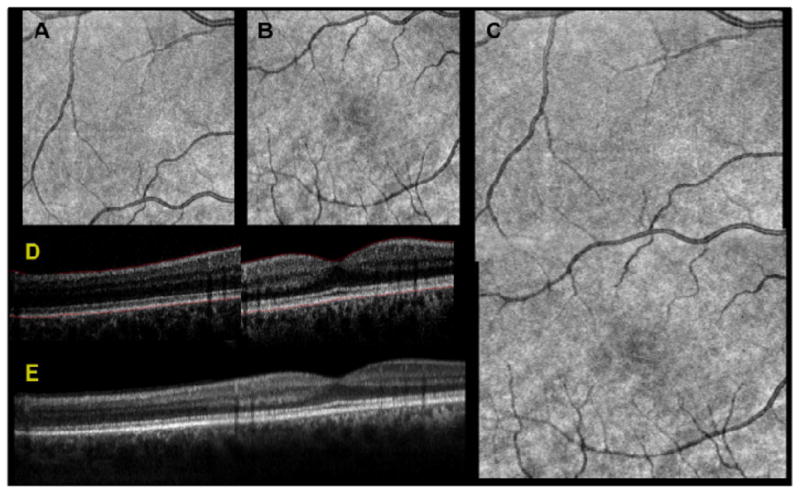
The image processing and registration pipeline used is illustrated in Fig. 3. First, separate dispersion compensation parameters were applied to the two subfield-of-view data sets. Then, the individual subfield-of-view volumes (subvolumes) were extracted from the initial composite with an axial range of approximately 300 pixels each. The intensity of each subvolume was normalized to the maximum of the two to correct for differences in the sensitivity of each image. These subvolumes were used to create the summed voxel projections (SVPs) (Figs. 3A and 3B). The SVPs were then Gabor filtered to accentuate the vasculature [11], and the normalized cross correlation was calculated. The coordinates of the peak of the cross correlation were used to obtain the lateral offsets. These offsets were applied to generate a registered SVP (Fig. 3C). Next, the inner limiting membrane and retinal pigment epithelium were automatically segmented (Fig. 3D) using a published algorithm based on graph theory and dynamic programming [12]. Finally, in the region of overlap between the two images, the axial shift was computed from the segmentation results for each corresponding pixel, and the mean was calculated. The mean axial shift was used to generate a registered composite B-scan. Gaussian feathering was performed at the boundary between the two images to smooth the transition. The signal-to-noise ratio of each image was improved using a sparsity-based denoising algorithm [13]. The same procedure was repeated for each B-scan in the volume to obtain a registered composite volume. Also, although not observed in this study, it is foreseeable that birefringence of ocular tissues could result in artificial image contrast between the two subvolumes in the composite volume.
Fig. 3.

Results of dual spot SSOCT image processing and registration pipeline. Two subfield-of-view volumes were acquired simultaneously, consisting of 1000 A-scans per B-scan for a total of 200 B-scans. The two subvolumes were used to create SVPs, shown for the secondary channel in A and the primary channel in B. The SVPs were then Gabor filtered to accentuate the contrast of the vessels and the peak of the cross correlation was used to obtain the lateral offsets. These offsets were applied and the relative weights of the overlapping region were feathered to generate a registered SVP in C. The inner limiting membrane and the retinal pigment epithelium were automatically segmented, shown in red in D. Using only the region of overlap between the two images, the layer segmentation was used for axial registration, shown after denoising in E.
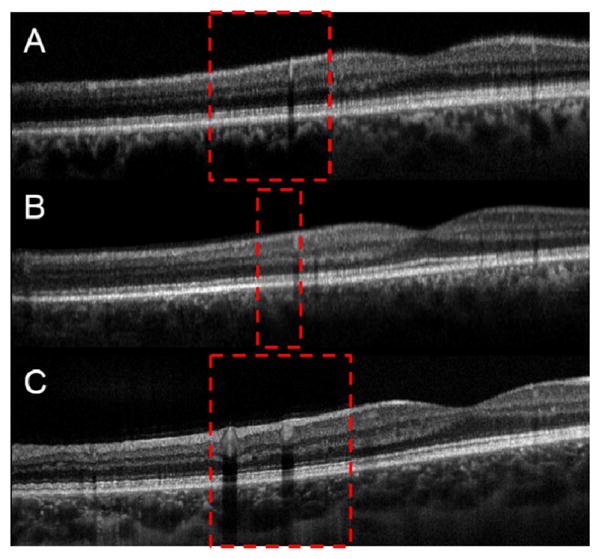
Images from two different healthy volunteers are shown in Fig 4. All of these images are comprised of 1000 A-Scans/B-Scan with 2 B-scans acquired simultaneously. The red dashed box shows the overlap between the two images. The overlap was approximately 25% in Figs. 4A and 4C and 8% in Fig. 4B. Thus, in this case, the composite image has a total of 2000 A-scans, but with 150 A-scans common to both subfilled-of-view images, the displayed B-scan has 1850 A-scans. This single frame buffered dual spot image was acquired in 5 ms at an effective A-scan rate of 400 kHz.
Fig. 4.

Images from two different healthy volunteers. The red dashed box shows the overlap between the two images. A is a single frame buffered dual spot image acquired with an effective A-scan rate of 400 kHz. B is a single unbuffered denoised frame. C is the result of rigid body registration and averaging of 20 individual unbuffered frames. A and B are from the same volunteer, and C is from a different volunteer.
In summary, we have reported on a dual spot SSOCT system design that enables simultaneous imaging of two spatially separate locations. This design uses both polarization and depth encoding to double the imaging speed of an SSOCT system all while using only one reference arm, one interferometer, one digitizer and one receiver. In addition, we have combined dual spot SSOCT with efficient sweep buffering to achieve a factor of 4 increase in the acquisition speed. Finally, this method can be used to efficiently quadruple the imaging speed of any SSOCT system employing a low duty-cycle laser that exhibits coherence revival.
Acknowledgments
We acknowledge financial support from the National Institutes of Health (NEI EY014743 and EY019411) and from the Fitzpatrick Foundation Scholar Award (DN). We also acknowledge technical support from Francesco LaRocca, Stephanie J. Chiu, Ryan McNabb, Justin Migacz, and Hansford Hendargo.
References
- 1.Hitzenberger CK. Investig Ophthalmol Vis Sci. 1991;32:616. [PubMed] [Google Scholar]
- 2.Baumgartner A, Hitzenberger CK, Sattmann H, Drexler W, Fercher AF. J Biomed Opt. 1998;3:45. doi: 10.1117/1.429861. [DOI] [PubMed] [Google Scholar]
- 3.Leung MKK, Mariampillai A, Standish BA, Lee KKC, Munce NR, Vitkin IA, Yang VXD. Opt Lett. 2009;34:2814. doi: 10.1364/OL.34.002814. [DOI] [PubMed] [Google Scholar]
- 4.Wieser W, Biedermann BR, Klein T, Eigenwillig CM, Huber R. Opt Express. 2010;18:14685. doi: 10.1364/OE.18.014685. [DOI] [PubMed] [Google Scholar]
- 5.Potsaid B, Baumann B, Huang D, Barry S, Cable AE, Schuman JS, Duker JS, Fujimoto JG. Opt Express. 2010;18:20029. doi: 10.1364/OE.18.020029. [DOI] [PMC free article] [PubMed] [Google Scholar]
- 6.Dhalla AH, Nankivil D, Izatt JA. Biomed Opt Express. 2012;3:633. doi: 10.1364/BOE.3.000633. [DOI] [PMC free article] [PubMed] [Google Scholar]
- 7.Dhalla AH, Nankivil D, Bustamante T, Kuo A, Izatt JA. Opt Lett. 2012;37:1883. doi: 10.1364/OL.37.001883. [DOI] [PMC free article] [PubMed] [Google Scholar]
- 8.Dhalla AH, Shia K, Izatt JA. Biomed Opt Express. 2012;3:3054. doi: 10.1364/BOE.3.003054. [DOI] [PMC free article] [PubMed] [Google Scholar]
- 9.Laser Institute of America. ANSI Z136.1–2007. American National Standards Institute; 2007. American national standard for safe use of lasers. [Google Scholar]
- 10.Goncharov AV, Dainty C. J Opt Soc Am A. 2007;24:2157. doi: 10.1364/josaa.24.002157. [DOI] [PubMed] [Google Scholar]
- 11.Estrada R, Tomasi C, Cabrera MT, Wallace DK, Freedman SF, Farsiu S. Biomed Opt Express. 2011;2:2871. doi: 10.1364/BOE.2.002871. [DOI] [PMC free article] [PubMed] [Google Scholar]
- 12.Chiu SJ, Li XT, Nicholas P, Toth CA, Izatt JA, Farsiu S. Opt Express. 2010;18:19413. doi: 10.1364/OE.18.019413. [DOI] [PMC free article] [PubMed] [Google Scholar]
- 13.Dabov K, Foi A, Katkovnik V, Egiazarian K. IEEE Trans Image Process. 2007;16:2080. doi: 10.1109/tip.2007.901238. [DOI] [PubMed] [Google Scholar]


