Abstract
We describe a remote focal scanning technique for optical projection tomography (OPT) implemented with an electrically tunable lens (ETL) that removes the need to scan the specimen or objective lens. Using a 4× objective lens the average spatial resolution is improved by ∼46% and the light collection efficiency by a factor of ∼6.76, thereby enabling increased acquisition speed and reduced light dose. This convenient implementation is particularly appropriate for lower magnifications and larger sample diameters where axial objective scanning would encounter problems with speed and stability.
OCIS codes: (170.6900) Three-dimensional microscopy, (170.6960) Tomography
1. Introduction
Biological and biomedical research is becoming ever more reliant on imaging capabilities, which have progressed from facilitating studies of mono-layers of cells on glass to in situ measurements of three-dimensional (3-D) biological systems, for which there is an increasing demand to map structural and functional information. For samples such as small animals, embryos and engineered tissue in the mesoscopic (∼1 – 10 mm) regime, a variety of imaging techniques have been developed including optical projection tomography (OPT) [1], scanning laser optical tomography (SLOT) [2] and light sheet microscopy (e.g. selective plane illumination microscopy (SPIM) [3], ultramicroscopy [4] and oblique plane microscopy [5]).
OPT, also known as optical computed tomography (optical CT) [6], enables imaging of mesoscopic samples with isotropic resolution, providing 3-D mapping of absorption and/or fluorescence parameters in optically transparent specimens, which is valuable for the research of whole specimen and individual organ morphology. It has been employed to image a wide variety of fixed whole organisms or isolated tissues which have been rendered transparent by chemical clearing, e.g. mouse embryos [1, 7], adult mouse brain [8], chick limb [9] and human embryonic brain [10, 11]. It has important applications for morphology and histopathology-based research as a convenient non-invasive 3-D imaging technique, especially in the growing field of mouse models of disease. For example OPT has been employed in numerous studies as a tool to localise and measure the beta cell mass in whole murine pancreata [12–14]. Such phenotypic measurements are perquisites for interpretation of biomedical results in diabetes research.
OPT has also been extended into the field of live imaging on intrinsically more transparent samples, e.g. C. elegans [15], D. melanogaster [16] and D. rerio [17, 18]. Practical realisations of OPT are diverse and can be adapted to a wide range of sample sizes, from individual cells to whole organisms.
In contrast to optical sectioning techniques that aim to minimise the depth of field (DOF) within a sample to achieve axial resolution, OPT provides high resolution 3-D reconstructions of the in focus sample and so requires the entire sample to be within the DOF of the imaging system. The individual images acquired as raw data do not, therefore, provide depth information. Rather, OPT relies on the acquisition of multiple images of the sample from different projection angles that are combined using mathematical algorithms (e.g. filtered back-projection (FBP)) to computationally reconstruct stacks of cross-sectional images.
Confining the volume to be imaged within the DOF of the imaging system provides an approximation to parallel beam projection within the constraints of diffraction. This results in a trade-off between sample size and the spatial resolution achievable in OPT because the resolution improves proportionally with the numerical aperture (NA) - in the diffraction limited case - while the DOF scales inversely with the square of the NA. In many standard OPT systems this trade-off is mitigated by arranging for the DOF to extend through half of the sample, i.e. by locating the focal plane a quarter of the way into the sample rather than at the axis of rotation. Thus the front half of the sample is in focus (imaged under the parallel beam approximation) and so the entire sample is adequately imaged during the course of a full rotation.
For larger specimens, this approach can be extended by introducing an angular multiplexing technique [19] that employs multiple imaging systems of higher NA in parallel, focussed at different planes within the sample. Although this multiplexed approach to OPT improves the achievable resolution and light collection efficiency, it entails the additional cost and complexity of multiple imaging systems and image registration. A conceptually simpler approach to realise higher resolution OPT for a given sample volume is to increase the NA of the objective lens while maintaining an effective DOF that extends throughout the sample by axially scanning the objective lens, and therefore the focal plane, during the OPT acquisition. This pseudo-projection approach can provide a significant resolution improvement for OPT using only a single imaging channel and has been implemented for microscopic samples (∼hundreds of μm) [20, 21]. It is less attractive in the mesoscopic regime, however, due to the increased focal scanning distances required (∼mm) and the concomitant issues of scanning speed and stability. These challenges can be addressed, however, by utilising an electronically tunable lens (ETL) to scan the focal plane. This can be conveniently implemented via remote focusing using an optical relay system and an ETL, as indicated in Fig. 1. Remote focusing has previously been demonstrated for focal plane scanning in SPIM [22], confocal microscopy [23] and oblique back-illumination microscopy [24].
Fig. 1.

Schematic of RFS-OPT setup. O – 4× objective lens, AP – aperture, TL – 200 mm focal length tube lens, R1 – 100 mm focal length relay lens, OL – −100 mm focal length offset lens, ETL – electrically tunable lens, R2 – 100 mm focal length relay lens, EF –emission filter, ϕ – sample diameter.
Here we report a remote focal scanning (RFS) OPT system using an ETL that permits the NA to be increased compared to the standard OPT configuration and therefore provides improved light collection efficiency and resolution providing that the image transmitted by the higher NA objective lens can be adequately sampled by the detector, i.e. the detector pixels are less than half the width of the magnified point spread function (PSF). This convenient implementation is particularly appropriate for larger samples imaged at lower magnifications where axial objective scanning would encounter problems with speed and stability.
2. Imaging system
For the RFS-OPT experimental configuration depicted in Fig. 1, the sample was mounted under a rotation stage (UE34CC, Newport Corp) and suspended in a refractive-index-matched environment. Wide-field excitation was provided by a spectrally filtered ultrafast fibre-laser-pumped super-continuum source (WL-SC-400-6, Fianium Ltd) incorporating a rotating diffuser to remove speckle in the recorded images. Sample fluorescence was relayed onto a CCD camera (Clara, Andor Technology plc, 1040×1392, 6.45 μm pixel size, cooled to −20 °C) using a 4× imaging system (O: 4× Nikon Plan Fluorite Imaging Objective, TL: 200 mm focal length tube lens) and a relay system with remote focusing (R1: 100 mm achromatic doublet lens, R2: 100 mm achromatic doublet lens; OL:−100 mm focal length offset lens for ETL) via appropriate emission filters. The ETL (EL-10-30-VIS-LD, Optotune) was placed between two relay lenses in a conjugate plane of the back focal plane of the objective lens. Because the ETL is a liquid lens that is required to be mounted horizontally, two turning prism mirrors were included to steer the light through the ETL in a horizontal orientation (not shown in Fig. 1). The precise alignment of the ETL relay ensures that the magnification of the imaging system is independent of the ETL’s focal length and therefore remains constant [22]. An appropriate aperture (AP) positioned directly behind the objective was used to adjust the effective collection NA of the system. The field of view of the system was 1.67 × 2.24 mm2.
3. Materials and methods
OPT is based on the wide-field acquisition of a series of 2-D absorption/fluorescence images at different projection angles. In the standard OPT, since the trade-off between sample size and achievable spatial resolution is mitigated by locating the focal plane a quarter of the way into the sample and arranging for the DOF to extend through half of the sample, images acquired of opposing views of the specimen are actually focused on different regions. Consequently, an image from one direction is not an exact mirror image of a view from the opposing direction and thus does not contain the same information. Therefore, it is necessary to acquire angular projections over a full rotation, i.e. 360°, to achieve a high-quality reconstruction. This is not the case for RFS-OPT since the focal plane can be scanned through the full axial extent of the specimen and therefore only requires 180° rotation to enable a complete reconstruction, as is the case for X-ray CT, representing a 50% reduction in the total acquisition time and light exposure of the sample if all other acquisition parameters are kept the same.
A cylindrical phantom of 0.8 mm diameter comprising a low concentration suspension of fluorescent beads in 1% agarose, with an average bead diameter of 1.1 μm and excitation/emission maxima of 540/560 nm respectively (F8820, Life Technologies Ltd), was used as model sample. This was suspended in a water-filled cuvette and imaged using 520±17.5 nm excitation and 562±20 nm emission filters. For comparison, images for the bead phantom were acquired by the CCD at equal angular intervals of 1° as the sample rotated 180° for the RFS-OPT and over 360° for the standard OPT, with 3 s camera integration time for both systems. Image data was acquired with an NA of 0.05 for the standard OPT system (i.e. fixed focal plane), producing a DOF of 0.34 mm, and with an NA of 0.13, i.e. the full NA of the objective, for RFS-OPT with the focal plane scanned over 1 mm at 10 Hz. For the standard OPT system, the focal plane was located 0.25 mm from the axis of rotation. The subsequent reconstruction was performed using a FBP algorithm.
4. Results and discussions
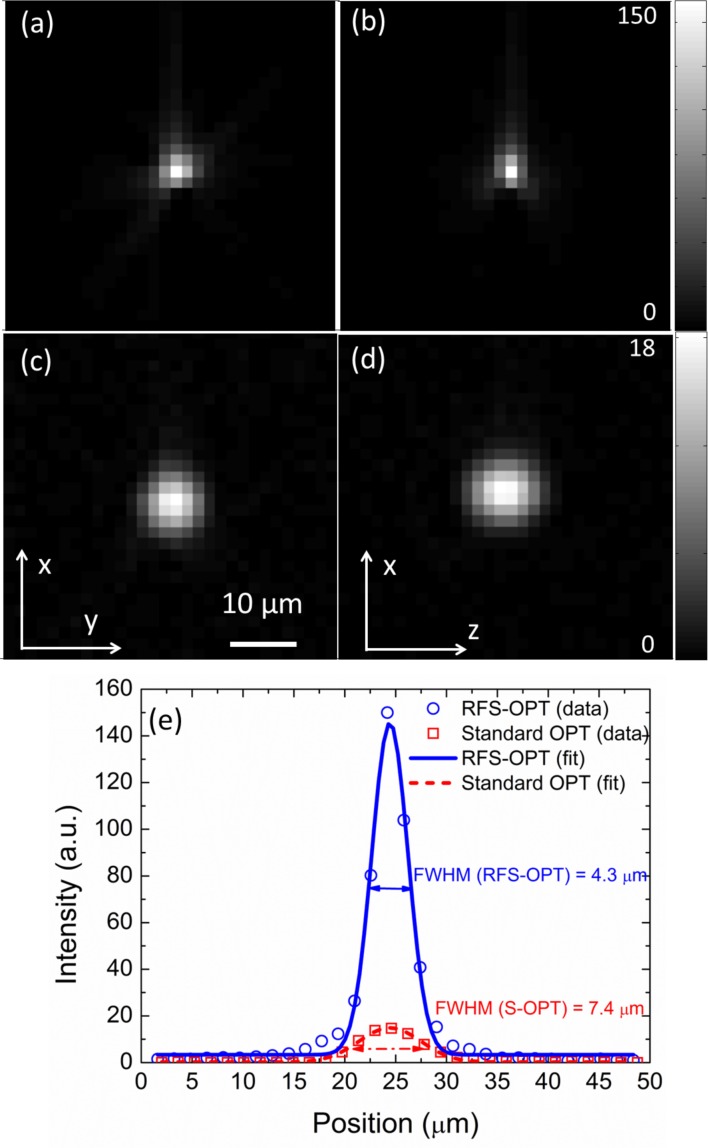
The reconstruction process produces a stack of cross-sectional images of the sample from the projection data. Figure 2(a–d) shows the reconstructed images of a bead located 0.33 mm from the rotation axis. Since the beads are smaller than the optical resolution, these reconstructed images indicate the resolution of the respective OPT systems. The resolution improvement of RFS-OPT system is confirmed by the line-sections through the bead centre, shown in Fig. 2(e), with accompanying Gaussian fits providing full width half maxima (FWHM) of 4.3 μm and 7.4 μm for RFS-OPT and standard OPT systems respectively. Fig. 2 also highlights the significant (∼8× increase) improvement in signal-to-background ratio that results from both the ∼6.76× increase in light collection efficiency of RFS-OPT (given by the ratio of the square of the NAs) and from the improved resolution.
Fig. 2.
Reconstructed X–Y and X–Z image slices of a bead acquired with RFS-OPT (a, b) and standard OPT (c, d). (e) Line plots and Gaussian fits through the Y axis of the reconstructed bead in (a,c) for the standard OPT (red line) and RFS-OPT (blue line) systems showing relative intensity data. Scale bar: 10 μm.
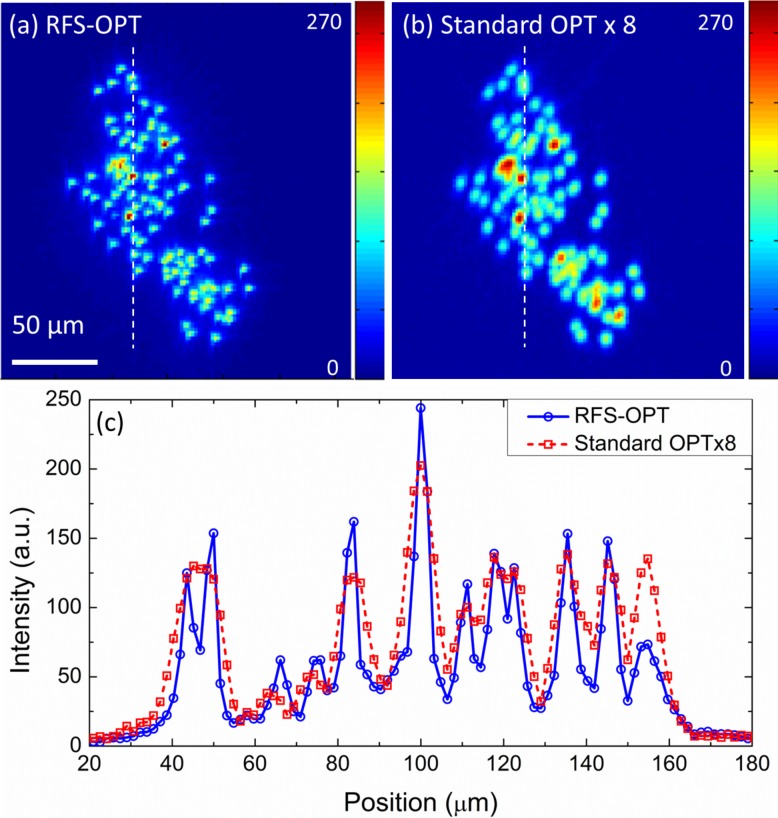
Figure 3(a) and 3(b) (Media 1 (437.2KB, AVI) ) show maximum intensity projections (MIPs) of a volume containing a higher concentration of beads that were reconstructed from data acquired using the RFS-OPT and standard OPT systems. The line-sections in Fig. 3(c) show how RFS-OPT can better resolve closely spaced beads. It is noted that the standard OPT intensity data has been multiplied by 8 for clarity. The images of a number of beads at different distances from the axis of rotation were analysed and their measured average FWHM in the RFS-OPT and standard OPT systems were 4.2±0.6 μm and 7.8±1.1 μm respectively, showing a ∼46% improvement for RFS-OPT. The theoretical diffraction limited resolutions at best focus, given by the FWHM of the convolution of the PSF with a 1.1 μm diameter object, were 2.7 μm and 6.0 μm for NA values of 0.13 and 0.05 respectively. The resolution for the RFS-OPT system did not reach the diffraction limit in this case because the combination of magnification (×4) and CCD pixel size (6.5 μm) did not sample the PSF sufficiently for the increased NA. Nevertheless, we have demonstrated here a significant improvement in image resolution and signal-to-background ratio that can be further improved using higher resolution imaging detectors.
Fig. 3.
Reconstructed maximum intensity projection images and video ( Media 1 (437.2KB, AVI) ) of dense bead phantom acquired with (a) RFS and (b) standard OPT plotted for comparison with absolute intensity scales; (c) Intensity line profiles from figures (a, b) as dash lines indicated. It is noted that the standard OPT intensity data has been multiplied by 8 for clarity. Scale bar: 50 μm.
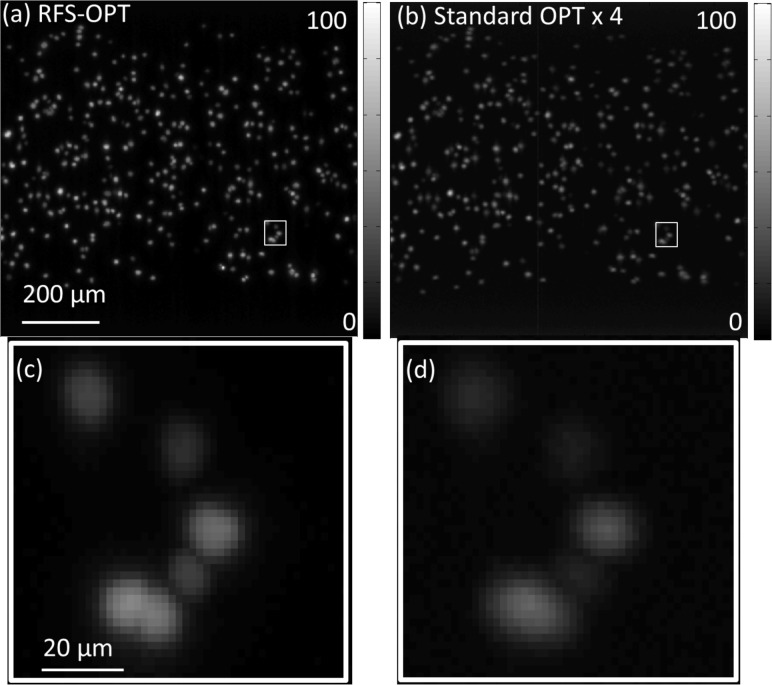
To further illustrate the potential of this RFS-OPT system, clusters of HeLa cells expressing mCherry fluorescent proteins in the nucleus (on histone H2B in the chromatin) were imaged. These cells were embedded in 1% agarose and then drawn into translucent FEP tubing (06406-60, Cole-Palmer). This tubing was suspended in a water-filled cuvette and imaged using a 562±20 nm excitation and 641±37.5 nm emission filter. Image data was acquired with the same acquisition parameters as before, but with a camera integration time of 2.5 s for both systems. Figure 4(a) and 4(b) show regions of the MIPs of the 3-D reconstruction from the RFS-OPT and standard OPT systems respectively, with 4(c) and 4(d) showing expanded regions of interest where neighboring cells are resolved by RFS-OPT but not by the standard OPT system. These figures illustrate the significant improvement in the signal level and contrast for the RFS-OPT system.
Fig. 4.
A section of reconstructed maximum intensity projection images of clusters of cells that exhibit mCherry labelling in the nucleus acquired with (a) RFS-OPT and (b) standard OPT plotted with absolute intensity scales for comparison; Zoom in MIPs of regions of interest of (c) RFS-OPT and (d) Standard OPT (rectangular boxes in (a,b)). It is noted that the standard OPT intensity data has been multiplied by 4 for clarity. Scale bar: (a, b) 200 μm; (c,d) 20 μm.
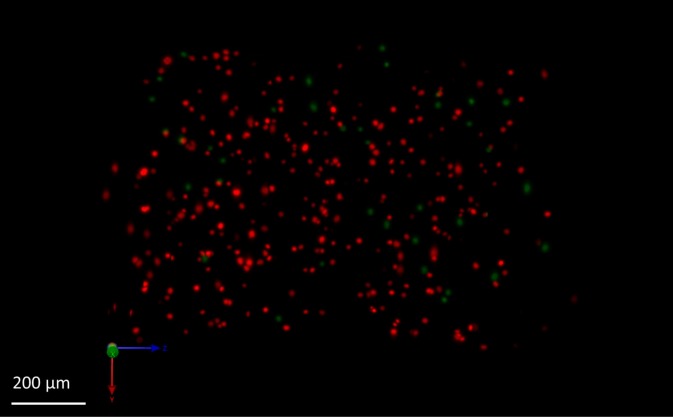
The 3-D reconstructions were also characterized using the software package Volocity (PerkinElmer Inc), using a 15% maximum intensity threshold and a built in function to identify objects (i.e. nuclei). From the same 3-D volume, 307 objects with an average signal of 24.4 a.u. were extracted in RFS-OPT while only 285 objects with an average signal of 5.2 a.u. were extracted from the standard OPT acquisition, showing a 7% increase in the number of detected nuclei and an improvement of ∼4.3× in signal efficiency. Figure 5 ( Media 2 (1MB, AVI) ) shows a snapshot of the 3-D reconstruction from the RFS-OPT acquisition. Nuclei in red were identified in both standard and RFS-OPT systems, while nuclei in green were only identified using the RFS-OPT acquisition.
Fig. 5.
A snapshot of the 3-D reconstruction of a cell suspension that exhibits mCherry expression in the nucleus. Nuclei in red were identified in both standard and RFS-OPT systems, while nuclei in green were only identified using the RFS-OPT acquisition ( Media 2 (1MB, AVI) ). Scale bar: 200 μm.
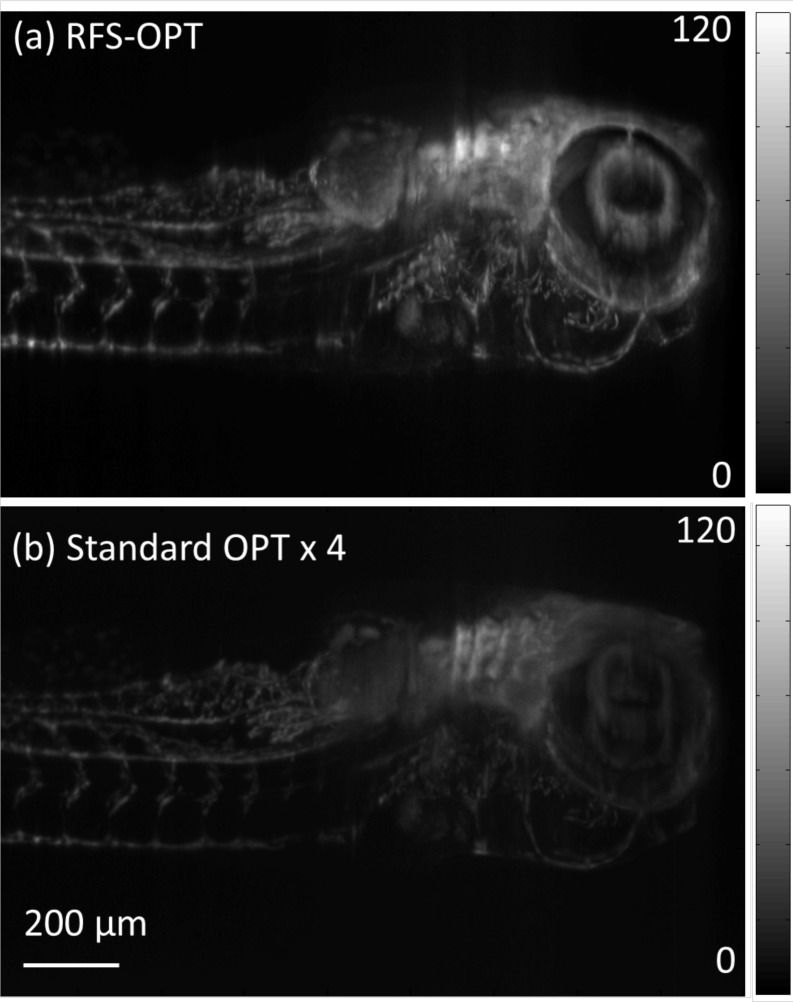
The bead and cell suspensions imaged above are sparse samples and as a result the integration time required was quite long (3 and 2.5 s respectively) since the signal summed along the optical axis was relatively low. One of the main applications of OPT is for imaging mesoscopic samples like small organisms, as described in the introduction. To demonstrate the benefits of RFS-OPT over the standard approach a live fluorescent Casper:Fli-GFP transgenic zebrafish was imaged at 4 days post-fertilisation by both systems at an integration time of 0.4 s, the significantly reduced integration time being due to the increased labelling density compared to the sparse bead samples. The fish embryo was anaesthetised and embedded in 1% low melt point agarose, made from embryo media, containing 0.3 mM MS-222 (Sigma) as an anesthetic. Agarose was added to increase the viscosity of the water and prevent movement of the anaesthetized embryo. It was then drawn into translucent FEP tubing and then suspended in a water-filled cuvette and imaged through a 470±20 nm excitation and 520±17.5 nm emission filter. Figure 6(a) and 6(b) show MIPs of the 3-D reconstruction from the RFS and the standard OPT systems respectively. For comparison they are displayed on the same intensity scale, where the standard OPT intensity data has been multiplied by 4 for clarity, illustrating the clear improvement in the signal-to-background ratio. It is noted that the improved imaging efficiency could also be used to reduce the total acquisition time by more than the factor of 2 provided by the reduced angular scan range for the RFS-OPT system to achieve a similar signal level to that of the standard approach with a proportional reduction in illumination dose.
Fig. 6.
A section of reconstructed maximum intensity projection images of a live fluorescent Casper:Fli-GFP transgenic zebrafish (at 4 days post-fertilisation) acquired with (a) RFS-OPT and (b) standard OPT plotted with absolute intensity scales for comparison. It is noted that the standard OPT intensity data has been multiplied by 4 for clarity. Scale bar: 200 μm.
5. Conclusion
In conclusion, we have demonstrated that a RFS-OPT system can be conveniently implemented with an ETL, which is particularly appropriate for imaging larger samples at lower magnification where axial objective scanning would encounter problems with speed and stability. Focal scanning enables imaging at an increased NA and therefore provides improved image resolution and light collection efficiency for OPT. This RFS-OPT system can be easily adapted to applications in the growing field whole organism/organ 3-D imaging, providing improved resolution and light collection efficiency. For example, it can be applied to image beta cell mass in the murine pancreas where the typical sample size is 1 cm and therefore requires low magnification and a long focal scanning range. Looking forward, it is possible to develop a low cost implementation using, for example, LED sources or laser diodes for excitation to achieve a high resolution 3-D mesoscopic imaging.
Acknowledgments
The authors gratefully acknowledge funding from the Medical Research Council (MRC, MR/K011561/1), the Wellcome Trust (Institutional Strategic Support Fund Networks of Excellence Award) and the European Foundation for the Study of Diabetes (EFSD). The authors also acknowledge Mayumi Isokane and Robert Mahen from EMBL Heidelberg for generating the cell line and Paul Frankel (Division of Medicine, University College London) for providing the Casper:Fli-GFP zebrafish line. Lingling Chen acknowledges a former Lee Family Scholarship. Douglas Kelly and Natalie Andrews acknowledge a studentship from the Institute of Chemical Biology EPSRC funded Doctoral Training Centre.
References and links
- 1.Sharpe J., Ahlgren U., Perry P., Hill B., Ross A., Hecksher-Sorensen J., Baldock R., Davidson D., “Optical projection tomography as a tool for 3D microscopy and gene expression studies,” Science 296, 541–545 (2002). 10.1126/science.1068206 [DOI] [PubMed] [Google Scholar]
- 2.Lorbeer R., Heidrich M., Lorbeer C., Ojeda D. F. R., Bicker G., Meyer H., Heisterkamp A., “Highly efficient 3D fluorescence microscopy with a scanning laser optical tomograph,” Opt. Express 19, 5419–5430 (2011). 10.1364/OE.19.005419 [DOI] [PubMed] [Google Scholar]
- 3.Huisken J., Swoger J., Del Bene F., Wittbrodt J., Stelzer E. H. K., “Optical sectioning deep inside live embryos by selective plane illumination microscopy,” Science 305, 1007–1009 (2004). 10.1126/science.1100035 [DOI] [PubMed] [Google Scholar]
- 4.Dodt H. U., Leischner U., Schierloh A., Jahrling N., Mauch C. P., Deininger K., Deussing J. M., Eder M., Zieglgansberger W., Becker K., “Ultramicroscopy: three-dimensional visualization of neuronal networks in the whole mouse brain,” Nat. Meth. 4, 331–336 (2007). 10.1038/nmeth1036 [DOI] [PubMed] [Google Scholar]
- 5.Dunsby C., “Optically sectioned imaging by oblique plane microscopy,” Opt. Express 16, 20306–20316 (2008). 10.1364/OE.16.020306 [DOI] [PubMed] [Google Scholar]
- 6.Krstajic N., Doran S. J., “Focusing optics of a parallel beam CCD optical tomography apparatus for 3D radiation gel dosimetry,” Phys. Med. Biol. 51, 2055–2075 (2006). 10.1088/0031-9155/51/8/007 [DOI] [PubMed] [Google Scholar]
- 7.Walls J.R., Coultas L., Rossant J., Henkelman R.M., “Three-dimensional analysis of vascular development in the mouse embryo,” PLoS ONE 3, e2853 (2008). 10.1371/journal.pone.0002853 [DOI] [PMC free article] [PubMed] [Google Scholar]
- 8.Gleave J.A., Wong M.D., Dazai J., Altaf M., Henkelman R.M., Lerch J.P., Nieman B.J., “Neuroanatomical phenotyping of the mouse brain with three-dimensional autofluorescence imaging,” Physiological Genomics 44, 778–785 (2012). 10.1152/physiolgenomics.00055.2012 [DOI] [PMC free article] [PubMed] [Google Scholar]
- 9.Fisher M.E., Clelland A.K., Bain A., Baldock R.A., Murphy P., Downie H., Tickle C., Davidson D.R., Buckland R.A., “Integrating technologies for comparing 3D gene expression domains in the developing chick limb,” Dev. Biol. 317, 13–23 (2008). 10.1016/j.ydbio.2008.01.031 [DOI] [PMC free article] [PubMed] [Google Scholar]
- 10.Kerwin J., Scott M., Sharpe J., Puelles L., Robson S.C., Martinez-de-la-Torre M., Ferran J.L., Feng G., Baldock R., Strachan T., Davidson D., Lindsay S., “3 dimensional modelling of early human brain development using optical projection tomography,” Bmc. Neurosci. 5, 27 (2004). 10.1186/1471-2202-5-27 [DOI] [PMC free article] [PubMed] [Google Scholar]
- 11.Lindsay S., Sarma S., Martnez-de-la-Torre M., Kerwin J., Scott M., Luis Ferran J., Baldock R., Puelles L., “Anatomical and gene expression mapping of the ventral pallium in a three-dimensional model of developing human brain,” Neuroscience 136, 625–632 (2005). 10.1016/j.neuroscience.2005.06.093 [DOI] [PubMed] [Google Scholar]
- 12.Alanentalo T., Loren C.E., Larefalk A., Sharpe J., Holmberg D., Ahlgren U., “High-resolution three-dimensional imaging of islet-infiltrate interactions based on optical projection tomography assessments of the intact adult mouse pancreas,” J. Biomed. Opt. 13, 054070 (2008). 10.1117/1.3000430 [DOI] [PubMed] [Google Scholar]
- 13.Alanentalo T., Hrnblad A., Mayans S., Karin Nilsson A., Sharpe J., Larefalk A., Ahlgren U., Holmberg D., “Quantification and three-dimensional imaging of the insulitis-induced destruction of beta-cells in murine type 1 diabetes,” Diabetes 59, 1756–1764 (2010). 10.2337/db09-1400 [DOI] [PMC free article] [PubMed] [Google Scholar]
- 14.da Silva Xavier G., Mondragon A., Sun G., Chen L., McGinty J., French P.M.W., Rutter G.A., “Abnormal glucose tolerance and insulin secretion in pancreas-specific Tcf7l2-null mice,” Diabetologia 55, 2667–2676 (2012). 10.1007/s00125-012-2600-7 [DOI] [PMC free article] [PubMed] [Google Scholar]
- 15.Birk U. J., Rieckher M., Konstantinides N., Darrell A., Sarasa-Renedo A., Meyer H., Tavernarakis N., Ripoll J., “Correction for specimen movement and rotation errors for in-vivo Optical Projection Tomography,” Biomed. Opt. Express 1, 87–96 (2010). 10.1364/BOE.1.000087 [DOI] [PMC free article] [PubMed] [Google Scholar]
- 16.Vinegoni C., Pitsouli C., Razansky D., Perrimon N., Ntziachristos V., “In vivo imaging of Drosophila melanogaster pupae with mesoscopic fluorescence tomography,” Nat. Methods, 5, 45–47 (2008). 10.1038/nmeth1149 [DOI] [PubMed] [Google Scholar]
- 17.McGinty J., Taylor H. B., Chen L., Bugeon L., Lamb J. R., Dallman M. J., French P. M. W., “In vivo fluorescence lifetime optical projection tomography,” Biomed. Opt. Express 2, 1340–1350 (2011). 10.1364/BOE.2.001340 [DOI] [PMC free article] [PubMed] [Google Scholar]
- 18.Bassi A., Fieramonti L., D’Andrea C., Mione M., Valentini G., “In vivo label-free three-dimensional imaging of zebrafish vasculature with optical projection tomography,” J. Biomed. Opt. 16, 100502 (2011). 10.1117/1.3640808 [DOI] [PubMed] [Google Scholar]
- 19.Chen L., Andrews N., Kumar S., Frankel P., McGinty J., French P. M. W., “Simultaneous angular multiplexing optical projection tomography at shifted focal planes,” Opt. Lett. 38, 851–853 (2013). 10.1364/OL.38.000851 [DOI] [PubMed] [Google Scholar]
- 20.Fauver M., Seibel E. J., Rahn J. R., Meyer M. G., Patten F. W., Neumann T., Nelson A. C., “Three-dimensional imaging of single isolated cell nuclei using optical projection tomography,” Opt. Express 13, 4210–4223 (2005). 10.1364/OPEX.13.004210 [DOI] [PubMed] [Google Scholar]
- 21.Miao Q., Hayenga J., Meyer M. G., Neumann T., Nelson A. C., Seibel E. J., “Resolution improvement in optical projection tomography by the focal scanning method,” Opt. Lett. 35, 3363–3365 (2010). 10.1364/OL.35.003363 [DOI] [PubMed] [Google Scholar]
- 22.Fahrbach F. O., Voigt F. F., Schmid B., Helmchen F., Huisken J., “Rapid 3D light-sheet microscopy with a tunable lens,” Opt. Express 21, 21010–21026 (2013). 10.1364/OE.21.021010 [DOI] [PubMed] [Google Scholar]
- 23.Jabbour J. M., Malik B. H., Olsovsky C., Cuenca R., Cheng S., Jo J. A., Cheng Y.-S. L., Wright J. M., Maitland K. C., “Optical axial scanning in confocal microscopy using an electrically tunable lens,” Biomed. Opt. Express 5, 645–652 (2014). 10.1364/BOE.5.000645 [DOI] [PMC free article] [PubMed] [Google Scholar]
- 24.Giese J. D., Ford T. N., Mertz J., “Fast volumetric phase-gradient imaging in thick samples,” Opt. Express 22, 1152–1162 (2014). 10.1364/OE.22.001152 [DOI] [PMC free article] [PubMed] [Google Scholar]


