Abstract
Although hemoglobin oxygen saturation (sO2) in the microvasculature is an essential physiological parameter of local tissue functions, non-invasive measurement of microvascular sO2 is still challenging. Here, we demonstrated that visible-light optical coherence tomography (vis-OCT) can simultaneously provide three-dimensional anatomical tissue morphology, visualize microvasculature at the capillary level, and measure sO2 from the microvasculature in vivo. We utilized speckle contrast caused by the moving blood cells to enhance microvascular imaging. We applied a series of short-time inverse Fourier transforms to obtain the spectroscopic profile of blood optical attenuation, from which we quantified sO2. We validated the sO2 measurement in mouse ears in vivo through hypoxia and hyperoxia challenges. We further demonstrated that vis-OCT can continuously monitor dynamic changes of microvascular sO2.
OCIS codes: (170.4500) Optical coherence tomography, (300.1030) Absorption
1. Introduction
Hemoglobin oxygen saturation (sO2) in the microvasculature is an essential physiological parameter governing the interplay between the blood supply and local tissue functionality. Oxygen diffuses from the capillary network to metabolize tissues so that microvascular sO2 directly determines the oxygenation level and functions of local tissue. In turn, the oxygen demand from local tissue can remodel the microvasculature, such as triggering angiogenesis through oxygen-sensitive signaling pathways [1]. Such interplay is one of the most fundamental relationships in biology and medicine, and is a pivotal facet in the progression of many diseases, including cancer and diabetes [2]. Given its great importance, it is still challenging to provide a non-invasive measurement of local sO2 from microvasculature. The blood-oxygen-level dependent (BOLD) contrast imaging method in functional magnetic imaging (fMRI) has been reported to measure sO2 [3]. However, fMRI is limited to millimeter-level resolution, which prevents it from probing the microvasculature. Two-photon phosphoresce and fluorescence lifetime measurement can image the microvasculature and quantify local oxygen partial pressure in vivo, with the help of an oxygen-sensitive contrast agent [4]. Hyperspectal imaging was also employed to measure sO2 [5, 6]. However, the lack of depth resolution makes the technique susceptible to many confounding factors, such as the surface reflection and diffusive light, which impeded its accurate sO2 measurement. Photoacoustic microscopy (PAM) has been developed to quantify sO2 from microvasculature [7–10], which is considered the most powerful label-free sO2 imaging technology so far. The challenge, however, is that PAM requires temporal switching of the excitation optical wavelength (i.e. either by using two lasers or a tunable laser) to obtain spectral information, and also requires constant physical contact between its ultrasonic detector and the objects.
Optical coherence tomography (OCT) is another promising technique to quantify microvascular sO2 in vivo. The spectroscopic information can be obtained simultaneously with the structural map by using a wideband, low coherence light source. Thus, the distinct spectral contrast from oxygenated and deoxygenated hemoglobin (Hb) can be utilized to deduce sO2. Several groups have demonstrated that the wavelength dependence of scattering coefficient correlated with sO2 within the near infrared (NIR) spectral range [11–14]. The photothermal effect of Hb has also been explored to measure sO2 [15, 16]. Recently, visible-light OCT (vis-OCT) has been implemented to quantify sO2 in vivo [17, 18]. The strong absorption contrast of hemoglobin from 540 nm to 580 nm greatly enhances the measurement sensitivity. However, the measurement has not been applied in microvasculature because the scattering background overwhelms the absorption contrast from the small vessels. Furthermore, the measurement relies on additional image segmentation methods to isolate the blood vessels from the surrounding tissue.
In this paper, we present a comprehensive method to overcome the above challenges and non-invasively measure local sO2 from the microvasculature. The method first utilized the dynamic speckle contrast to enhance the microvasculature, which has been previously demonstrated in various NIR OCT systems [19–23]. The enhanced signal from the microvasculature allows us to apply a spectroscopic analysis on the visible light spectral range to measure sO2. Cellular level anatomical morphology, microvasculature down to single capillary level, and functional sO2 map can be simultaneously obtained. We demonstrated that the method can measure static sO2 and monitor dynamic sO2 changes in vivo.
2. Methods
2.1 System implementation
The vis-OCT system used a Fourier domain configuration (Fig. 1). A supercontinuum laser (NKT photonics) provided a broadband illumination. The laser was delivered by an optical fiber, collimated by a lens, and input into a cube beam splitter (BS; CM1-BS013, Thorlabs), by which the light was divided into a sample arm and a reference arm. The reference arm consisted of a series of glass plates for dispersion control and a reflecting mirror. The sample arm consisted of a beam expander, a two-dimensional scanning mirror system, and an objective lens to focus the light onto the samples. A home-made spectrometer collected the interference spectrum from 520 nm to 630 nm by a CMOS line scan camera (spL2048-140km, Basler). The transverse and axial resolutions were estimated as 7 μm and 1.3 μm, respectively.
Fig. 1.
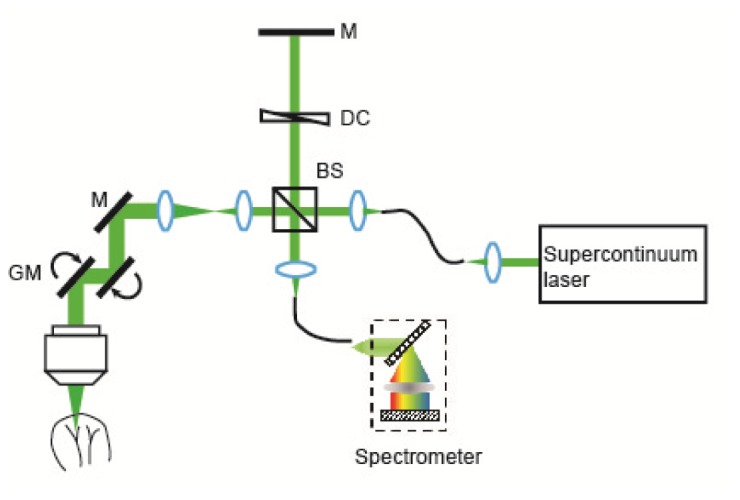
A schematic of the experimental setup. A supercontinuum laser was used as the light source in an open space Michelson interferometer. A home-made spectrometer was used to collect the interference spectrum for imaging. M: mirror; DC: dispersion compensation; BS: beam splitter; GM: galvanometer mirrors.
For functional microangiography, the following scanning protocol was used. In the fast scanning axis, each B-scan images consisted of 512 A-lines, covering ~1.6 mm length. A saw tooth scanning pattern with 66% duty circle was used. In the slow scanning axis, 1024 B-scan images were acquired to cover ~1.6 mm range. Every other pair of B-scans was acquired at the same cross-sectional location so that the 512 B-scans of microangiography can be obtained by post-processing. The acquisition speed of the camera was set to be 50k A-line per second, which yield a ~30 ms time interval between two adjacent B-scans. The entire imaging took 15.7 s to complete.
2.2 Data processing
Several preprocessing steps were first performed on the raw spectra, including normalizing the raw spectra by the light source spectrum, removing the DC spectral component, λ-k resampling, and digital dispersion compensation [24]. Then, wavelength-dependent B-scan images were obtained by a short-time inverse Fourier transform (STFT) with a sweeping Gaussian spectral window [18, 25]. The FWHM of the Gaussian window was kw = 0.29 µm−1, which is around 15 nm at 570 nm. The corresponding axial resolution for each narrow band reconstruction was estimated as ~6.9 μm in tissue.
After STFT, we obtained the complex values of two subsequent B-scans acquired at the same cross-sectional position A(x, z, t0, λc) and A(x, z, t1, λc), where x and z are the lateral and depth coordinates of the B-scan image; λc is the central wavelength of the Gaussian spectral window; t0 and t1 denotes the timestamps of two consecutive B-scan images. To correct the motion artifacts, we calculated the axial global phase fluctuations [26]
| (1) |
The phase fluctuation was then corrected by
| (2) |
To obtain the speckle contrast from the microvasculature, we next took the absolute values of the difference between two B-scans [19]
| (3) |
We iterated the above three-step process on all 512 cross-sectional locations along the y axis, performed a three-dimensional (3D) 3 by 3 median filter, and generated the 3D wavelength dependent microangiography I(x, y, z, λc). To display the angiogram, we summed the first 15 pixels of the maximum values along z direction as I(x, y, λc).
To deduce sO2, we used 3D angiographic images I(x, y, z, λc) centered at four wavelengths: 562.8 nm, 566.9 nm, 571.0 nm, and 575.3 nm. We took logarithmic values of I(x, y, z, λc), and then integrated the first 15 pixels of the maximum values (corresponding to ~10 μm in depth) along z direction as. The first derivatives of the resultant spectra S(x, y, λc) were calculated to correlate sO2. The derivative of the average spectrum from a nonvascular area was subtracted to eliminate systemic error.
2.3 Animal preparation
All the experimental procedures are approved by the Northwestern University IACUC. Nude mice were first anesthetized by 2.5% isoflurane with 3.0 Standard Liter per Minute (SLPM) air mixed with 20% oxygen and 80% nitrogen for 5 minutes. After the initial anesthesia, the animals were transferred to a home-made imaging stage and anesthetized by 1.5% Isoflurane with 1.5 SLPM air. The mouse ears were flattened and attached to an image plate. A droplet of glycerol was topically used to reduce the reflection of the skin surface. A heating pad was used to maintain the animals’ body temperature, and a pulse oximeter was attached to the left rear leg to monitor the heart rate and systemic arterial sO2 (spO2).
3. Result
Our method is illustrated in Fig. 2. Figure 2(a) shows a typical cross-sectional B-scan image from a mouse ear in vivo using the vis-OCT. The anatomical features such as epidermis, dermis, and cartridge were accurately reconstructed. The same cross-sectional location was scanned twice with a 30-ms delay, and the speckle contrast from the two subsequent B-scan images created an angiography. By using STFT, wavelength-dependent angiography I(x, y, z, λc) can be obtained. Figure 2(b) shows a cross-sectional I(x, z, λc) from a sub-band reconstruction centered at 602 nm. The static tissue signal was largely subtracted, leaving the contrast only from the moving blood cells. At different wavelengths, the enhancement provided by the contrast can be observed from an arteriole and a venule (Fig. 2(c)). Because of the distinct extinction spectra from oxygenated and deoxygenated hemoglobin, the arterial and venous contrast had different spectroscopic feature, which is utilized to quantify sO2 (Fig. 2(d)).
Fig. 2.
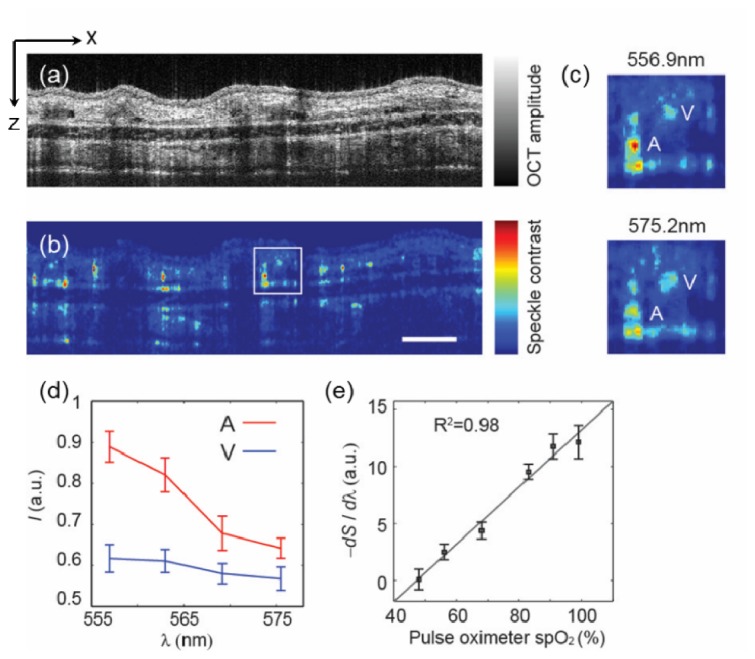
(a-b) Examples of OCT cross-sectional images and microangraphies from a mouse ear in vivo. The cross-sectional angiography was obtained from a wavelength band centered at 602 nm with 15 nm FWHM. Bar: 0.2 mm. (c) Magnified view of the squared area in panel b at two different center wavelengths. An arteriole (A) and a venule (V) were labeled. (d) The spectral profiles from the arteriole and venule in panel c. (e) Calibration of the first derivative of the spectra to the spO2 reading from a pulse oximeter attached to the rear left leg of the animal. The OCT spectra were sampled from an arteriole. Error bar is the standard error of mean (s.e.m.) (n = 20 indicates 20 repeated measurements at same locations)
3.1 Calibration
To demonstrate how we can deduce sO2 from the spectroscopic feature, we used a simple static model to express the OCT signal attenuation by the blood,
| (4) |
where I0(λ) is the light source spectrum; μt,HbO and μt,Hb (cm−1) are the total extinction coefficient of the oxygenated and deoxygenated blood, respectively; z is the penetration depth in blood, r denotes the reflectance of the blood. Over the chosen wavelength range, we consider r is a constant. By taking logarithmic values of IOCT(z, λ) and integrating the signals along the depth, it can be rewritten as
| (5) |
where L (μm) is the penetration depth in blood. Because of the three-dimensional imaging capability, L is a geometric length that is independent of the optical properties or the wavelength range. We then can take the first derivative of the above equation
| (6) |
where a linear relationship between the first derivative of the spectrum and sO2 is established.
To verify the linear dependence, an in vivo calibration experiment was performed on nude mice ears. The inhalation gas is a mixture of O2 and N2 whose relative concentrations were adjusted by a gas proportioner. A pulse oximeter was attached to the rear left leg of the animal to provide systemic arterial sO2 (spO2) measurements. We then reduced the O2 content gradually, and allowed the animals to stabilize for ~3mins after each O2 reduction. At each gas condition, we acquired OCT microangiography, calculated the first derivative of the spectra from an arterial vessel, and compared to the spO2 readings (Fig. 2(e)). The linear correlation was evidenced by a linear regression with R2 = 0.98. We then further used this calibration curve to deduce sO2 from the spectral profiles in the following experiments.
3.2 Simultaneous tissue microanatomy, microvascular, and local sO2 imaging
Being able to quantify sO2 allows OCT to provide functional microangiography, aside from just anatomical structures. Figure 3(a) shows an en face map along the x-y plane through mean-intensity-projection along the z-axis on the conventional OCT 3D images from a mouse ear in vivo. We could clearly visualize the sebaceous glands on the mouse ear skin as dark, round structures, as well as an unremoved hair in the periphery of the mouse ear. By taking the speckle contrast, the detailed microvasculature was enhanced (Fig. 3(b)). We zoomed in a small region of interest (ROI) and overlaid the anatomical and microvascular maps (Fig. 3(c)). We could see the capillary network surrounding a sebaceous gland, providing nutrient and oxygen (black arrow in Fig. 3(c)). Furthermore, the functional map of microvascular sO2 could be visualized using a pseudo-color mapping (Fig. 3(d)). The arterioles and venules could be well separated based on their measured sO2 values. Some discontinuities in the map are due to the obstruction by the sebaceous glands. We plotted the histogram of the sO2 values from two highlighted areas in Fig. 3(d). The mean values of sO2 from artery and vein were 91.3% and 60.7%, respectively.
Fig. 3.
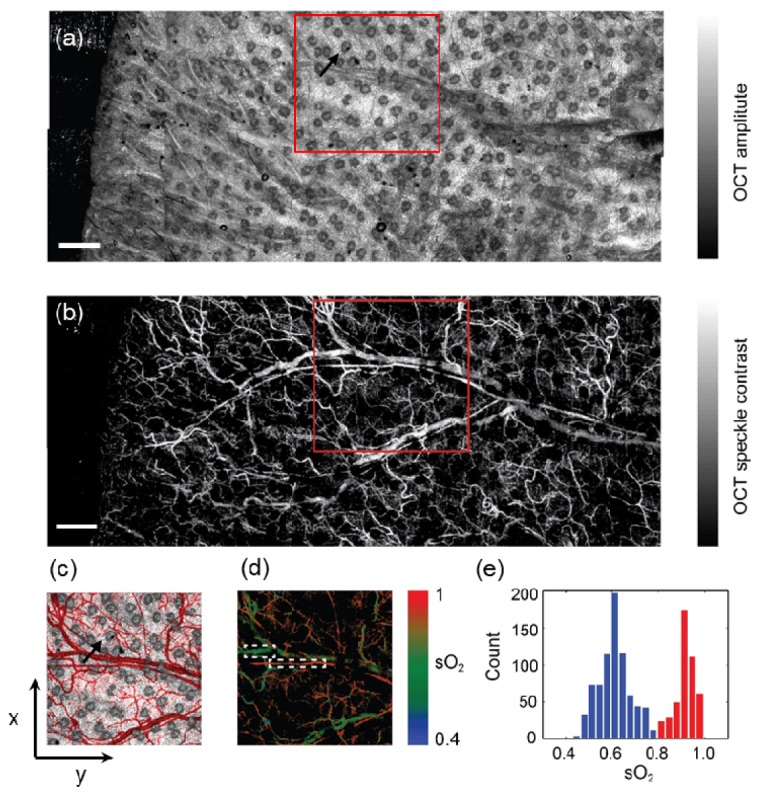
(a-b) Mean-value-projection images of the 3D OCT mosaic and the label-free microangiography from a mouse ear in vivo, where ten images were stitched. The black arrow in panel a highlights a sebaceous gland. Bar: 0.5mm. (c) Pseudo-colored overlay image of the highlighted areas in the panel a and panel b within the squares. The microvasculature is pseudo-colored in red. The black arrow highlights the same sebaceous gland as in the panel a and its surrounding vasculatures. (d) Functional microangiography with color-coded sO2 values. The colormap was created in HSV color space, where Hue was coded by the sO2 as the color bar, Saturation and Value are coded by the intensity of the microangiography. (e) Histogram of sO2 calculated from the selected arteriole and vein in panel d.
3.3 Static and dynamic sO2 monitor from microvasculature
To further demonstrate the capability of measuring microvascular sO2, we performed a static hypoxia-hyperoxia challenge. First, we mixed the inhalation gas with 1:9 oxygen/nitrogen ratio to introduce systemic hypoxia, increased the ratio to 2:8 as normoxia, and finally to 10:0 as hyperoxia. At each stage, the spO2 was monitored by a pulse oximeter, and the animal was stabilized for ~3 minutes. The functional microangiography under hypoxia is shown in Fig. 4(a). We selected ROIs over the microvasculature, an arteriole and a venule to quantify sO2. The sO2 statistics from three regions are plotted in Fig. 4(b). Because of the systemic hypoxia, the sO2 was suppressed over the entire vascular system (48.2 ± 4.8%, 36.4 ± 5.8% and 23.8 ± 4.6% from the arteriole, microvasculature and venule, respectively). Moreover, the sO2 in the microvasculature fell between the arteriole and venule. At the normoxia stage, the corresponding sO2 from three regions raised to 86.9 ± 4.1%, 58.2 ± 6.3% and 50.1 ± 6.3% respectively. At the hyperoxia stage, a change in the arteriole is not obvious because arterial blood was already oxygenated in normoxia. We still observed small increase of sO2 from the microvasculature and vein (87.1 ± 5.5%, 60.9 ± 6.4% and 58.8 ± 5.0% from the arteriole, microvasculature and vein, respectively).Next, we performed a transient hypoxia challenge to monitor the dynamic variations in sO2. We scanned the same cross-sectional location continuously. After acquiring images for 10 s, we stopped the O2 supply for about 15 s and recovered the O2 supply thereafter. Figure 5(a) shows the sampled cross-sectional location from the entire field of imaged microvasculature. The spO2 from the pulse oximeter showed the systemic sO2 response to the transient challenge (Fig. 5(b)). We selected four small blood vessels (two arterioles and two venules), and plotted their relative sO2 changes subjected to the O2 supply challenge. The average sO2 change corresponded to the spO2 curve very well, where the minimum sO2 appears at around 31 s during the course of the experiment.
Fig. 4.
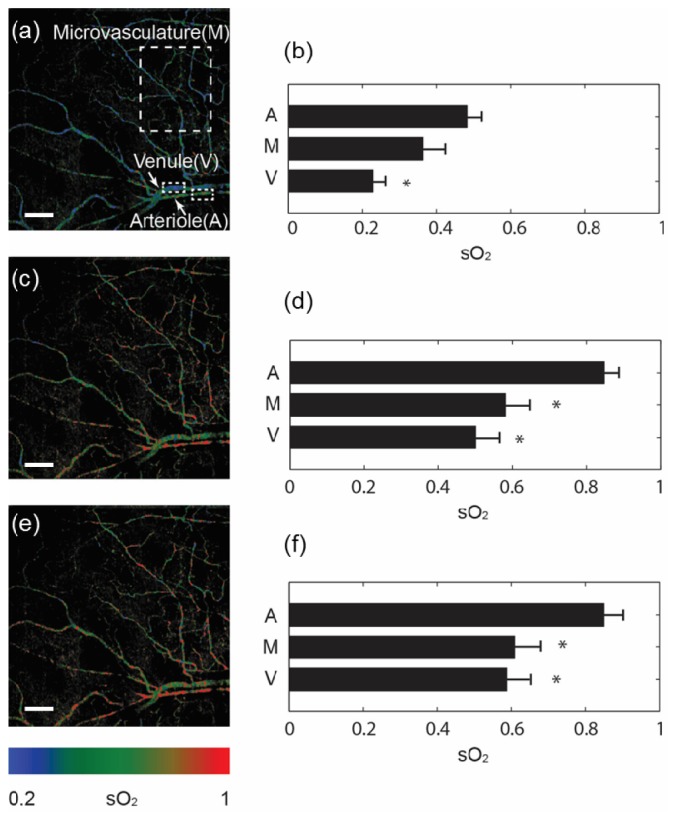
Functional microangiography under a static hypoxia-hyperoxia challenge. (a, c, e) sO2 maps under hypoxia (10% O2 content), normoxia (21% O2 content), and hyperoxia (100% O2 content) conditions. Sample areas from microvasculature, an arteriole and a vein were highlighted in the panel a. Bar = 0.2mm. (b, d, f) Comparison of average sO2 values from the sampled microvasculature (M), arteriole (A) and venule (V). Error bar = s.e.m. (n = 10) *p<0.05 comparing to the arteriole.
Fig. 5.
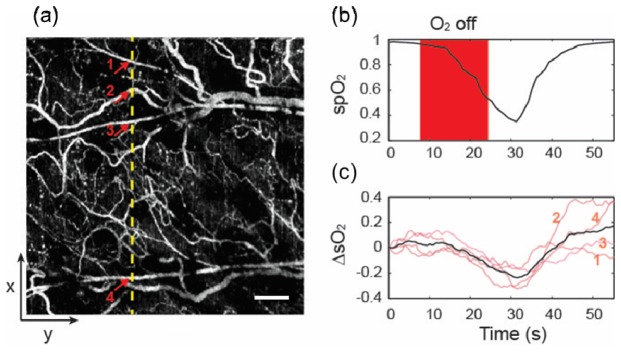
(a) En face microangiography in the x-y plane. sO2 dynamic change was continuously monitored at a x-z cross-sectional plane labeled by a yellow dash line. Arrows indicate four small vessels. Bar = 0.2mm. (b) spO2 from the pulse oximeter as a reference. Transient hypoxia challenge was achieved by turning off O2 supply for ~15s. (c) vis-OCT measurement of sO2 changes from four sampled small blood vessels (light pink) labeled in panel (a), and their average sO2 change (black), in comparison with the simultaneous spO2 readings from the pulse oximeter. The curves were smoothed by a 5s window.
4. Discussion and conclusion
We presented a method using vis-OCT to measure local sO2 from microvasculature by combining the speckle contrast enhancement and the spectroscopic analysis. We verified our methods by a static hypoxia-hyperoxia challenge experiment, and demonstrated the capability of monitoring sO2 dynamics by a transient hypoxia challenge experiment.
The method used here to extract the wavelength-dependent angiography serves two purposes. First, using a narrow band spectrum made the signal less prone to subtle motion artifacts between two subsequent B-scans than using the full width of the spectrum. Second, we obtained the spectral profile from which we could quantify microvascular sO2. The cost of this approach is the sacrificed axial resolution, which was around 7 μm with a 15 nm spectral window within visible light spectral range. This axial resolution is still on the order of the size of a single capillary (6-10 μm).
We calculated the first derivative of the spectra from microvasculature to deduce sO2 instead of the spectral fitting algorithm [17, 18, 25]. There are two reasons behind our current approach. First, the optical properties from single blood cells in capillary level are less clear. In whole blood, the scattering coefficient of red blood cells is scaled by an empirical packing factor due to the dependent scattering in the densely packed whole blood [27]. This scaling does not apply in capillaries because red blood cells can individually flow through the capillary network. Secondly, directly calculating the first derivative eliminated the additional computational error in the fitting optimization, which makes the sO2 deduction more robust.
Several limitations of this study can be improved in the future towards accurately quantifying absolute sO2 by vis-OCT. First, the sensitivity of the sO2 measurement (smallest detectable sO2 difference) need to be better characterized, considering that several noise sources can affect the measurement precision, such as the light source fluctuation and spectral change due to the random geometries of red blood cells. Second, the theoretical treatment by Eq. (4)-(6) does not represent the speckle dynamics that was used to enhance the microvasculature. The exact formulation needs further elucidation. Third, the current reference for our sO2 measurement is via a clinical pulse oximetry, which uses the pulsatile flow pattern to separate arterial signal from venous signal. Thus the spO2 reading provides an overall arterial sO2, including different levels of arterioles, neglecting the plausible variation of sO2 within arterioles [28]. A more accurate in vivo calibration method (e.g. concurrent PAM measurement) could be implemented to further verify our measurement on a same blood vessel.
In summary, we presented a method to measure microvascular sO2 using vis-OCT. The method allows the functional imaging of the local microenvironment. It can be adopted into ophthalmology and several other basic and clinical fields to better understand the fundamental role of the microvasculature in disease progression.
Acknowledgments
We would like to acknowledge our funding support from National Institute of Health grants R01CA128641, R01EB003682, R01CA173745, 1R01EY019951 and 1R24EY022883; National Science Foundation grants CBET-1240416, CBET-1055379, DBI-1353952, and CBET-1066776; a Seed Grant from the Illinois Society for Blindness Prevention; and a post-doctoral fellowship award from the Juvenile Diabetes Research Foundation (JDRF).
References and links
- 1.Pugh C. W., Ratcliffe P. J., “Regulation of angiogenesis by hypoxia: role of the HIF system,” Nat. Med. 9(6), 677–684 (2003). 10.1038/nm0603-677 [DOI] [PubMed] [Google Scholar]
- 2.Carmeliet P., “Angiogenesis in life, disease and medicine,” Nature 438(7070), 932–936 (2005). 10.1038/nature04478 [DOI] [PubMed] [Google Scholar]
- 3.An H., Lin W., “Quantitative Measurements of Cerebral Blood Oxygen Saturation Using Magnetic Resonance Imaging,” J. Cereb. Blood Flow Metab. 20(8), 1225–1236 (2000). 10.1097/00004647-200008000-00008 [DOI] [PMC free article] [PubMed] [Google Scholar]
- 4.Sakadzić S., Roussakis E., Yaseen M. A., Mandeville E. T., Srinivasan V. J., Arai K., Ruvinskaya S., Devor A., Lo E. H., Vinogradov S. A., Boas D. A., “Two-photon high-resolution measurement of partial pressure of oxygen in cerebral vasculature and tissue,” Nat. Methods 7(9), 755–759 (2010). 10.1038/nmeth.1490 [DOI] [PMC free article] [PubMed] [Google Scholar]
- 5.Skala M. C., Hendargo H., Fontanella A., Dewhirst M. W., Izatt J. A., “Combined hyperspectral and spectral domain optical coherence tomography microscope for non-invasive hemodynamic imaging,” Proc. SPIE 7174, 71740I (2009). [DOI] [PMC free article] [PubMed] [Google Scholar]
- 6.Hillman E. M. C., “Optical brain imaging in vivo: techniques and applications from animal to man,” J. Biomed. Opt. 12(5), 051402 (2007). 10.1117/1.2789693 [DOI] [PMC free article] [PubMed] [Google Scholar]
- 7.Zhang H. F., Maslov K., Sivaramakrishnan M., Stoica G., Wang L. V., “Imaging of hemoglobin oxygen saturation variations in single vessels in vivo using photoacoustic microscopy,” Appl. Phys. Lett. 90(5), 053901 (2007). [Google Scholar]
- 8.Wang L. V., Hu S., “Photoacoustic Tomography: In Vivo Imaging from Organelles to Organs,” Science 335(6075), 1458–1462 (2012). 10.1126/science.1216210 [DOI] [PMC free article] [PubMed] [Google Scholar]
- 9.Yao J., Maslov K. I., Zhang Y., Xia Y., Wang L. V., “Label-free oxygen-metabolic photoacoustic microscopy in vivo,” J. Biomed. Opt. 16(7), 076003 (2011). 10.1117/1.3594786 [DOI] [PMC free article] [PubMed] [Google Scholar]
- 10.Hu S., Maslov K., Wang L. V., “Second-generation optical-resolution photoacoustic microscopy with improved sensitivity and speed,” Opt. Lett. 36(7), 1134–1136 (2011). 10.1364/OL.36.001134 [DOI] [PMC free article] [PubMed] [Google Scholar]
- 11.Faber D. J., Mik E. G., Aalders M. C. G., van Leeuwen T. G., “Light absorption of (oxy-)hemoglobin assessed by spectroscopic optical coherence tomography,” Opt. Lett. 28(16), 1436–1438 (2003). 10.1364/OL.28.001436 [DOI] [PubMed] [Google Scholar]
- 12.Lu C.-W., Lee C.-K., Tsai M.-T., Wang Y.-M., Yang C. C., “Measurement of the hemoglobin oxygen saturation level with spectroscopic spectral-domain optical coherence tomography,” Opt. Lett. 33(5), 416–418 (2008). 10.1364/OL.33.000416 [DOI] [PubMed] [Google Scholar]
- 13.Faber D. J., Mik E. G., Aalders M. C. G., van Leeuwen T. G., “Toward assessment of blood oxygen saturation by spectroscopic optical coherence tomography,” Opt. Lett. 30(9), 1015–1017 (2005). 10.1364/OL.30.001015 [DOI] [PubMed] [Google Scholar]
- 14.Kagemann L., Wollstein G., Wojtkowski M., Ishikawa H., Townsend K. A., Gabriele M. L., Srinivasan V. J., Fujimoto J. G., Schuman J. S., “Spectral oximetry assessed with high-speed ultra-high-resolution optical coherence tomography,” J. Biomed. Opt. 12(4), 041212 (2007). 10.1117/1.2772655 [DOI] [PMC free article] [PubMed] [Google Scholar]
- 15.Kuranov R. V., Qiu J., McElroy A. B., Estrada A., Salvaggio A., Kiel J., Dunn A. K., Duong T. Q., Milner T. E., “Depth-resolved blood oxygen saturation measurement by dual-wavelength photothermal (DWP) optical coherence tomography,” Biomed. Opt. Express 2(3), 491–504 (2011). 10.1364/BOE.2.000491 [DOI] [PMC free article] [PubMed] [Google Scholar]
- 16.Kuranov R. V., Kazmi S., McElroy A. B., Kiel J. W., Dunn A. K., Milner T. E., Duong T. Q., “In vivo depth-resolved oxygen saturation by dual-wavelength photothermal (DWP) OCT,” Opt. Express 19(24), 23831–23844 (2011). 10.1364/OE.19.023831 [DOI] [PMC free article] [PubMed] [Google Scholar]
- 17.Robles F. E., Wilson C., Grant G., Wax A., “Molecular imaging true-colour spectroscopic optical coherence tomography,” Nat. Photonics 5(12), 744–747 (2011). 10.1038/nphoton.2011.257 [DOI] [PMC free article] [PubMed] [Google Scholar]
- 18.Yi J., Wei Q., Liu W., Backman V., Zhang H. F., “Visible-light optical coherence tomography for retinal oximetry,” Opt. Lett. 38(11), 1796–1798 (2013). 10.1364/OL.38.001796 [DOI] [PMC free article] [PubMed] [Google Scholar]
- 19.Srinivasan V. J., Sakadzić S., Gorczynska I., Ruvinskaya S., Wu W., Fujimoto J. G., Boas D. A., “Quantitative cerebral blood flow with Optical Coherence Tomography,” Opt. Express 18(3), 2477–2494 (2010). 10.1364/OE.18.002477 [DOI] [PMC free article] [PubMed] [Google Scholar]
- 20.An L., Qin J., Wang R. K., “Ultrahigh sensitive optical microangiography for in vivo imaging of microcirculations within human skin tissue beds,” Opt. Express 18(8), 8220–8228 (2010). 10.1364/OE.18.008220 [DOI] [PMC free article] [PubMed] [Google Scholar]
- 21.Zotter S., Pircher M., Torzicky T., Bonesi M., Götzinger E., Leitgeb R. A., Hitzenberger C. K., “Visualization of microvasculature by dual-beam phase-resolved Doppler optical coherence tomography,” Opt. Express 19(2), 1217–1227 (2011). 10.1364/OE.19.001217 [DOI] [PMC free article] [PubMed] [Google Scholar]
- 22.Makita S., Jaillon F., Yamanari M., Miura M., Yasuno Y., “Comprehensive in vivo micro-vascular imaging of the human eye by dual-beam-scan Doppler optical coherence angiography,” Opt. Express 19(2), 1271–1283 (2011). 10.1364/OE.19.001271 [DOI] [PubMed] [Google Scholar]
- 23.Jia Y., Tan O., Tokayer J., Potsaid B., Wang Y., Liu J. J., Kraus M. F., Subhash H., Fujimoto J. G., Hornegger J., Huang D., “Split-spectrum amplitude-decorrelation angiography with optical coherence tomography,” Opt. Express 20(4), 4710–4725 (2012). 10.1364/OE.20.004710 [DOI] [PMC free article] [PubMed] [Google Scholar]
- 24.Wojtkowski M., Srinivasan V., Ko T., Fujimoto J., Kowalczyk A., Duker J., “Ultrahigh-resolution, high-speed, Fourier domain optical coherence tomography and methods for dispersion compensation,” Opt. Express 12(11), 2404–2422 (2004). 10.1364/OPEX.12.002404 [DOI] [PubMed] [Google Scholar]
- 25.Yi J., Li X., “Estimation of oxygen saturation from erythrocytes by high-resolution spectroscopic optical coherence tomography,” Opt. Lett. 35(12), 2094–2096 (2010). 10.1364/OL.35.002094 [DOI] [PubMed] [Google Scholar]
- 26.Lee J., Srinivasan V., Radhakrishnan H., Boas D. A., “Motion correction for phase-resolved dynamic optical coherence tomography imaging of rodent cerebral cortex,” Opt. Express 19(22), 21258–21270 (2011). 10.1364/OE.19.021258 [DOI] [PMC free article] [PubMed] [Google Scholar]
- 27.Bosschaart N., Edelman G. J., Aalders M. C., van Leeuwen T. G., Faber D. J., “A literature review and novel theoretical approach on the optical properties of whole blood,” Lasers Med. Sci. 29(2), 453–479 (2014). 10.1007/s10103-013-1446-7 [DOI] [PMC free article] [PubMed] [Google Scholar]
- 28.Hu S., Maslov K., Tsytsarev V., Wang L. V., “Functional transcranial brain imaging by optical-resolution photoacoustic microscopy,” J. Biomed. Opt. 14(4), 040503 (2009). 10.1117/1.3194136 [DOI] [PMC free article] [PubMed] [Google Scholar]


