Abstract
By integrating the clinically used endoscope with the emerging Cerenkov luminescence imaging (CLI) technology, a new endoscopic Cerenkov luminescence imaging (ECLI) system was developed. The aim is to demonstrate the potential of translating CLI to clinical studies of gastrointestinal (GI) tract diseases. We systematically evaluated the feasibility and performance of the developed ECLI system with a series of in vitro and pseudotumor experiments. The ECLI system is comprised of an electron multiplying charge coupled device (EMCCD) camera coupled with a clinically used endoscope via an optical adapter. A 1951-USAF test board was used to measure the white-light lateral resolution, while a homemade test chart filled with 68Ga was employed to measure the CL lateral resolution. Both in vitro and pseudotumor experiments were conducted to obtain the sensitivity of the ECLI system. The results were validated with that of CLI using EMCCD only, and the relative attenuation ratio of the ECLI system was calculated. Results showed that The white-light lateral resolution of the ECLI system was 198 µm, and the luminescent lateral resolution was better than 1 mm. Sensitivity experiments showed a theoretical sensitivity of () and () for the in vitro and pseudotumor studies, respectively. The relative attenuation ratio of ECLI to CLI was about 96%. The luminescent lateral resolution of the ECLI system was comparable with that of positron emission tomography (PET). The pseudotumor study illustrated the feasibility and applicability of the ECLI system in living organisms, indicating the potential for translating the CLI technology to the clinic.
OCIS codes: (170.3660) Light propagation in tissues, (170.7050) Turbid media, (170.6935) Tissue characterization
1. Introduction
Gastrointestinal (GI) tract cancer is the second cause of cancer-related death in the world [1, 2]. With the high morbidity, recurrence and mortality rate, GI cancer is difficult to cure. In the clinic, the diagnosis of GI cancer mainly depends on the GI endoscope to provide the amplified structural change of the lesion site with white-light images [3, 4]. However, when the tumor is in the early stage with a small volume and non-superficial location in the GI wall, it is very difficult for clinical physicians to precisely and sensitively identify the lesions using endoscopy, leading to high rates of misdiagnosis [5]. In general, dysfunction of the lesion at the cellular and molecular level is anterior to its structural changes. Thus, integrating molecular imaging techniques with the traditional clinically used endoscopes may improve the diagnosis accuracy of GI cancer.
Positron emission tomography (PET) has been an important tool for accurate tumor positioning and quantification in the clinic at the molecular level, which provide solutions to early detection of GI cancer [6–8]. However, nuclear imaging with PET is expensive, which limits its availability to basic researchers. In the past years, Cerenkov luminescence imaging (CLI) has emerged as a novel molecular imaging approach which bridges nuclear and optical imaging [9–14]. Compared with imaging scintillation [14], CLI has the advantages of cost-effective, well operational flexibility, and high throughput. As a technique that uses optical imaging to screen radionuclides, integrating CLI with the widely applied GI endoscope may provide a new tool for early detection of GI cancer in the clinic. Kothapalli et al. revolutionarily developed a prototype endoscopic system for CLI by placing a specialized endoscope in the field of view of a CCD camera for the first time, and the group demonstrated that the Cerenkov luminescence (CL) could propagate in optical fibers and be detected by a CCD camera [15]. However, this configuration led to a severe leakage of light that is a fatal problem for the detection of weak signal and provided no structural image of the object of interest. Liu et al. further improved the prototype endoscopic system by integrating an imaging optical fiber with a highly sensitive intensified CCD camera to establish a fiber-based CLI endoscopy system. The improved system avoided light leakage to a certain degree and provided the luminescent image with the white-light image [16]. However, the size of the imaging optical fiber and optical lens was too large (with a diameter of 3 cm) for gastroscopy or laparoscopy. Furthermore, the imaging optical fiber was not a clinically used endoscope, which indicated that it cannot be directly applied to the diagnosis of GI diseases in the clinic.
In order to improve the ECLI system to fit the clinical needs, in this study, a new endoscopic Cerenkov luminescence imaging (ECLI) system is developed in this study. The ECLI system is comprised of an endoscope, an electron multiplying CCD (EMCCD) camera, and an optical adapter. With the usage of the flexible endoscope, the ECLI system could detect dysfunction in GI disease via inserting the endoscope into the GI tract. Because the endoscope is a clinically used endoscope, the established ECLI system can be directly applied to diagnose GI disease in the clinic. With the EMCCD camera, weak CL signal is electronically amplified to boost detection efficiency of the system. Specifically, the optical adapter seamlessly connects the endoscope and the EMCCD camera, which avoids light leakage and improves the performance of the system. The spatial lateral resolution and sensitivity of the ECLI system was systematically investigated with a series of in vitro experiments. To further investigate the feasibility of the ECLI system in living organism, a pseudotumor study was conducted. The evaluation results showed that the ECLI system has a comparable performance to PET in planer resolution and has clinical potential to diagnose GI cancer.
2. Materials and methods
2.1 Endoscopic Cerenkov Luminescence Imaging (ECLI) System
The homemade ECLI system is comprised of a clinically-relevant endoscope (GIF-XQ40, Olympus) coupled with an EMCCD camera (iXon3 888, Andor) via an optical adapter (Outai Corp). Figure 1 displays the ECLI system including a photograph of each component (Fig. 1(a)), schematic diagram of the optical path of the ECLI system (Fig. 1(b)), and photograph of the ECLI system (Fig. 1(c)). The overall length of the endoscope is 135 cm, while the working length is 103 cm. The diameter of each optical fiber in the endoscope is , with the material of silica. A micro-sized objective lens with 120° field of view fixed at the distal end of the endoscope was utilized to collect the CL. The EMCCD camera has a pixel size as large as and a peak quantum efficiency of > 90% achieved by thermoelectric cooling down to −95°C. The light-tight optical adapter was fixed at the proximal end of the endoscope to seamlessly connect with the EMCCD camera. During the period of image acquisition, the distal end of the endoscope was put in a light-tight box to mimic the condition of the GI tract and avoid the interference of ambient light. In addition, the background images were acquired before all of the experiments to eliminate the thermal and read noise of the EMCCD camera as much as possible.
Fig. 1.
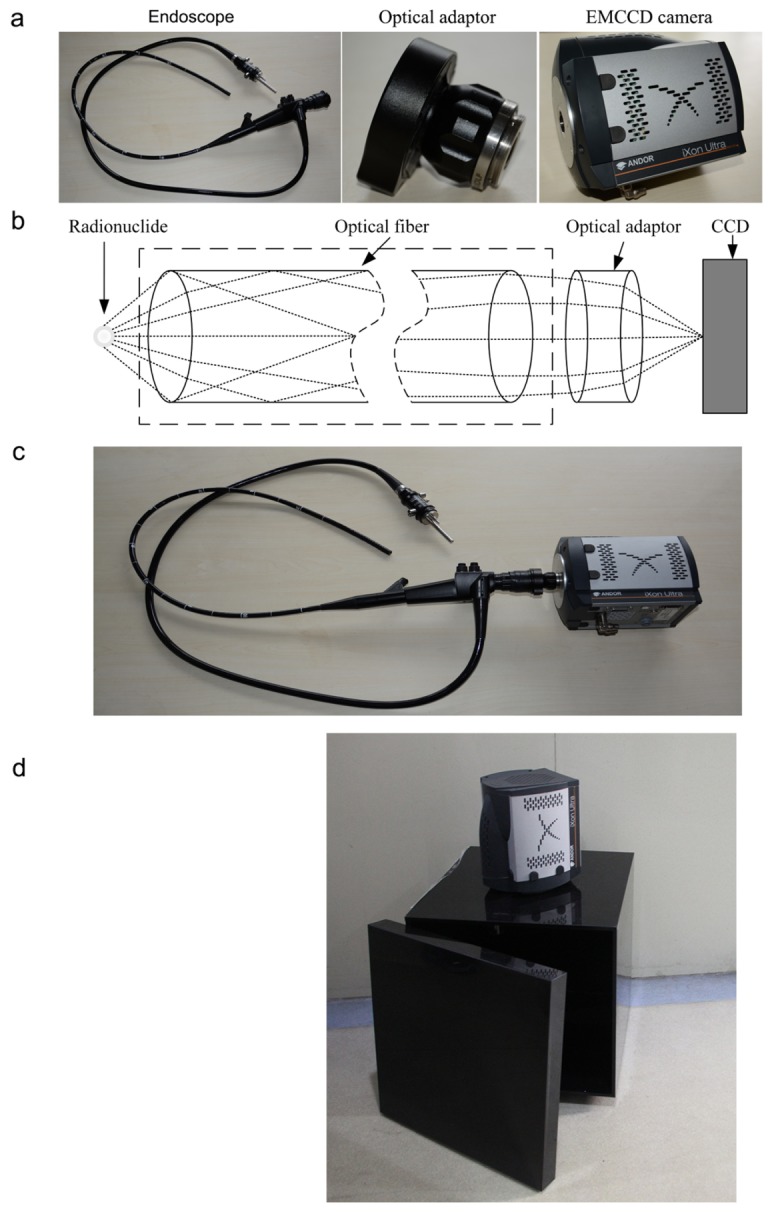
(a) Photograph of each component of the ECLI system; (b) Schematic diagram of the optical path of the ECLI system; (c) Photograph of the ECLI system; (d) Photograph of the traditional CLI system.
2.2 Traditional Cerenkov Luminescence Imaging (CLI) system
The traditional CLI system is composed of an EMCCD camera (iXon3 888, Andor Corp), a standard prime lens (Pentax F/1.8), and a light-tight box, similar to the widely used IVIS optical system. The system photograph is shown in Fig. 1(d). In sensitivity test experiments, including both the in vitro and pseudotumor studies, the whole-body luminescent images were acquired using the traditional CLI system with an acquisition time of 5 min and a binning value of 4. The same settings were used in the acquisition by the ECLI system.
2.3 ECLI performance evaluation
The performance of the ECLI system, including the spatial lateral resolution, linearity and sensitivity, was evaluated with a set of in vitro and pseudotumor experiments. In all of the experiments, the distal end of the ECLI system was kept about 5 mm away from the imaging object (termed as the object plane for convenience), which is a common distance used during clinical diagnosis, and led to a field of view of about 3 × 3 cm2.
In order to prove that the ECLI system is relatively devoid of the leakage of ambient light, we first collected one image using the ECLI system with the whole system inside a light-tight box, and then collected another image using the ECLI system with the distal end of the system inside the light-tight box. All of the imaging experiments were performed in a room with ambient light. The experimental procedure was repeated 5 times as 5 groups.
The spatial lateral resolution of white-light and CL was then tested. For the white-light lateral resolution, a 1951 USAF test board (as depicted in Fig. 3(a)) was placed in the field of view of the ECLI system, and then a photographic image was taken with an integration time of 1 s. The white-light resolution was calculated as:
| (1) |
where and represent the group and element indices at which the white lines could be clearly distinguished. For CL lateral resolution, a homemade test board was made of aluminum as shown in Fig. 3(d). Groups of evenly spaced lines at 1.0 mm to 1.6 mm spacing and holes at spacing 2.4 mm to 3.2 mm were drilled on the test board. The sizes of the lines or holes were the same as the spacing value for each group. To avoid the specular reflection of the luminescent signal, the test board surface was black oxidized. 68Ga was produced by a 67Ge-68Ga generator (ITG Isotope technologies Garching GmbH, Germany). The test board was first filled with about 18.5 MBq (500 µCi) of 68Ga and then placed on the object plane to acquire both the white-light and luminescent images. During the experiment, the white-light image was first taken for each group with an integration time of 1 s, and then the CL image was taken with an integration time of 5 min and a binning value of 4.
To investigate the linearity and sensitivity of the ECLI system, an in vitro experiment was conducted. A single well in a black 96-well plate (300 µl per well) was filled with saline mixed with 185 KBq (5 µCi) of 68Ga. After the white-light image was taken with an integration time of 1 s, the luminescent images were sequentially acquired every 10 min, with an integration time of 5 min and a binning value of 4 for each image. The total testing time was 220 min, about 3.24 half-lives of 68Ga.
2.4 Attenuation rate study
Because a micro-sized objective lens with about a 2 mm diameter and a view angle of 120° was fixed at the distal end of the endoscope in the developed ECLI system, great light attenuation existed compared with the traditional CLI system. To investigate the attenuation rate of the ECLI system compared with the traditional CLI system, the in vitro sensitivity evaluation experiment aforementioned was repeated under the traditional CLI system. The attenuation rate can be calculated using the following formula:
| (2) |
where is the attenuation rate of the ECLI system; is the average intensity in the region of interest (ROI) of the ECLI image; and is the average intensity for the traditional CLI image. The same size of ROI used with ECLI was extracted using traditional CLI at each sampled time-point. The relative attenuation rate was calculated using Eq. (2) for the sampled time-point.
2.5 Pseudotumor animal model imaging evaluation
Tumor cells of GI cancer commonly originate in the mucosa of the GI tract and grow inward (with the possible exception of GISTs), which allows a superficial detection of GI cancers for endoscopic imaging. Therefore, in this study, a nude mouse with a subcutaneous pseudotumor was used to validate the linearity and sensitivity of the ECLI system in the superficial biological tissue.
The pseudotumor animal model was applied according to the description of previous studies [17–19]. Animal care and protocols were approved by the Fourth Military Medical University Animal Studies Committee. All animal procedures were performed under general anesthesia by inhalation of 1%-2% isoflurane-oxygen mixture. A mixture was made of 40 µl Matrigel (BD Biosciences) and 555 KBq (15 µCi) 68Ga to form a final volume of 100 µl in a microfuge tube. It was then subcutaneously injected in the right flank of a nude mouse. The mouse was kept warm for 3 min until the Matrigel solidified.
After the mouse was mounted on a warmed platform, it was firstly imaged using the traditional CLI system to determine the location of the pseudotumor. The mouse was then moved into the ECLI system, and a local image of the pseudotumor was taken. The luminescent images were taken with an integration time of 5 min, while the integration time for the white-light images was 1 s.
Furthermore, a continuous long-term observation using the ECLI system was performed to investigate the linearity and sensitivity of the system in living organism. Similar to the in vitro study, sequential images were acquired every 10 min with an integration time of 5 min and a binning value of 4. The total observation time was 220 min.
2.6 Distortion correction
Because the micro-sized objective lens fixed on the distal end of the endoscope in the ECLI system was a wide-angle lens with a view angle of 120°, distortion occurred in the acquired images. In this study, a commonly used correction method in digital imaging was employed to calibrate the ECLI system and correct the distortion of the images [20].
2.7 Image post-processing
Because the γ-photons emitted from the radionuclide hit the CCD camera, the CL images were heavily corrupted by impulse noise. A median filter with a template size of was used to remove the undesirable noise. The resulting luminescent images were then shown in pseudo color and overlapped on the corresponding white-light images.
3. Results
3.1 Performance evaluation results
The result of the experiment, which is conducted to validate whether the ECLI system is relatively avoid of leakage of light, is shown in Fig. 2. The average intensity of each image in each group was calculated and the results are shown in Fig. 2(a), and it can be concluded that the images in each group have a similar value of average intensity. Additional, the Bhattacharyya factors were also calculated based on the histogram of each image in each group, as shown in Fig. 2(b). The mean value of the Bhattacharyya factor is 0.9201, demonstrating that the images acquired with the EMCCD in the environment with ambient light are similar to those images acquired when the ECLI system is in light-tight box. It can be concluded that the ECLI system has a relatively good performance during any leakage of light.
Fig. 2.
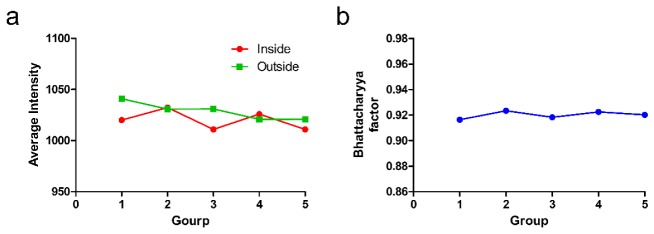
(a) Average intensities of each group; (b) Bhattacharyya factors of each group.
The white-light image of the 1951 USAF test board is shown in Fig. 3(b), and the distortion corrected image is shown in Fig. 3(c). From Fig. 3(c), equally spaced lines in Group 2 and Element 3 can be distinguished. Based on Eq. (1), the spatial lateral resolution of the white-light image can be calculated as 198.4 µm.
Fig. 3.
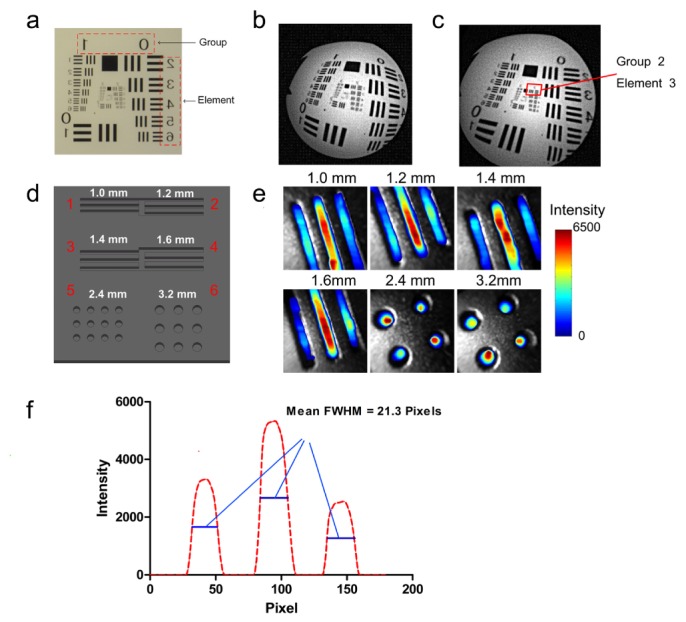
Results of the spatial lateral resolution evaluation experiment. (a) Photograph of the 1951 USAF test board; (b) Photographic image acquired by the ECLI system; (c) Calibrated image of (b); (d) Sketch of the homemade test board used in the CL resolution evaluation experiment; (e) Fusion images of each area in the test chart; (f) Quantitative line profile (red line in area 1).
The CL images from the ECLI system were fused with the corresponding white-light images for each group of lines and holes on the test board (Fig. 3(d)), and are shown in Fig. 3(e). We found that the lines with a distance of 1.0 mm could be clearly distinguished. Because the micro-sized lens is a type of fish-eye lens, the center of the FOV collects more signal than other regions. Before the imaging experiment, a ruler was placed on the object plane to determine a correlation factor. It was established that 25 pixels on the image are equal to 1 mm. To further analyze the result, a profile was extracted across the three lines in group 1, as shown in Fig. 3(f). A mean full width at half maximum (FWHM) of the profile was calculated at 21.3 pixels (0.852 mm). The evaluation revealed that the CL lateral resolution of the ECLI system could be better than 1 mm – a comparable performance to that of PET.
Figure 4(a) shows the sequential images of one well in a black 96-well plate, which was filled with 185 KBq (5 µCi) of 68Ga with a volume of 300 µl, acquired over the decay of the radionuclide. A trend of the intensity attenuation was determined with the delayed imaging time. An ROI was extracted from each image, and the average intensity of the ROIs was calculated. The average intensity of the ROIs as a function of the activity of 68Ga is depicted in Fig. 4(b). We found that the average intensity of the ROIs linearly decreased with the delay of 68Ga. The correlation between the average intensity versus the activity is nearly linear (r2 = 0.9761 and P < 10−5). From the linear correlation equation (y = 1334*x-248.9), the theoretical minimum activity of 68Ga detected by the ECLI system is about (), which indirectly reveals the in vitro sensitivity of the ECLI system.
Fig. 4.
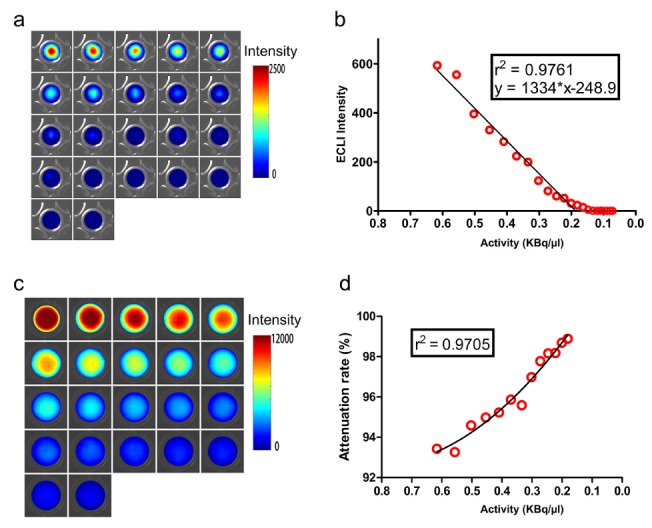
Results of the in vitro sensitivity experiment and attenuation rate study. (a) Fusion images of the in vitro sensitivity experiment; (b) Linearity analysis between the average intensity of the region of interest versus the activity of 68Ga; (c) Fusion images acquired by the traditional CLI system; (d) Linearity analysis between the attenuation rates versus the activity of 68Ga.
3.2 Attenuation rate result
Figure 4(c) shows the fusion images acquired by the traditional CLI system, and Fig. 4(d) shows the attenuation rate as a function of the activity of 68Ga. Using curve fitting, a nonlinear relationship between the attenuation rate and activity was obtained with a value of r2 = 0.9705 and P<10−5. In the observed range of activity, the average attenuation rate was 96.28%, which revealed a great attenuation for the ECLI system.
3.3 Pseudotumor animal model results
Figure 5(a) shows the images acquired by the traditional CLI system, which revealed the pseudotumor location and demonstrated that CL signal was indeed emitted from 68Ga. Based on the fusion image, the regional image of the pseudotumor was then used for imaging by the ECLI system, as shown in Fig. 5(b). The preliminary result validated the capability of the ECLI system in detecting CL in living organisms.
Fig. 5.
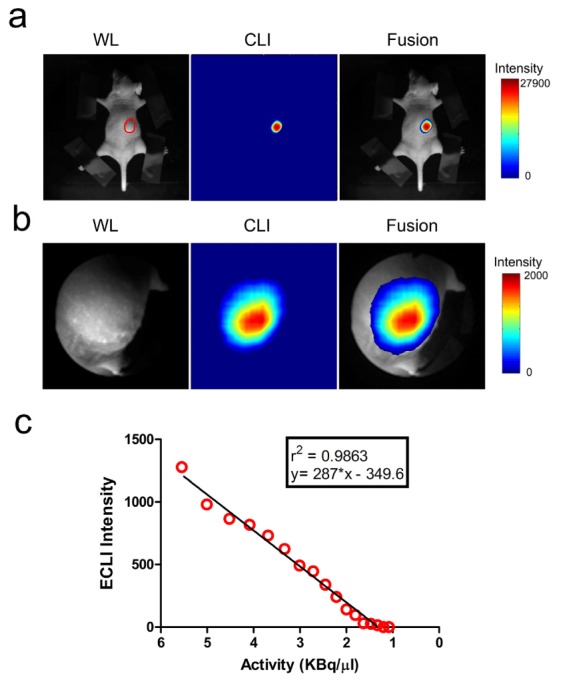
Results of the mouse-bearing pseudotumor experiment. (a) Mouse was imaged by the traditional CLI system, and the pseudotumor area is outlined in red; (b) Regional image of the pseudotumor taken by the ECLI system (pseudo-colored). Left column depicts the white-light (WL) images, the middle shows the luminescent images (CL), and the fusion images with pseudo-color are on the right; (c) Linear relationship between the average intensity of ROIs versus the activity of 68Ga for the pseudotumor experiment.
In the continuous long-term observation experiment, an ROI was extracted from each time-point image, and the average intensity of the ROIs was calculated. Figure 5(c) shows the average intensity of the ROIs as a function of the activity of 68Ga. A linear correlation between the average intensity versus the activity was obtained with r2 = 0.9863 and P < 10−5. The theoretical sensitivity of the ECLI system for living organisms calculated using the linear equation (y = 287*x-349.6) is ().
4. Discussion
In this study, a new ECLI system was presented with the purpose of providing a tool for early detection of GI cancers. An optical adapter was employed to seamlessly connect the clinical endoscope and the EMCCD camera, which could avoid light leaks and improve the performance of the system. With a series of in vitro and pseudotumor experiments, the performance of the ECLI system was evaluated, including the spatial lateral resolution, linearity, sensitivity, and the attenuation rate towards the traditional CLI system. The results proved that our ECLI system has a comparable resolution performance to PET systems. Furthermore, the pseudotumor-based nude mouse study revealed the feasibility of the ECLI system in detecting CL signal in a living organism.
The spatial lateral resolution of the ECLI system includes two aspects, the white-light resolution and CL resolution. In our evaluation experiment, the white-light lateral resolution was 198 µm, which is worse than the fluorescence endoscope [21]. However, it was sufficient enough for application of the ECLI system, because the white-light images were used to provide a reference for CL detection. On the other hand, the CL lateral resolution was found to be better than 1 mm (about 0.852 mm from the calculated FWHM), which is comparable and even better than the resolution of PET imaging. It should be noted that all of the resolution evaluation experiments were conducted under the condition that the distal end of the endoscope equipped in the ECLI system was placed about 5 mm away, the normal distance during a clinical diagnosis, from the test board. It can be speculated that a better resolution might be achieved when a smaller distance is used.
Similarly, the sensitivity of the ECLI system also includes two aspects, the in vitro sensitivity and the living organism sensitivity. The in vitro sensitivity of the ECLI system was about () of 68Ga. The pseudotumor-based nude mouse study revealed a theoretical living organism sensitivity of about (). The 6-fold lower sensitivity living organism than in vitro may be caused by the attenuation of CL in biological tissues. The evaluation results, including both the in vitro and living organism sensitivity, reveal that the ECLI system is analogous with PET imaging and provides great potential for the living organism applications. In Fig. 4(b), the data indicate activities lower than () and are regarded as invalid data, because no linear correlation could be found. However, the relationship between CL intensity and the activity of the radionuclide should be approximately linear [11]. On the other hand, the group also illustrate that the activities lower than () were beyond the detecting capability of the ECLI system. It should be noted that in the later experiments described in this paper, these “invalid” data were also not used for curve fitting.
There is also significant attenuation observed between the developed ECLI and the traditional CLI system, with the difference in whether or not the endoscope was used. The observed attenuation rates are larger than 93%, with an average attenuation rate of 96.28%. The attenuation is caused by the following two reasons. One of the reasons is that the diameter of the micro-sized objective lens equipped in the endoscope of the ECLI system was no more than 2 mm, which is only about one seventh of the lens aperture in the traditional CLI system. This results in less CL entering into the endoscope. The other reason is that attenuation is caused by the optical fiber when CL is transmitted through it. These attenuations could be improved by increasing the size of the objective lens and the number of optical fibers, or by using optimized optical lens and fibers.
One challenge lies in the clinical application of the ECLI system: GI tract movement. The movement is one of the key influencing factors not only in the experimental practice of luminescence or fluorescence endoscope trials but also in the clinical practice of traditional endoscopes. One solution is to reduce the distance between the distal end of the endoscope and the tumors; however, the distance depends only on the actual need in the clinical study and is therefore not a fixed value. Another solution is to shorten the exposure time by utilizing new CCD technology with an optimized optical system. On the other hand, the ECLI system can just provide two-dimensional planar images. However, with the help of the computational optical biopsy (COB) approach [22], a relatively accurate distribution of radionuclide probe with deep information will be reconstructed.
Our future work will concentrate on the improvement of the ECLI system in both sensitivity and resolution by optimizing the objective lens and increasing the number of optical fibers. Having an inherent advantage of the ECLI system in detecting the GI lesion, it is expected that the ECLI system will accelerate the translation of the CLI technology into clinical applications, especially the clinical diagnosis of GI cancer. Figure 6 depicts a schematic diagram for the potential clinical application of the ECLI system in the clinical diagnosis of GI cancer.
Fig. 6.
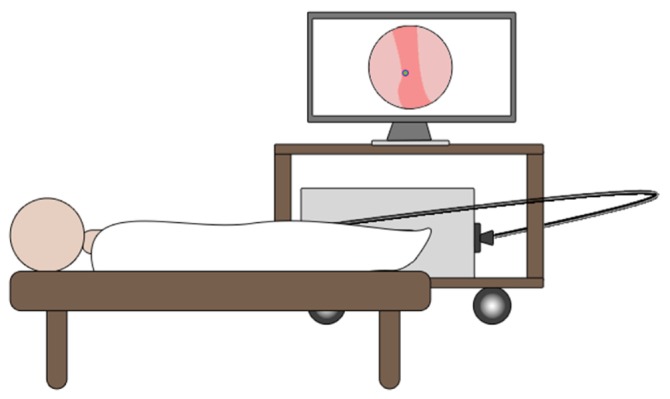
Schematic sketch of the clinical application of the ECLI system in the future.
5. Conclusion
In conclusion, a novel endoscopic Cerenkov luminescence imaging (ECLI) system was presented in this study, which was expected to provide a valuable tool for clinical diagnosis of GI cancer. A series of experiments were designed and conducted to evaluate the performance of the developed ECLI system. A pseudotumor-based nude mouse study was further conducted to mimic the acquisition of CL in a living organism, which revealed great potential of the ECLI system for clinical applications.
Acknowledgments
This work was supported in part by the Program of National Basic Research and Development Program of China (973) under Grant No. 2011CB707702, the National Natural Science Foundation of China under Grant Nos. 81090272, 81227901, 81101083, 81230033, 81401442, the Open Research Project under Grant 20120101 from SKLMCCS, and the Fundamental Research Funds for the Central Universities.
References and links
- 1.Siegel R., Naishadham D., Jemal A., “Cancer statistics, 2013,” CA Cancer J. Clin. 63(1), 11–30 (2013). 10.3322/caac.21166 [DOI] [PubMed] [Google Scholar]
- 2.Jemal A., Bray F., Center M. M., Ferlay J., Ward E., Forman D., “Global cancer statistics,” CA Cancer J. Clin. 61(2), 69–90 (2011). 10.3322/caac.20107 [DOI] [PubMed] [Google Scholar]
- 3.Hodgson S. V., Foulkes W. D., Eng C., Maher E. R., “Gastrointestinal System,” in A Practical Guide to Human Cancer Genetics (Springer, 2014), pp. 47–87 [Google Scholar]
- 4.Saunter C. D., Semprini S., Buckley C., Mullins J., Girkin J. M., “Micro-endoscope for in vivo widefield high spatial resolution fluorescent imaging,” Biomed. Opt. Express 3(6), 1274–1278 (2012). 10.1364/BOE.3.001274 [DOI] [PMC free article] [PubMed] [Google Scholar]
- 5.van Rijn J. C., Reitsma J. B., Stoker J., Bossuyt P. M., van Deventer S. J., Dekker E., “Polyp miss rate determined by tandem colonoscopy: a systematic review,” Am. J. Gastroenterol. 101(2), 343–350 (2006). 10.1111/j.1572-0241.2006.00390.x [DOI] [PubMed] [Google Scholar]
- 6.Glaudemans A. W., Signore A., “Nuclear Medicine Imaging Modalities: Bone Scintigraphy, PET-CT, SPECT-CT,” in Bone Metastases (Springer, 2014), pp. 71–94 [Google Scholar]
- 7.Goerres G. W., Stupp R., Barghouth G., Hany T. F., Pestalozzi B., Dizendorf E., Schnyder P., Luthi F., von Schulthess G. K., Leyvraz S., “The value of PET, CT and in-line PET/CT in patients with gastrointestinal stromal tumours: long-term outcome of treatment with imatinib mesylate,” Eur. J. Nucl. Med. Mol. Imaging 32(2), 153–162 (2005). 10.1007/s00259-004-1633-7 [DOI] [PMC free article] [PubMed] [Google Scholar]
- 8.Antoch G., Kanja J., Bauer S., Kuehl H., Renzing-Koehler K., Schuette J., Bockisch A., Debatin J. F., Freudenberg L. S., “Comparison of PET, CT, and dual-modality PET/CT imaging for monitoring of imatinib (STI571) therapy in patients with gastrointestinal stromal tumors,” J. Nucl. Med. 45(3), 357–365 (2004). [PubMed] [Google Scholar]
- 9.Thorek D. L., Riedl C., Grimm J., “Clinical Cerenkov Luminescence Imaging of 18F-FDG,” J. Nucl. Med. 5595–98 (2014). [DOI] [PMC free article] [PubMed] [Google Scholar]
- 10.Thorek D. L., Ogirala A., Beattie B. J., Grimm J., “Quantitative imaging of disease signatures through radioactive decay signal conversion,” Nat. Med. 19(10), 1345–1350 (2013). 10.1038/nm.3323 [DOI] [PMC free article] [PubMed] [Google Scholar]
- 11.Xu Y., Liu H., Cheng Z., “Harnessing the power of radionuclides for optical imaging: Cerenkov luminescence imaging,” J. Nucl. Med. 52(12), 2009–2018 (2011). 10.2967/jnumed.111.092965 [DOI] [PubMed] [Google Scholar]
- 12.Boschi F., Calderan L., D’Ambrosio D., Marengo M., Fenzi A., Calandrino R., Sbarbati A., Spinelli A. E., “In vivo 18F-FDG tumour uptake measurements in small animals using Cerenkov radiation,” Eur. J. Nucl. Med. Mol. Imaging 38(1), 120–127 (2011). 10.1007/s00259-010-1630-y [DOI] [PubMed] [Google Scholar]
- 13.Spinelli A. E., D’Ambrosio D., Calderan L., Marengo M., Sbarbati A., Boschi F., “Cerenkov radiation allows in vivo optical imaging of positron emitting radiotracers,” Phys. Med. Biol. 55(2), 483–495 (2010). 10.1088/0031-9155/55/2/010 [DOI] [PubMed] [Google Scholar]
- 14.Boschi F., Spinelli A. E., D’Ambrosio D., Calderan L., Marengo M., Sbarbati A., “Combined optical and single photon emission imaging: preliminary results,” Phys. Med. Biol. 54(23), L57–L62 (2009). 10.1088/0031-9155/54/23/L01 [DOI] [PubMed] [Google Scholar]
- 15.Kothapalli S.-R., Liu H., Liao J. C., Cheng Z., Gambhir S. S., “Endoscopic imaging of Cerenkov luminescence,” Biomed. Opt. Express 3(6), 1215–1225 (2012). 10.1364/BOE.3.001215 [DOI] [PMC free article] [PubMed] [Google Scholar]
- 16.Liu H., Carpenter C. M., Jiang H., Pratx G., Sun C., Buchin M. P., Gambhir S. S., Xing L., Cheng Z., “Intraoperative imaging of tumors using Cerenkov luminescence endoscopy: a feasibility experimental study,” J. Nucl. Med. 53(10), 1579–1584 (2012). 10.2967/jnumed.111.098541 [DOI] [PMC free article] [PubMed] [Google Scholar]
- 17.Carpenter C. M., Sun C., Pratx G., Liu H., Cheng Z., Xing L., “Radioluminescent nanophosphors enable multiplexed small-animal imaging,” Opt. Express 20(11), 11598–11604 (2012). 10.1364/OE.20.011598 [DOI] [PMC free article] [PubMed] [Google Scholar]
- 18.Liu H., Zhang X., Xing B., Han P., Gambhir S. S., Cheng Z., “Radiation-Luminescence-Excited Quantum Dots for in vivo Multiplexed Optical Imaging,” Small 6(10), 1087–1091 (2010). 10.1002/smll.200902408 [DOI] [PubMed] [Google Scholar]
- 19.Dothager R. S., Goiffon R. J., Jackson E., Harpstrite S., Piwnica-Worms D., “Cerenkov radiation energy transfer (CRET) imaging: a novel method for optical imaging of PET isotopes in biological systems,” PLoS ONE 5(10), e13300 (2010). 10.1371/journal.pone.0013300 [DOI] [PMC free article] [PubMed] [Google Scholar]
- 20.Zhang Z., “A flexible new technique for camera calibration,” IEEE Trans. Pattern Analysis Machine Intelligence 22(11), 1330–1334 (2000). 10.1109/34.888718 [DOI] [Google Scholar]
- 21.Kyrish M., Dobbs J., Jain S., Wang X., Yu D., Richards-Kortum R., Tkaczyk T. S., “Needle-based fluorescence endomicroscopy via structured illumination with a plastic, achromatic objective,” J. Biomed. Opt. 18(9), 096003 (2013). 10.1117/1.JBO.18.9.096003 [DOI] [PMC free article] [PubMed] [Google Scholar]
- 22.Li Y., Jiang M., Wang G., “Computational optical biopsy,” Biomed. Eng. Online 4(1), 36 (2005). 10.1186/1475-925X-4-36 [DOI] [PMC free article] [PubMed] [Google Scholar]


