

Supplemental Digital Content is Available in the Text.
Scale properties of the FLS-25, an LSS-specific symptom scale, were tested in patients with LSS before and after conservative treatment. Criterion validity and responsiveness of FLS-25 were demonstrated by correlations with stress test measurements. The use of FLS-25 is warranted to monitor patients and evaluate therapeutic efficacy.
Keywords: lumbar spinal stenosis, symptom scale, self-administered questionnaire, criterion validity, responsiveness, conservative therapies, ROC analysis, Guyatt responsiveness index, lumbar extension test, walking stress test
Abstract
Study Design.
Cross-sectional study.
Objectives.
To test the validity and responsiveness of the lumbar spinal stenosis (LSS)–specific symptom scale (FLS-25 [Fukushima LSS Scale 25]).
Summary of Background Data.
The FLS-25, a self-administered questionnaire designed to comprehensively cover various symptoms of LSS, has been developed to address the need to measure symptoms specific to this disorder.
Methods.
One hundred sixty-seven patients with confirmed LSS who required conservative therapy were asked to complete a questionnaire including questions regarding walking capacity and the FLS-25. These patients also underwent a lumbar extension test and a walking stress test, which are stress tests designed to objectively evaluate LSS symptoms, to measure standing time, walking distance, and walking time. Relationship between the FLS-25 scores and these external standards was analyzed to evaluate the criterion validity of the FLS-25. The patients underwent the same evaluations after 8 weeks of conservative therapy. The relationship between changes from baseline to week 8 in FLS-25 scores and changes in the 3 external standards was analyzed to evaluate the responsiveness of the FLS-25.
Results.
The distribution of FLS-25 scores among patients was symmetric, and there were no ceiling or floor effects. FLS-25 scores increased as self-reported walking capacity decreased (P = 0.006). The mean standing time in the lumbar extension test was 165 (SD = 109) seconds, and FLS-25 scores increased as standing time decreased (P = 0.003). In the walking stress test, mean walking distance and mean walking time were 213 (SD = 154) m and 236 (SD = 114) seconds. FLS-25 scores increased as walking distance (P = 0.002) and walking time (P = 0.054) decreased. Changes from baseline to week 8 in FLS-25 scores correlated with changes in the stress test standing time (P = 0.014), walking distance (P < 0.001), and walking time (P < 0.001).
Conclusion.
The criterion validity and responsiveness of the FLS-25 were confirmed. The use of FLS-25 in clinical and investigational settings is warranted to monitor patients and evaluate therapeutic efficacy.
Level of Evidence: 3
Lumbar spinal stenosis (LSS) is a common disease of the spine.1,2 Its symptoms include pain, numbness, and warmth in the legs, the severity of which changes according to posture and physical activities of the patient. Neurogenic intermittent claudication characteristically accompanies these symptoms and is a major cause of gait disorders in older adults. The degree of stenosis as determined from x-ray, magnetic resonance imaging, and other imaging findings cannot be used to monitor treatments because it does not always correspond to LSS symptom severity.3–6 The number of patients with LSS will inevitably increase as society ages, which makes the control of relatively mild symptoms without serious dysfunction and the development of new treatments more important than ever. Consequently, a need emerges for the development of a reliable and valid method that comprehensively measures LSS-specific symptoms and allows the efficacy of treatments, including conservative therapies, to be evaluated.
A walking stress test7,8 and a standing stress test9 are used to evaluate the neurological extent of LSS. During these tests, an observer records the complaints of patients asked either to assume a standing position or to walk. Findings from a stress test are essential to determine the responsible level of stenosis in patients for whom a surgery is indicated.10,11 Stress tests can reproduce symptoms that occur only in association with specific postures and activities. Stress tests have the advantage of being objective because an observer documents patient complaints and conditions during the test; however, implementation of the tests requires a lot of labor because a trained observer must accompany patients.
Various self-administered questionnaires have been used to evaluate postoperative walking improvement and patient satisfaction. The Oswestry Disability Index,12,13 Swiss Spinal Stenosis Questionnaire,14,15 and Oxford Claudication Score16 evaluate lumbar and leg pain and numbness, but they do not directly measure symptoms that occur in association with certain postures and activities. The Roland-Morris Disability Questionnaire17,18 is designed specifically to measure the impact of lumbar pain on quality of life. The SF-3619,20 and EuroQol21,22 are generic quality-of-life scales and lack LSS specificity. Thus, the existing self-administered questionnaires are of limited utility for comprehensively measuring LSS-specific symptoms and evaluating a wide range of treatments.
To address this deficit, the LSS-specific symptom scale (FLS-25 [Fukushima LSS Scale 25]) has been developed, with the objective of comprehensively covering patient symptoms by asking patients about their symptoms in specific situations instead of global questions, and has been shown to be reliable and valid.23 The objective of the present study was to validate the FLS-25 in a new group of patients with LSS (i.e., different from the group used when the scale was developed) who required conservative therapy. FLS-25 criterion validity was confirmed using the results of stress tests as external standards. FLS-25 responsiveness was evaluated by comparing changes in scale scores from before to after treatment with changes in the external standards.
MATERIALS AND METHODS
This study was conducted as a part of a multicenter clinical study by Kaken Pharmaceutical Co., Ltd. The Ethics Committees of the study sites (including Fukushima Medical University) approved the study.
Subjects
One hundred sixty-seven patients with a diagnosis of LSS were included in the study. The inclusion criteria were as follows: (1) 40 to 79 years of age; (2) spondylotic or degenerative spondylolisthetic LSS confirmed on magnetic resonance images; (3) assessed as having LSS in a self-administered questionnaire (“Diagnostic tool for LSS”)1; (4) walking time of 10 minutes or less in a walking stress test (see “Stress Tests” section); and (5) an ankle brachial index of 0.9 or greater. The exclusion criteria were as follows: (1) LSS of a severity constituting eligibility for surgery; (2) prior surgery of lumbar spinal canal; (3) imaging findings indicative of intervertebral disc hernia; (4) coexisting gait disorder associated with a disease other than LSS; and (5) a psychiatric or cognitive disorder. All patients gave written informed consent. The backgrounds of patients are shown in Table 1.
TABLE 1. Characteristics of Study Subjects.
| No. patients | 167 |
| Age, mean (range), yr | 68 (45–80) |
| Female/male | 97/92 |
| Disease course | |
| Spondylosis | 82 (49%) |
| Degenerative spondylolisthesis | 85 (51%) |
| Walking capacity (self-reported)* | |
| <5 min | 81 (49%) |
| 5–10 min | 56 (34%) |
| 10–15 min | 19 (12%) |
| ≥15 min | 8 (5%) |
*Data for 3 patients were missing.
Study Procedures
The patients completed a questionnaire at week 0 (baseline). The questionnaire included items of the FLS-25 (see Supplemental Digital Content Appendix, available at http://links.lww.com/BRS/A899) and a question regarding walking capacity with 4 choices. The patients then underwent stress tests (see “Stress Tests” section). After 2 weeks without active therapy, the patients completed the questionnaire a second time (baseline-2). The patients then received drug therapy for 6 weeks. Prostaglandin derivatives were used in drug therapy. During the 8-week period, patients did not undergo surgery or nerve block to the lumbar area or receive orthotic treatment to prevent lordosis of the lumbar spine. After the 8-week period, the patients completed the questionnaire a third time and then underwent stress tests.
Stress Tests
The patients underwent 2 types of stress tests that produced 3 measurements. In the lumbar extension test,9 the test administrator asked the patients to assume a slightly extended posture (i.e., a posture with the back muscles extended and the chest outstretched) and measured the time until the patients reported that symptoms became more severe or they were no longer able to maintain that posture (standing time, in seconds). In the walking stress test,7,8 the test administrator walked with the patients over a flat area. The administrator asked patients to maintain their posture with the back muscles extended and walk at a normal pace. The distance (walking distance, in meters) and time (walking time, in seconds) until the patients symptoms intensified to the extent that they were no longer able to walk or maintain that specified posture were measured.
Assessment of Criterion Validity and Responsiveness
Criterion Validity
The mean scores of the 25 items were converted to a scale ranging from 0 to 100 points to serve as the FLS-25 score. Higher scores indicated greater symptom severity. The relationship between the scores and self-reported walking capacity and the 3 stress test measurements was analyzed.
Responsiveness
The difference between week 8 and baseline values was taken to represent the change in scores after drug therapy. The relationship between changes in the scores and changes in the 3 stress test measurements was analyzed. Changes in the stress test measurements were determined as the differences between week 8 and baseline values and then arbitrarily assigning the differences into the 3 categories of “worsened,” “no change,” and “improved” (Figure 1A–C).
Figure 1.

Relationship between changes in stress test measurements and changes in FLS-25 scores. Stress test measurements were classified into 3 groups of “worsened,” “no change,” and “improved” as follows: A, Standing time (worsened: ≤−50 s [n = 9; range, −351 to −50]; no change: −50 to 200 s [n = 66; range, −22 to 199]; improved: >200 s [n = 65; range, 225–1156]; ANOVA: F2,137= 4.400; P = 0.014). B, Walking distance (worsened: ≤−50 m [n = 15; range, −338 to −50]; no change: −50 to 250 m (n = 79; range, −47 to 250); improved: >250 m (n = 46; range, 270–1661); ANOVA: F2,137= 9.850; P < 0.001). C, Walking time (worsened: ≤−50 s (n = 18; range, −282 to −59); no change: −50 to 50 s (n = 69; range, −37 to 50); improved: >50 s (n = 53; range, 53–292); ANOVA: F2,137= 9.850; P < 0.001)
The following 2 indexes of responsiveness were calculated. The area under the receiver operating characteristic (ROC) curve24 was calculated for comparing changes in the score with those in the stress test measurements to summarize the ability of the scale to reflect changes in the external standards. To summarize the magnitude of responsiveness, the Guyatt responsiveness index25 was calculated by dividing the mean score changes in patients with an improvement in each stress test by the SD of the score changes between baseline and baseline-2 (clinically stable status).
Statistical Analysis
The mean values and SDs of numerical values were determined. One-way analysis of variance was used to statistically test the relationship between the FLS-25 scores and the external standards. The Tukey multiple comparison test was performed when the result of analysis of variance to compare 3 or more groups was P < 0.05. SPSS (version 21.0; IBM, New York, NY) was used for statistical analysis.
RESULTS
Among the 167 patients, FLS-25 scores distributed symmetrically in a range from 9 to 94 points of 100 points with the mean score of 53.8 (SD = 16.5) points. The scores were not clustered at the highest possible score or at the lowest possible score (i.e., there was no “ceiling” effect and no “floor” effect).
Table 2 shows the relationship between patient self-reported walking capacity and FLS-25 scores. Scores differed significantly among the 3 walking capacity groups (P < 0.006). FLS-25 scores were higher in groups with lower walking capacity. A significant difference between the less than 5-minute group and 15-minute or more group was noted. Mean standing time, walking distance, and walking time were 165 (SD = 109) seconds, 213 (SD = 154) m, and 236 (SD = 114) seconds, respectively.
TABLE 2. Relationship Between Self-reported Walking Capacity and FLS-25 Scores.
| Walking Capacity | n | FLS-25 Score, Mean (SD) | Difference* Among Groups |
|---|---|---|---|
| <5 min | 81 | 57.7 (15.5) | F3,160 = 4.35; P = 0.006 |
| 5–10 min | 56 | 52.1 (17.5) | |
| 10–15 min | 19 | 47.7 (14.7) | |
| ≥15 min | 8 | 41.0 (16.3) |
The question regarding walking capacity asked, “How many minutes are you able to walk when your symptoms are severe?” and allowed patients to choose from the 4 choices of less than 5 minutes, 5 to 10 minutes, 10 to 15 minutes, and at least 15 minutes.
The post hoc Tukey test: P < 0.05 between the groups of less than 5 minutes and 15 minutes or more.
*Analysis of variance.
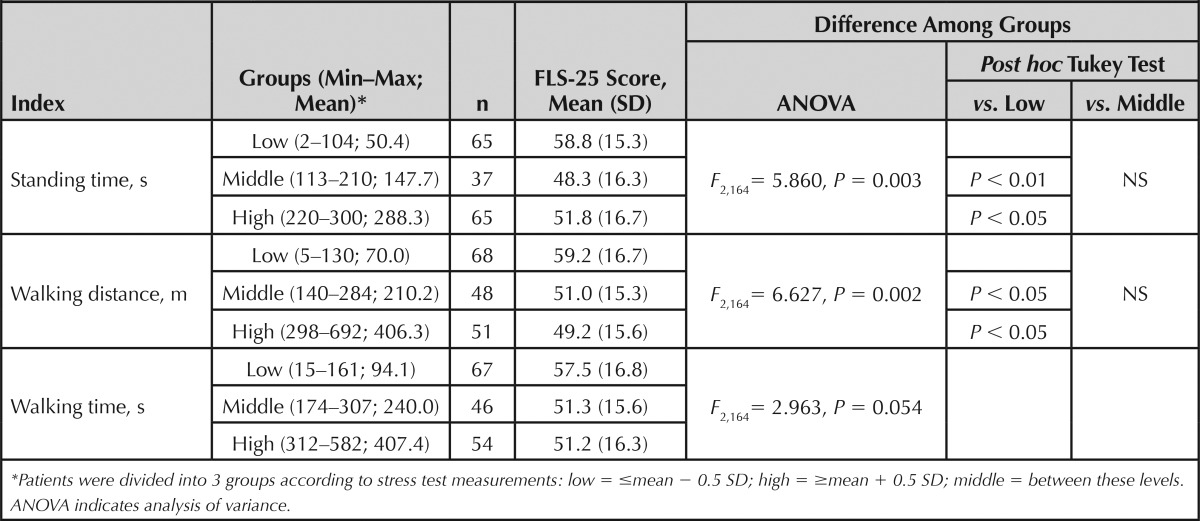
Table 3 shows the relationship between the 3 stress test measurements and FLS-25 scores. The scores were similarly related to each of the measurements. Scores differed significantly among the 3 standing time groups (P = 0.003). Significant differences were noted between the scores in the low standing time group and the middle and high standing time groups. Scores also differed significantly among the 3 walking distance groups (P = 0.002). Significant differences were noted between the scores in the low walking distance group and the middle and high walking distance groups. The difference in the scores among the 3 walking time groups was marginally insignificant (P = 0.054). As was the case with the previous 2 measurements, the scores in the low walking time group tended to be higher than those in the middle and high walking time groups.
TABLE 3. Relationship Between Baseline Stress Test Measurements and FLS-25 Scores.
Data were obtained from 140 of 167 patients after the 8-week treatment period. FLS-25 scores improved by 8.2 (SD = 18.0) points after treatment. Mean improvements in standing time, walking distance, and walking time were 66 (SD = 105) seconds, 245 (SD = 353) m, and 227 (SD = 323) seconds, respectively. The results of an analysis of FLS-25 score responsiveness are shown in Figure 1. Because higher scores indicate greater symptom severity, a negative difference between week 8 and week 0 scores indicates an improvement. Scores differed significantly among the 3 standing time groups (P = 0.014). The Tukey test indicated a significant difference between the “improved” and “no change” group scores. Scores also differed significantly among the 3 walking distance groups (P < 0.001). The Tukey test indicated significant differences between the “improved” and “no change” group scores and between the “improved” and “worsened” group scores. Scores also differed significantly among the 3 walking time groups (P < 0.001). The Tukey test indicated significant differences between the “improved” and “no change” group scores and between the “improved” and “worsened” group scores.
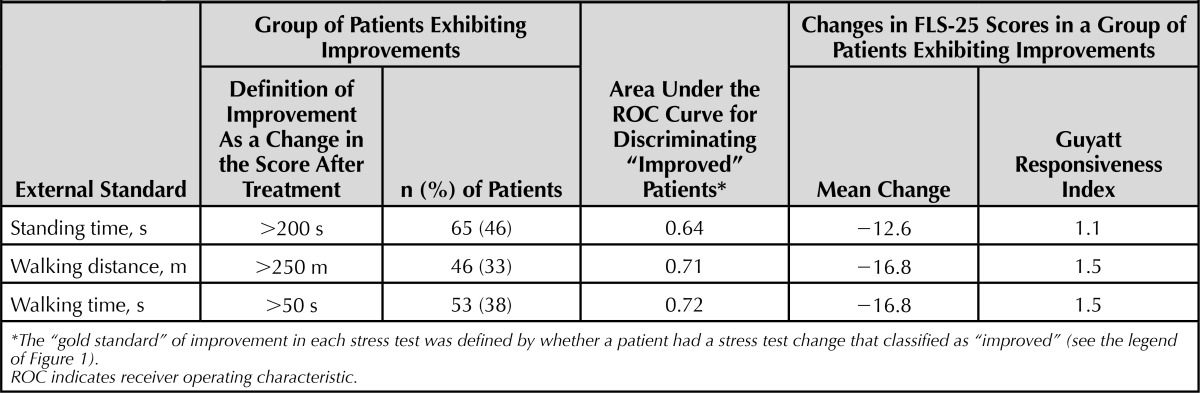
Summary indexes of the responsiveness of FLS-25 are shown in Table 4. A third to half of patients (33%–46%) were classified as “improved” in each of the 3 stress tests according to the same criteria used in Figure 1. Mean changes in FLS-25 scores among “improved” patients were −12.6 to −16.8 points for each of the 3 stress test indexes. A mean change during a clinically stable period with no active treatment between the baseline (week 0) and baseline-2 (week 2) was 0.1 (SD = 11.1) points. Thus, the Guyatt responsiveness index of FLS-25 was 1.1 to 1.5 for each of the stress test indexes. The area under the ROC curve was 0.64 to 0.72 for each of the stress test indexes.
TABLE 4. Responsiveness of FLS-25 Represented by the Area Under the ROC Curves and the Guyatt Responsiveness Indexes.
DISCUSSION
In this study, the scale properties of FLS-25 were tested using a confirmatory study design. The study had 4 strengths. First, we used a new population that differed from the one used in the scale development. Second, patients in the present study, who had a confirmed diagnosis of LSS and required conservative therapy, were those for whom the scale was intended to use. Third, criterion validity was evaluated on the basis of the results of stress tests as external standards. The walking stress test reveals signs that are absent when the patient is at rest in 70% of patients with LSS.10 The lumbar extension test is used for purposes similar to the walking stress test.11 The measurements can be intuitively interpreted, are clinically valid, and are objective. Therefore, the test measurements are highly reliable and well suited as external standards for assessing the validity of the scale. Fourth, scale measurements and the stress tests were performed both before and after treatment to evaluate FLS-25 responsiveness.
FLS-25 scores were associated with self-reported walking times. Also, scores increased as the stress test measurements of standing time, walking distance, and walking time decreased. These results demonstrate the validity of the scale. Scores in the group with low values in the 3 stress test measurements, which had greater symptom severity, were significantly different from scores in the groups with middle and high measurements, which had relatively mild symptom severity. However, scores in the groups with middle and high values did not differ substantially. This result indicates that the scale scores may be more sensitive at greater severities. The overall population showed an improvement in stress test measurements and FLS-25 scores from baseline to week 8 of drug therapy. The degree of improvement in stress test measurements was significantly associated with the degree of improvement in FLS-25 scores, which demonstrated the responsiveness of FLS-25. Because changes in FLS-25 scores correspond to changes in symptom-associated disabilities, the improvement a patient shows in FLS-25 score may be used to gauge improvements in standing and walking ability to some extent even when no stress test is performed.
Stucki et al14 reported responsiveness of the Swiss Spinal Stenosis Questionnaire in patients with LSS. However, this questionnaire has not been validated for evaluating patient responses to conservative treatment. Comparing our results with those of Stucki et al may not be relevant because all patients in their study underwent surgery and the external standard was self-reported, subjective satisfaction with the surgery performed. The present study showed that FLS-25 can be used to assess the effect of conservative treatment. In addition, this study included some patients with radicular pain, some patients with equinopathy, and some patients with both, so the results indicate that the FLS-25 can be used in patients with various types of LSS.
Regarding scale responsiveness to conservative treatment, Walsh et al26 examined, by analyzing a registry database of patients with low back pain in the United States, the change scores of SF-36 Bodily Pain and Physical Function and the low back pain–specific Oswestry Disability Index and reported a Guyatt responsiveness index of 0.87 to 1.53 and the area under ROC curve of 0.72 to 0.75. From the viewpoint of clinically meaningful responses, Ostelo et al27 explored, by conducting a systematic review and expert meetings, the score changes in several scales for low back pain, including the visual analogue scale, the Roland-Morris Disability Questionnaire, and the Oswestry Disability Index, and indicated an absolute change by 10% to 20% of the measurement range as a cutoff value representing a clinically meaningful response to the treatment of low back pain. Our results on the FLS-25—the Guyatt responsiveness index of 1.1 to 1.5, the area under ROC curve of 0.64 to 0.72, and the mean change of 13 to 17 points per 100 points (measurement range) in patients who showed an improvement in the stress tests—were compatible with these results, indicating that the degree of responsiveness of FLS-25 in patients with LSS is similar to that of commonly used low back pain scales in patients with low back pain. Concerning the clinically meaningful response of the FLS-25 after conservative therapy, we would propose an absolute change score of 15 points per 100 points.
In conclusion, LSS-specific FLS-25 scores were correlated with self-reported walking times and stress test standing times, walking distances, and walking times in a population of patients with confirmed LSS who required conservative treatment. Score changes after treatment were correlated with the degree of improvement in stress test measurements. The FLS-25 is a promising tool for evaluating LSS symptom severity and changes in severity. The use of the FLS-25 in clinical and investigational settings is warranted to monitor patients and evaluate therapeutic efficacy.
Key Points
The validity and responsiveness of the LSS-specific symptom scale were tested in 167 patients with LSS requiring conservative therapy.
The scale scores were higher in patients with shorter self-reported walking distance.
The scale scores were higher in patients with shorter standing time in the lumbar extension test, and they were also higher in patients with shorter walking distance and shorter walking time in the walking stress test.
Changes in scores from before to after conservative therapy were correlated with changes in the aforementioned stress test indexes.
This scale may be used to monitor patients and to evaluate therapeutic efficacy.
Acknowledgments
Supplemental digital content is available for this article. Direct URL citation appears in the printed text and is provided in the HTML and PDF versions of this article on the journal's Web site (www.spinejournal.com).
Footnotes
Acknowledgment date: March 27, 2014
The manuscript submitted does not contain information about medical device(s)/drug(s).
No funds were received in support of this work. No relevant financial activities outside the submitted work.
References
- 1.Konno S, Kikuchi S, Tanaka Y, et al. A diagnostic support tool for lumbar spinal stenosis: a self-administered, self-reported history questionnaire. BMC Muscloskelet Disord 2007;102:1–9 [DOI] [PMC free article] [PubMed] [Google Scholar]
- 2.Otani K, Kikuchi S, Yabuki S, et al. Lumbar spinal stenosis has a negative impact on quality of life compared with other comorbidities: an epidemiological cross-sectional study of 1862 community-dwelling individuals. Sci World J 2013. Article 590652. Available at: http://www.ncbi.nlm.nih.gov/pmc/articles/PMC3885225/ Accessed January 29, 2014. [DOI] [PMC free article] [PubMed]
- 3.Zeigang F, Schiltenwolf M, Abel R, et al. Gait analysis does not correlate with clinical and MR imaging parameters in patients with symptomatic lumbar spinal stenosis. BMC Musculoskelet Disord 2008;9:89. [DOI] [PMC free article] [PubMed] [Google Scholar]
- 4.Sirvanci M, Bhatia M, Ganiyusufoglu KA, et al. Degenerative lumbar spinal stenosis: correlation with Oswestry Disability Index and MR imaging. Eur Spine J 2008;17:679–85 [DOI] [PMC free article] [PubMed] [Google Scholar]
- 5.Geisser ME, Haig AJ, Tong HC, et al. Spinal canal size and clinical symptoms among persons diagnosed with lumbar spinal stenosis. Clin J Pain 2007;23:780–5 [DOI] [PubMed] [Google Scholar]
- 6.Beattie PF, Meyers SP, Stratford P, et al. Associations between patient report of symptoms and anatomic impairment visible on lumbar magnetic response imaging. Spine 2000;25:819–28 [DOI] [PubMed] [Google Scholar]
- 7.Kikuchi S, Hasue M. Combined contrast studies in lumbar spine diseases. Myelography (peridurography) and nerve root infiltration. Spine 1988;13:1327–31 [DOI] [PubMed] [Google Scholar]
- 8.Sato K, Kikuchi S. Clinical analysis of two-level compression of the cauda equina and the nerve roots in lumbar spinal canal stenosis. Spine 1997;22:898–903 [DOI] [PubMed] [Google Scholar]
- 9.Katz JN, Dalgas M, Stucki G, et al. Degenerative lumbar spinal stenosis. Diagnostic value of the history and physical examination. Arthritis Rheum 1995;38:1236–41 [DOI] [PubMed] [Google Scholar]
- 10.Takayama B, Kikuchi S, Otani K, et al. Diagnostic value of gait loading test in the patients with lumbar canal stenosis. Rinsyoseikei 2010:45:587–95 (in Japanese) [Google Scholar]
- 11.Takahashi N, Kikuchi S, Yabuki S, et al. Diagnostic value of the lumbar extension test compared with the gait loading testin patients with lumbar spinal stenosis. A prospective cohort study. Rinsyoseikei 2011;46:333–40 (in Japanese) [Google Scholar]
- 12.Fairbank JC, Couper J, Davies JB, et al. The Oswestry low back pain disability questionnaire. Phys Ther 1980;66:271–3 [PubMed] [Google Scholar]
- 13.Straford PW, Binkley J, Solomon P, et al. Assessing change over time in patients with low back pain. Phys Ther 1994;74:528–33 [DOI] [PubMed] [Google Scholar]
- 14.Stucki G, Liang MH, Fossel AH, et al. Relative responsiveness of condition-specific and generic health status measures in degenerative lumbar spinal stenosis. J Clin Epidemiol 1995;48:1369–78 [DOI] [PubMed] [Google Scholar]
- 15.Stucki G, Daltroy L, Liang MH, et al. Measurement properties of a self-administered outcome measure in lumbar spinal stenosis. Spine 1996;21:796–803 [DOI] [PubMed] [Google Scholar]
- 16.Resnick DK, Choudhri TF, Dailey AT, et al. Guidelines for the performance of fusion procedures for degenerative disease of the lumbar spine, part 2: assessment of functional outcome. J Neurosurg Spine 2005;6:639–46 [DOI] [PubMed] [Google Scholar]
- 17.Roland M, Morris A. A study of the natural history of back pain, part I: development of a reliable and sensitive measure of disability in low back pain. Spine 1983;8:141–4 [DOI] [PubMed] [Google Scholar]
- 18.Roland M, Fairbank J. The Roland-Morris Disability Questionnaire and the Oswestry disability questionnaire. Spine 2000;25:3115–24 [DOI] [PubMed] [Google Scholar]
- 19.Ware JE, Sherbourne CD. The MOS-36-item short-form health survey (SF-36), part I: conceptual framework and item selection. Med Care 1992;30:473–83 [PubMed] [Google Scholar]
- 20.McHorney CA, Ware JE, Lu JF, et al. The MOS 36-item short-form health survey (SF-36), part III: test of data quality, scaling assumptions, and reliability across diverse patient groups. Med Care 1994;32:40–66 [DOI] [PubMed] [Google Scholar]
- 21.EuroQol Group. EuroQol: a new facility for the measurement of health-related quality of life. Health Policy 1990;3:199–208 [DOI] [PubMed] [Google Scholar]
- 22.Jansson KA, Nemeth G, Granath F, et al. Health-related quality of life (EQ-5D) before and one year after surgery for lumbar spinal stenosis. J Bone Joint Surg [Br] 2009;91:210–16 [DOI] [PubMed] [Google Scholar]
- 23.Sekiguchi M, Wakita T, Otani K, et al. Development and validation of a symptom scale for lumbar spinal stenosis. Spine 2012;37:232–9 [DOI] [PubMed] [Google Scholar]
- 24.Deyo RA, Centor RM. Assessing the responsiveness of functional scales to clinical change: an analogy to diagnostic test performance. J Chronic Dis 1986;39:897–906 [DOI] [PubMed] [Google Scholar]
- 25.Guyatt G, Walter S, Norman G. Measuring change over time: assessing the usefulness of evaluative instruments. J Chronic Dis 1987;40:171–8 [DOI] [PubMed] [Google Scholar]
- 26.Walsh TL, Hanscom B, Lurie JD, et al. Is a condition-specific instrument for patients with low back pain/leg symptoms really necessary? The responsiveness of the Oswestry Disability Index, MODEMS, and the SF-36. Spine 2003;28:607–15 [DOI] [PubMed] [Google Scholar]
- 27.Ostelo RW, Deyo RA, Stratford P, et al. Interpreting change scores for pain and functional status in low back pain: towards international consensus regarding minimal important change. Spine 2008;33:90–4 [DOI] [PubMed] [Google Scholar]