

Abstract
Background
The equations predicting maximal oxygen uptake (VO2max or peak) presently in use in cardiopulmonary exercise testing (CPET) softwares in Brazil have not been adequately validated. These equations are very important for the diagnostic capacity of this method.
Objective
Build and validate a Brazilian Equation (BE) for prediction of VO2peak in comparison to the equation cited by Jones (JE) and the Wasserman algorithm (WA).
Methods
Treadmill evaluation was performed on 3119 individuals with CPET (breath by breath). The construction group (CG) of the equation consisted of 2495 healthy participants. The other 624 individuals were allocated to the external validation group (EVG). At the BE (derived from a multivariate regression model), age, gender, body mass index (BMI) and physical activity level were considered. The same equation was also tested in the EVG. Dispersion graphs and Bland-Altman analyses were built.
Results
In the CG, the mean age was 42.6 years, 51.5% were male, the average BMI was 27.2, and the physical activity distribution level was: 51.3% sedentary, 44.4% active and 4.3% athletes. An optimal correlation between the BE and the CPET measured VO2peak was observed (0.807). On the other hand, difference came up between the average VO2peak expected by the JE and WA and the CPET measured VO2peak, as well as the one gotten from the BE (p = 0.001).
Conclusion
BE presents VO2peak values close to those directly measured by CPET, while Jones and Wasserman differ significantly from the real VO2peak.
Keywords: Oxygen Consumption, Forecasting, Respiratory Function Tests, Population, Brazil
Introduction
The maximum capacity of an individual to perform aerobic work is defined by the maximum oxygen consumption (VO2max or VO2peak), which is the product of cardiac output and arteriovenous oxygen difference during maximal effort1. The integrated responses of the respiratory, cardiovascular, and muscular systems in exercises involving large muscle groups increase up to a certain limit, which defines VO2peak or the maximum aerobic condition of the individual2. Several factors affect VO2peak determination, including age, gender, genetics, ethnicity, body composition, physical activity level, and exercise type3. VO2peak provides important diagnostic and prognostic information in various clinical situations. Classical studies using large samples of middle-aged and older people from different parts of the world have repeatedly found that the risk of mortality due to all causes in age groups ranging from 5 to 20 years can vary from 1-5-fold for individuals placed in the most extreme quartiles or quintiles of VO2peak4-9. Furthermore, VO2peak is an important independent prognostic marker in heart failure and is used as the indication criteria for cardiac transplantation10-12.
VO2peak can be calculated directly by the measurement of exhaled gases during cardiopulmonary exercise testing (CPET) or can be estimated using equations. According to Bruce et al13, in a prediction equation, VO2peak is dependent on pretest physical characteristics, such as gender, age, physical activity level, weight, and height. In turn, in an estimation equation, VO2peak is dependent on variables obtained during an exercise test (treadmill test), including speed, inclination, load, duration, and heart rate. For the prediction or estimation equation, it is important to understand the structural and local characteristics of the population for which the equation is created or validated; such equations are created with the goal of obtaining a VO2peak value closest to the actual oxygen consumption3,14. The VO2peak values measured directly with CPET can be compared with the VO2peak values predicted for a particular age group3. Of note is that the prediction of VO2peak for normality is commonly performed using equations that are not validated for the Brazilian population. The two equations most often used in CPET softwares in Brazil include the equation reported by Jones and Campbell15, which has been modified for the treadmill, and the prediction algorithm of Wasserman et al3. There is empirical evidence16 that these equations overestimate the predicted VO2peak values when compared with direct measurements performed with CPET.
Therefore, the present study aimed to construct and validate an equation derived from the Brazilian population to predict VO2peak and to compare this equation with the equation of Jones and Campbell15 and the algorithm of Wasserman et al3.
Methods
Study sample
A total of 5,382 individuals from across the state of Paraíba were evaluated. These individuals were referred to a private clinic considered as a reference for CPET in the city of João Pessoa and for the performance and evaluation of CPET between February 2007 and January 2013. Figure 1 shows the flowchart for study group selection.
Figure 1.
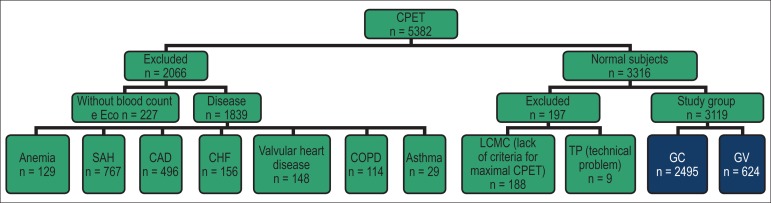
Flowchart for study population selection.
CAD: chronic arterial disease; COPD: chronic obstructive pulmonary disease; CG: construction group; VG: validation group; SAH: systemic arterial hypertension; CHF: congestive heart failure; TP: technical problems; LCMC: lack of the criteria for maximal CPET; CPET: cardiopulmonary exercise testing.
From the total sample, 2,066 individuals were excluded based on the following criteria: 227 did not undergo complete blood count and 2D-color Doppler echocardiography while performing CPET and 1,839 patients were diagnosed with hypertension and are on medication (41.71%), coronary artery disease (26.97%), heart failure (8.48%), valvular heart disease (8.05%), anemia (7.01%), chronic obstructive pulmonary disease (6.20%), and asthma (1.57%). The normal group comprised 3,316 individuals, of which 188 were excluded because they did not reach the maximum test criterion and/or because of the lack of agreement on VO2peak measurements between evaluators. In addition, nine subjects were excluded due to technical problems.
The study population comprised 3,119 asymptomatic individuals not taking cardiovascular medication; the population had undergone complete blood count, 12-lead electrocardiography at rest, and 2D-color Doppler electrocardiography with flow mapping and exhibited normal pretest spirometry values and CPET without pathological changes. All participants signed an informed consent form to enroll in the study. This study was approved by the Platform Brazil and by the Research Ethics Committee of the Hospital de Clínicas de Porto Alegre, under the protocol No. 13-0474. Among the population selected, 2,495 individuals (80%) comprised the construction group (CG) of the equation, and 624 (20%) were randomly allocated by the SPSS software to an independent internal validation group (VG).
Cardiopulmonary exercise test
The equipment used for the measurement of exhaled gases was a Cortex Metalyzer 3B (Leipzig, Germany). Measurements were obtained breath by breath, and data were analyzed using an ErgoPC Elite system (Micromed, Brasília, Brazil). All examinations were performed in the same room, and the environment was monitored with a BAR208HGA meteorological station (Oregon Scientific, USA); an average temperature of 24.22ºC, relative humidity of 63.73%, and atmospheric pressure of 1,009.25 hPa (757 mmHg) were maintained. Calibration was performed periodically with a 3-L syringe to adjust for the correction factor that determines the respiratory volume. The exhaled fractions of oxygen (EFO2) were measured with a rapid response and high-precision electrochemical cell (0.1 vol.%), and the exhaled fractions of carbon dioxide (EFCO2) were measured using a high-precision nondispersive infrared analyzer. Calibration was performed using a known gas mixture of O2 (12.00%) and CO2 (4.99%) and was balanced with nitrogen (N2). Ventilatory variables were recorded instantly and subsequently calculated for an average time of 10 s.
All tests were performed on a Centurion-200 treadmill (Micromed, Brasília, Brazil) by the same investigator. In these tests, increasing exercise loads were applied using a ramp protocol, which was adjusted for each individual; the test should be completed within 8-12 min. All subjects received prior guidance on the CPET methodology and underwent a symptom-limited exercise test following the criteria for maximality, a modified Borg scale of 9-10, and a respiratory quotient (R) > 1.0917-19.
Oxygen consumption
Oxygen consumption was recorded after agreement between two CPET experts, both of whom were working independently and were blinded to the study results. VO2peak was measured at the highest point in the final moments of maximum effort, considering a sampling interval of 20 s and extrapolation for 1 min (for most of the population tested). For this reason, we used the term VO2peak throughout the study3,17,19. Of note is that some individuals reached the highest VO2 value at the plateau of the curve, regardless of the increased workload (VO2max)3,18,20.
Equations used for comparison
The Jones equation15 that was modified for the treadmill was as follows: VO2max predicted for male subjects = [60.0 - (0.55 × age)] × 1.11; VO2max predicted for female subjects = [48.0 - (0.37 age)] × 1.11.
The Wasserman algorithm for the prediction of VO2max in men and women was entered into a Microsoft Excel spreadsheet according to previous guidelines3.
For the construction of BE, we used the following multivariate regression model: Y = βo + β1X1 + β2X2 + β3X3 + β4X4 + ε for the variables of gender, age, body mass index (BMI), and physical activity level. Analysis of variance and the estimation of regression were performed using the stepwise method. The coefficient of determination (R2) was calculated for each factor to determine the importance, sequence, and percentage of participation for each variable in the construction of the model for the prediction of VO2peak. In the model, the gender-coded values were as follows: men = 1 and women = 2. The physical activity level was assessed according to the guidelines established by ACSM21. We modified these guidelines and defined them as follows: a) sedentary subjects are those who do not practice any regular exercise or who practice exercise for < 3 days a week or whose daily or work activities generate an energy expenditure of < 3.2 METs; b) active subjects are those who exercise 3-6 days a week over 3 months or whose daily or work activities generate an energy expenditure between 3.2 and 10.2 METs; c) athletes are those who practice sports at the competition level, with a regular daily training of >2 h and with an energy expenditure of > 10.3 METs. Subjects were allocated to one of these categories according to the responses to a pre-CPET questionnaire containing questions on their physical activity history: total period of training, regularity, frequency, duration and intensity, work history, history of physical activities at home; there was an emphasis on the demand required for each activity. In the equation, these categories were coded as follows: sedentary = 1; active = 2; and athletes = 3. The model was established as follows: Y = βo + β1X1 + β2X2 + β3X3 + β4X4 + ε; where Y = VO2max; β = coefficient of the regression equation with independent variables; X1 = gender; X2 = age; X3 = BMI; X4 = physical activity; ε = random error.
Statistical analysis
All data were entered into a database by a single trained investigator for later analysis, independent of the data collected. Data were analyzed using the SPSS Statistics software, version 19 (IBM Company, USA). Continuous variables were represented as mean ± standard deviation, and categorical variables were represented as percentages. The residues of the regression of VO2 indicated a normal distribution curve using the Kolmogorov-Smirnov test (p = 0.097). To select variables for the construction of the equation model, we used the stepwise method. This method applied the specific criteria to include variables with a significance of ≤ 5% in the F-test and to exclude variables with a significance of 10% from the regression and R2 of each variable. For equation construction, a multivariate regression model was used, and for comparison of the mean, the Student's t-test was used. Equations were evaluated using the estimated standard error (ESE), total error (TE = square root of Σ of measured VO2max - predicted VO2max/n), percentage of TE [%TE = 100 (TE/average measured VO2max)]. The correlation was calculated using the intraclass correlation coefficient (ICC). For comparisons between equations, the Student's paired t-test and Wilcoxon test were used. The distribution of positive and negative equation residues was represented as absolute values and percentages. Internal validation was evaluated using Cronbach's alpha. An error probability (α) of < 5% was considered significant.
Results
The relative participation of physical activity (31.70%), age (26.70%), gender (23.90%), and BMI (11.10%) was important for the calculation of VO2peak using analysis of variance (p < 0.001), and the order of importance is represented by the respective percentage. Using the stepwise method, height and weight variables were not significant and therefore were excluded from the construction of the equation. The multivariate regression model applied to CG generated the BE: VO2peak = 53.478 + (-7.518 × gender) + (-0.254 × age) + (0.430 × BMI) + (6,132 × physical activity), with an R2 of 0.679 and p < 0.001.
As described in the "Methods" section and as shown in Figure 1, gender, age, and anthropometric measurements were not significantly different in the excluded group (n = 2,263) when compared with CG and VG. Both CG and VG (Tables 1 and 2) showed a mean age of 42 years, with a slight predominance of men, the majority of which were overweight and sedentary. In the general population, men (n = 1,624) and women (n = 1,495) had a mean measured VO2peak value of 33.88 ± 9.28 mL.kg-1.min-1 and 24.47 ± 7.24 mL.kg-1.min-1, respectively. For active men (n = 942) and women (n = 579), the mean measured VO2peak value was 37.66 ± 9.04 mL.kg-1.min-1 and 28.51 ± 8.36 mL.kg-1.min-1, respectively. For sedentary men (n = 682) and women (n = 916), the mean measured VO2peak value was 28.66 ± 6.74 mL.kg-1.min-1 and 21.92 ± 4.96 mL.kg-1.min-1, respectively. The scatter plot in Figure 2 shows that VO2peak has a moderate inverse correlation with age in both men and women (R2 = 0.268, p < 0.001). Table 3 shows the results of complete blood count, 2D-color Doppler electrocardiography with flow mapping, spirometry, and CPET and the maximum test criterion achieved.
Table 1.
General profile of the construction group (n = 2,495)
| Characteristics | Data (Mean ± SD or %) | Minimum | Maximum | |
|---|---|---|---|---|
| Age (years) | 42.57 ± 15.00 | 8 | 90 | |
| Gender | Male | 1,286 (51.5) | - | - |
| Female | 1,209 (48.5) | - | - | |
| Weight (Kg) | 73.71 ± 16.02 | 37.5 | 149.5 | |
| Height (m) | 1.65 ± 0.10 | 1.33 | 2.00 | |
| BMI | 27.15 ± 5.00 | 14.53 | 66.93 | |
| Physical activity | Sedentary | 1,280 (51.3) | - | - |
| Active | 1,107 (44.4) | - | - | |
| Athletic | 108 (4.3) | - | - |
SD: standard deviation; BMI: body mass index.
Table 2.
General profile of the validation group (n = 624)
| Characteristics | Data (Mean ± SD or %) | Minimum | Maximum | |
|---|---|---|---|---|
| Age (years) | 41.28 ± 14.47 | 11 | 84 | |
| Gender | Male | 338 (54.2) | - | - |
| Female | 286 (45.8) | - | - | |
| Weight (Kg) | 74.10 ± 15.85 | 36.8 | 134.7 | |
| Height (m) | 1.65 ± 0.10 | 1.38 | 1.93 | |
| BMI | 27.10 ± 5.02 | 16.20 | 51.70 | |
| Physical activity | Sedentary | 318 (51.0) | - | - |
| Active | 278 (44.6) | - | - | |
| Athletic | 28 (4.5) | - | - |
SD: standard deviation; BMI: body mass index.
Figure 2.

Scatter plot of oxygen consumption by gender.
Table 3.
Complete blood count, 2D-color Doppler echocardiography, spirometry, and CPET results
| Variables | Construction (n = 2,495) | Validation (n = 624) | p value | ||||||
|---|---|---|---|---|---|---|---|---|---|
| Mean | ± SD | Minimum | Maximum | Mean | ± SD | Minimum | Maximum | ||
| Hemoglobin (g/dL) | 13.65 | 0.97 | 12.00 | 16.90 | 13.60 | 0.96 | 12.00 | 15.90 | 0.307 |
| Hematocrit (%) | 42.45 | 3.35 | 37.00 | 50.80 | 42.63 | 3.13 | 38.00 | 51.80 | 0.183 |
| Ejection fraction (%) | 67.02 | 6.05 | 56.00 | 79.00 | 66.95 | 6.18 | 55.00 | 80.00 | 0.808 |
| FVC (L) | 3.67 | 0.97 | 1.76 | 6.83 | 3.66 | 0.99 | 1.81 | 6.71 | 0.859 |
| FEV1 (L) | 3.15 | 0.80 | 1.66 | 5.65 | 3.14 | 0.81 | 1.74 | 5.32 | 0.719 |
| FEV1/FVC (%) | 87.18 | 4.79 | 80.12 | 95.85 | 87.07 | 4.71 | 80.20 | 95.39 | 0.589 |
| Speed (Km/h) | 7.72 | 1.66 | 3.20 | 17.20 | 7.84 | 1.72 | 4.0 | 15.50 | 0.117 |
| Inclination (%) | 9.68 | 3.02 | 1.50 | 19.00 | 9.65 | 2.98 | 2.00 | 21.00 | 0.908 |
| Duration of the effort (s) | 535.55 | 124.0 | 313 | 1169 | 531.53 | 125.0 | 312 | 1090 | 0.472 |
| Max HR (bpm) | 173.26 | 15.44 | 119 | 209 | 175.12 | 16.90 | 125 | 208 | 0.013 |
| Max SBP (mmHg) | 185.82 | 23.86 | 122 | 257 | 184.36 | 22.76 | 131 | 254 | 0.157 |
| Max DBP (mmHg) | 89.78 | 12.11 | 64 | 126 | 88.84 | 11.03 | 66 | 123 | 0.063 |
| Respiratory coefficient ® | 1.15 | 0.06 | 1.10 | 1.38 | 1.16 | 0.07 | 1.10 | 1.35 | 0.356 |
| Max MV (L/min) | 75.32 | 15.78 | 33.10 | 121.9 | 74.99 | 15.55 | 39.50 | 118.10 | 0.639 |
| Abs VO2peak (L/min) | 2.16 | 0.82 | 1.02 | 4.82 | 2.22 | 0.84 | 0.99 | 4.98 | 0.087 |
FVC: forced vital capacity; SD: standard deviation; Max HR: maximum heart rate; Max DBP: maximum diastolic blood pressure; Max SBP: maximum systolic blood pressure; R: respiratory quotient; FEV1: forced expiratory volume in 1 s; Max MV: maximum minute ventilation; Abs VO2peak: absolute peak oxygen consumption.
Table 4 shows that the VO2peak values measured with CPET are very close to those predicted by BE but are more distant from those measured with the Wasserman algorithm. Moreover, the Jones equation overestimates the VO2peak values. The lowest values for ESE, ET, and ET% indicated that BE showed the best performance in predicting the VO2peak values in both groups. The means of the measured and predicted VO2peak values using BE were not significantly different. In contrast, the Wasserman algorithm and Jones equation revealed significant differences in CG and VG (Table 5). The distribution of equation residues indicated similar positive and negative values for BE and predominantly negative values for both the Wasserman algorithm and Jones equation. This finding indicates that the latter equations overestimate the mean VO2peak values (Table 6). Intraclass correlation analysis indicated a good correlation between the measured VO2peak and BE (0.894), the Wasserman algorithm (0.846), and the Jones equation (0.766) in both CG and VG. Moreover, BE showed excellent internal validation, with a Cronbach's alpha of 0.826.
Table 4.
Statistical values of the equations in CG and VG
| Phase | Statistic measurements | Measured VO2 | BE | Jones | Wasserman |
|---|---|---|---|---|---|
| Construction | Mean | 29.22 | 29.22 | 38.41 | 32.53 |
| Minimum | 12.93 | 12.78 | 13.32 | 13.86 | |
| Maximum | 65.56 | 58.81 | 61.72 | 65.38 | |
| Standard deviation | 9.57 | 7.88 | 8.39 | 8.54 | |
| ESE | - | 4.46 | 6.54 | 5.77 | |
| TE | - | 5.38 | 12.07 | 7.41 | |
| %TE | - | 18.43 | 41.30 | 25.36 | |
| Validation | Mean | 29.92 | 29.80 | 39.23 | 33.25 |
| Minimum | 12.21 | 11.23 | 15.32 | 16.04 | |
| Maximum | 66.52 | 54.32 | 59.27 | 59.25 | |
| Standard deviation | 9.82 | 7.87 | 8.27 | 8.59 | |
| ESE | - | 4.32 | 6.44 | 5.89 | |
| TE | - | 5.40 | 12.23 | 7.64 | |
| %TE | - | 18.05 | 40.87 | 25.55 |
EB: equation derived from a Brazilian population; ESE: estimated standard error; TE: total error; %TE: percentage of total error; VO2: oxygen consumption. VO2peak values were expressed as mL.kg−1.min−1.
Table 5.
Comparison of measured and predicted peak VO2 values using different equations in CG and VG
| Comparison | CG | VG | ||
|---|---|---|---|---|
| 95% CI | p value | 95% CI | p value* | |
| VO2peak × Brazilian | -0.213 a 0.213 | 0.999 | -0.302 a 0.547 | 0.571 |
| VO2peak × Wasserman | -3.568 a -3.047 | 0.001 | -3.877 a 2.794 | 0.001 |
| VO2peak × Jones | 9.492 a -8.877 | 0.001 | -9.937 a -8.690 | 0.001 |
Student’s paired t-test. CI: confidence interval;
VO2peak: peak oxygen consumption; CG: construction group; VG: validation group.
Table 6.
Distribution of positive and negative equation residues in CG and VG
| Residues | CG | VG | ||||||||||
|---|---|---|---|---|---|---|---|---|---|---|---|---|
| National | Wasserman | Jones | National | Wasserman | Jones | |||||||
| n | % | n | % | n | % | n | % | n | % | n | % | |
| Negative | 1,243 | 49.82 | 1,805 | 72.34 | 2,186 | 87.62 | 315 | 50.48 | 441 | 70.67 | 547 | 87.66 |
| Positive | 1,252 | 50.18 | 690 | 27.66 | 309 | 12.38 | 309 | 49.52 | 183 | 29.33 | 77 | 12.34 |
| p value* | 0.857 | 0.001 | 0.001 | 0.810 | 0.001 | 0.001 | ||||||
Chi-square test.
CG: construction group; VG: validation group.
These equations were analyzed according to age subgroups (up to 20, 21-30, 31-40, 41-50, 51-60, 61-70, 71-80, and >81 years), gender (male and female), BMI (classified as < 18.5, underweight; 18.5-24.9, normal; 25.0-29.9, overweight, 30.0-39.9, obesity types I and II; ≥40.0, obesity type III) and physical activity (sedentary, active, and athletic). BE showed the best performance in predicting the VO2peak values in these subgroups when compared with the Wasserman algorithm and Jones equation.
Discussion
The BE incorporated several parameters, including age, gender, body composition, and physical activity level. This equation was able to predict VO2peak with a very good accuracy when predicted VO2 was compared with VO2peak measured by CPET. BE was constructed from a sample comprising 2,495 apparently healthy subjects with a wide variation in weight and age. In addition, these subjects exhibited different physical activity levels. Notwithstanding this variability, BE was superior to other well-known equations reported in the literature, such as the equation reported by Jones-known as the Jones equation, that we modified for the treadmill-and was more accurate than the Wasserman algorithm.
Predicting VO2peak is challenging mainly because factors such as genetic differences, ethnicity, habits, body size, and physical activity levels of a particular population may differ from the population in which the equation was initially tested1,3,14,21-23. Both the prediction and estimation equations may overestimate the actual oxygen consumption. For this reason, the distinction between the prediction and estimation equations for the calculation of VO2peak is necessary. In the prediction equation, VO2peak is dependent on pretest physical characteristics, including age, gender, body composition, and physical activity level. In the estimation equation, VO2peak is dependent on variables obtained during an exercise test, including speed, inclination, load, and test duration13. It should be emphasized that both the equation reported by Jones and Campbell15 and the algorithm of Wasserman et al3 are prediction equations, and that none of them have been previously validated in Brazil. In fact, our results indicate that the overestimation of the predicted VO2peak values can induce a systematic error in the final CPET report, and this problem can routinely occur in Brazil, considering that the CPET softwares commercially available use these equations.
We emphasize that several factors influence the calculation of VO2peak, including age, gender, body size, physical activity level, and exercise type3. Bruce et al13 evaluated 295 normal subjects (138 men) using multiple regression analysis to identify whether gender, age, physical activity, weight, and height helped predict the VO2peak values during treadmill exercises with a ramp protocol, and they observed that gender and age were the most important variables, followed by physical activity, weight, and height. In the present study, the importance of these variables, in descending order, was as follows: physical activity, age, gender, and BMI. This difference in the results may be due to three factors; the first factor is related to differences in the protocols used. In this regard, Myers et al23 demonstrated that the Bruce protocol estimates higher VO2peak values when compared with the individualized ramp protocol. The second factor involves the detailed profiling of physical activities in our study, including type, frequency, duration, intensity, and their uniform distribution in relation to gender, age, and BMI. The third factor is related to the sample size, in which a larger number of subjects may have a profile similar to that of the patient evaluated, thereby allowing a better visualization of these differences3,14.
Aspenes et al20 examined a cohort of 4,631 individuals in which 91% were active subjects or athletes; they reported a VO2peak of 44.32 mL.kg-1.min-1 and 35.88 mL.kg-1.min-1 for men and women, respectively. When compared with the active subjects from the present study, this difference can be explained mainly by the gas analyzer used in the Norwegian study (portable MetaMax), whereby the values used for validation were 8% higher than those of the gold standard (pouch system formulated by Douglas)24. Moreover, this difference may be related to the higher stature and to genetic factors in the Norwegian population. Another Norwegian study (Edvardsen et al18) involving predominantly active subjects found the VO2peak values of 39.74 mL.kg-1.min-1 and 32.20 mL.kg-1.min-1 for men and women, respectively, which were slightly higher than the values obtained in the present study. Nelson et al19 evaluated active Canadian men and found VO2peak values similar to those obtained in the present study. An American study by Davis et al25 involved sedentary subjects training on a cycle ergometer corrected by the factor 1.11 for the treadmill; this study obtained the VO2peak values of 37.26 mL.kg-1.min-1and 28.10 mL.kg-1.min-1 for men and women, respectively. These values were 10% higher than those obtained for the general population in the present study. This result may be due to the higher BMI of our study sample and the use of the correction factor.
A Brazilian study by Neder et al26 investigated a small group from the city of São Paulo. The sample comprised sedentary subjects who trained on a cycle ergometer. When the correction factor for the treadmill was applied, the VO2peak values obtained were 31.24 mL.kg-1.min-1and 23.65 mL.kg-1.min-1 for men and women, respectively, which were slightly below the values obtained in our study. Using another equation developed by Jones et al27, VO2max = (0.046 [height] - 0.021 [age] - 0.62 [gender] - 4.31), with a score of 0 for men and 1 for women), we found negative VO2peak values for older people with short stature; therefore, this equation was inadequate for this population group.
The application of the Jones equation to our study group overestimated VO2peak for 87% of subjects, of which 31.4% exhibited values higher than the mean VO2peak values measured. In a series by the same author28 involving 1,071 individuals (731 men), the prediction of the maximum working capacity yielded values closer to those for the measured capacity. However, VO2peak was not reported in this population. When the Jones equation was applied to the older age group (> 71 years), the percentage of total error was greater than 210. This may be due to the fact that values calculated using both prediction and estimation equations had a wider variation with aging29,30. Even so, we can expect a reasonable prediction power when this equation is applied to the population for which it was derived; however, when analysis was performed using our sample, the overestimation was significant16.
Similarly, the Wasserman algorithm was significantly different from BE. Overestimations were observed in the VO2peak values for 71% subjects, yielding values 11.3% higher than those measured in our sample. This may be due to differences between the populations from which these equations were derived31-33. The population from which the Wasserman algorithm was derived was less healthy and belonged to an older age group. In the population from which BE was derived, the physical activity level represented the most important variable for the calculation of VO2peak.
In addition, the Jones equation and Wasserman algorithm were derived from tests on a cycle ergometer, with the use of a correction factor of 1.11 to predict the VO2peak values on the treadmill, and this factor may have contributed to the increased prediction error.
Limitations
The evaluation of a population from across the state of Paraíba may be a limiting factor for the extrapolation of the results to larger population groups. However, the study group comprised white, black, and indigenous individuals, and their miscegenation thereof and individuals from the other states of Brazil. Importantly, the data from the present study were not significantly different from the IBGE data34 when considering the pairing of age groups (%) (p = 0.401). Similarly, the distribution of gender-related data was similar to that of IBGE34. Our study sample exhibited a higher prevalence of overweight individuals, and this result was similar to that reported by Vigitel35, corresponding to 51% of the Brazilian population. According to Vigitel35, physical activity through regular exercise and through commuting to work was accomplished by 47.7% of the population. This result is similar to the results obtained for the active group of our sample. Therefore, a certain similarity was observed between the population studied and the Brazilian population as a whole. However, the performance of an external validation study involving groups from other regions of the country to corroborate our findings is essential.
We also highlight that BMI is an imprecise parameter for the assessment of body structure, because it does not take into consideration the amount of lean mass, which is critical for energy balance. However, when evaluating the importance of variables that compose an equation using the stepwise method, BMI showed increased statistical relevance in comparison with weight and height; therefore, this parameter was incorporated into the equation.
Conclusions
The equation derived from the Brazilian population was able to predict VO2peak and showed a very good performance in the internal validation test. It contributes to the reduction of systematic errors that occur when using equations that overestimate the VO2peak values with CPET, such as the Jones equation and Wasserman algorithm. Such equations when used for the Brazilian population should be examined critically and compared with equations constructed with local data.
Footnotes
Author contributions
Conception and design of the research: Almeida AEM, Stein R, Stefani CM, Nascimento JA, Santos AC, Ribeiro JP; Data acquisition: Almeida AEM, Almeida NM; Analysis and interpretation of the data: Almeida AEM, Stein R, Stefani CM, Nascimento JA, Santos AC, Ribeiro JP; Statistical analysis: Almeida AEM, Stefani CM, Nascimento JA, Stein R; Funding acquisition: Stein R; Writing of the manuscript: Almeida AEM, Stein R, Stefani CM, Almeida NM, Nascimento JA, Santos AC; Critical revision of the manuscript for intellectual content: Almeida AEM, Stein R.
Potential Conflict of Interest
No potential conflict of interest relevant to this article was reported.
Sources of Funding
This study was partially funded by CNPq.
Ricardo Stein is Level 2 CNPq investigator.
Study Association
This article is part of the Master Dissertation submitted by Charles Moraes Stefani from Universidade Federal do Rio Grande do Sul.
References
- 1.Fleg JL, Piña IL, Balady GJ, Chaitman BR, Fletcher B, Lavie C, et al. Assessment of functional capacity in clinical and research applications: an advisory from the committee on exercise, rehabilitation, and prevention, council on clinical cardiology, American Heart Association. Circulation. 2000;102(13):1591–1597. doi: 10.1161/01.cir.102.13.1591. [DOI] [PubMed] [Google Scholar]
- 2.Araújo CG, Herdy AH, Stein R. Medida do consumo máximo de oxigênio: valioso marcador biológico na saúde e na doença. Arq Bras Cardiol. 2013;100(4):e51–e53. [PubMed] [Google Scholar]
- 3.Wasserman K, Hansen JE, Sue DY, Stringer WW, Whipp BJ. Principles exercise testing and interpretation. 4th ed. Philadelphia: Lippincott Williams & Wilkins; 2005. pp. 80-1, 160-7. [Google Scholar]
- 4.Kokkinos P, Myers J, Faselis C, Panagiotakos DB, Doumas M, Pittaras A, et al. Exercise capacity and mortality in older men: a 20-year follow-up study. Circulation. 2010;122(8):790–797. doi: 10.1161/CIRCULATIONAHA.110.938852. [DOI] [PubMed] [Google Scholar]
- 5.Myers J, Prakash M, Froelicher V, Do D, Partington S, Atwood JE. Exercise capacity and mortality among men referred for exercise testing. N Engl J Med. 2002;346(11):793–801. doi: 10.1056/NEJMoa011858. [DOI] [PubMed] [Google Scholar]
- 6.Gulati M, Pandey DK, Arnsdorf MF, Lauderdale DS, Thisted RA, Wicklund RH, et al. Exercise capacity and the risk of death in women: the St James women Take Heart project. Circulation. 2003;108(13):1554–1559. doi: 10.1161/01.CIR.0000091080.57509.E9. [DOI] [PubMed] [Google Scholar]
- 7.Wei M, Kampert JB, Barlow CE, Nichaman MZ, Gibbons LW, Paffenbarger RS, Jr, et al. Relationship between low cardiorespiratory fitness and mortality in normal weight, overweight and obese men. JAMA. 1999;282(16):1547–1553. doi: 10.1001/jama.282.16.1547. [DOI] [PubMed] [Google Scholar]
- 8.Erikssen G, Bodegard J, Bjornholt JV, Liestøl K, Thelle DS, Erikssen J. Exercise testing of healthy men in a new perspective: from diagnosis to prognosis. Eur Heart J. 2004;25(11):978–986. doi: 10.1016/j.ehj.2004.04.009. [DOI] [PubMed] [Google Scholar]
- 9.Mora S, Redberg RF, Cui Y, Whiteman MK, Flaws JA, Sharrett AR, et al. Ability of exercise testing to predict cardiovascular and all-cause death in asymptomatic women: a 20-years follow-up of the lipid research clinics prevalence study. JAMA. 2003;290(12):1600–1607. doi: 10.1001/jama.290.12.1600. [DOI] [PubMed] [Google Scholar]
- 10.Piña IL, Apstein CS, Balady GJ, Belardinelli R, Chaitman BR, Duscha BD, et al. American Heart Association Committee on exercise, rehabilitation, and prevention. Exercise and heart failure: a statement from the American Heart Association Committee on exercise, rehabilitation, and prevention. Circulation. 2003;107(8):1210–1225. doi: 10.1161/01.cir.0000055013.92097.40. [DOI] [PubMed] [Google Scholar]
- 11.McMurray JJ, Adamopoulos S, Anker SD, Auricchio A, Böhm M, Dickstein K, et al. ESC Committee for Practice Guidelines. ESC Guidelines for the diagnosis and treatment of acute and chronic heart failure 2012: the Task Force for the Diagnosis and Treatment of Acute and Chronic Heart Failure 2012 of the European Society of Cardiology. Developed in collaboration with the Heart Failure Association (HFA) of the ESC. Eur Heart J. 2012;33(14):1787–1847. doi: 10.1093/eurheartj/ehs104. Erratum in Eur Heart J. 2013;34(2):158. [DOI] [PubMed] [Google Scholar]
- 12.Hunt SA, Abraham WT, Chin MH, Feldman AM, Francis GS, Ganiats TG, et al. American College of Cardiology. American Heart Association Task Force on Practice Guidelines. American College of Chest Physicians. International Society for Heart and Lung Transplantation. Heart Rhythm Society ACC/AHA 2005 Guideline Update for the Diagnosis and Management of Chronic Heart Failure in the Adult: a report of the American College of Cardiology/American Heart Association Task Force on Practice Guidelines (Writing Committee to Update the 2001 Guidelines for the Evaluation and Management of Heart Failure): developed in collaboration with the American College of Chest Physicians and the International Society for Heart and Lung Transplantation: endorsed by the Heart Rhythm Society. Circulation. 2005;112(12):e154–e235. doi: 10.1161/CIRCULATIONAHA.105.167586. [DOI] [PubMed] [Google Scholar]
- 13.Bruce RA, Kusumi F, Hosmer D. Maximal oxygen intake and normographic assessment of functional aerobic impairment in cardiovascular disease. Am Heart J. 1973;85(4):546–562. doi: 10.1016/0002-8703(73)90502-4. [DOI] [PubMed] [Google Scholar]
- 14.Myers JN. Essentials of cardiopulmonary exercise testing. Champaign, III: Human Kinetics; 1996. pp. 4–8. [Google Scholar]
- 15.Jones NL, Campbell EJ. Clinical execise testing. Philadelphia: Saunders; 1982. pp. 202–202. [Google Scholar]
- 16.Almeida AE, Miranda NF, Nascimento JA, Cavalcanti DM, Ribeiro JP, Stein R. Equação brasileira de previsão de VO2 máximo no teste de exercício cardiopulmonar. [abstract] Rev DERC. 2011;17(4):122–122. [Google Scholar]
- 17.Guazzi M, Adams V, Conraads V, Halle M, Mezzani A, Vanhees L, et al. European Association for Cardiovascular Prevention. Rehabilitation American Heart Association EACPR/AHA Scientific Statement. Clinical recommendations for cardiopulmonary exercise testing data assessment in specific patient populations. Circulation. 2012;126(18):2261–2274. doi: 10.1161/CIR.0b013e31826fb946. [DOI] [PMC free article] [PubMed] [Google Scholar]
- 18.Edvardsen E, Scient C, Hansen BH, Holme IM, Dyrstad SM, Anderssen SA. Reference values for cardiorespiratory response and fitness on the treadmill in a 20- to 85- year-old population. Chest. 2013;144(1):241–248. doi: 10.1378/chest.12-1458. [DOI] [PubMed] [Google Scholar]
- 19.Nelson MD, Petersen SR, Dlin RA. Effects of age and counseling on the cardiorespiratory response to graded exercise. Med Sci Sports Exerc. 2010;42(2):255–264. doi: 10.1249/MSS.0b013e3181b0e534. [DOI] [PubMed] [Google Scholar]
- 20.Aspenes ST, Nilsen TI, Skaug EA, Bertheussen GF, Ellingsen Ø, Vatten L, et al. Peak oxygen uptake and cardiovascular risk factors in 4631 healthy women and men. Med Sci Sports Exerc. 2011;43(8):1465–1473. doi: 10.1249/MSS.0b013e31820ca81c. [DOI] [PubMed] [Google Scholar]
- 21.ACSM's Guidelines for Exercise Testing and Prescription. 7th ed. Philadelphia: Lippincott Williams & Wilkins; 2006. p. 4. [Google Scholar]
- 22.Franklin BA. Pitfalls in estimating aerobic capacity from exercise time or work load. Appl Cardiol. 1986;14:25–26. [Google Scholar]
- 23.Myers J, Buchanan N, Walsh D, Kraemer M, McAuley P, Hamilton-Wessler M, et al. Comparison of the ramp versus standard exercise protocols. J Am Coll Cardiol. 1991;17(6):1334–1342. doi: 10.1016/s0735-1097(10)80144-5. [DOI] [PubMed] [Google Scholar]
- 24.Steene-Johannessen J, Kolle E, Anderssen SA, Andersen LB. Cardiovascular disease risk factors in a population-based sample of Norwegian children and adolescents. Scand J Clin Lab Invest. 2009;69(3):380–386. doi: 10.1080/00365510802691771. [DOI] [PubMed] [Google Scholar]
- 25.Davis JA, Storer TW, Caiozzo VJ, Pham PH. Lower reference limit for maximal oxygen uptake in men and women. Clin Physiol Funct Imaging. 2002;22(5):332–338. doi: 10.1046/j.1475-097x.2002.00440.x. Erratum in Clin Physiol Funct Imaging. 2003;23(1):62. [DOI] [PubMed] [Google Scholar]
- 26.Neder JA, Nery LE, Peres C, Whipp BJ. Reference values for dynamic responses to incremental cycle ergometry in males and females aged 20 to 80. Pt 1Am J Respir Crit Care Med. 2001;164(8):1481–1486. doi: 10.1164/ajrccm.164.8.2103007. [DOI] [PubMed] [Google Scholar]
- 27.Jones NL, Makrides L, Hitchcock C, Chypchar T, McCartney N. Normal standards for an incremental progressive cycle ergometer test. Am Rev Respir Dis. 1985;131(5):700–708. doi: 10.1164/arrd.1985.131.5.700. [DOI] [PubMed] [Google Scholar]
- 28.Jones NL, Summers E, Killian KJ. Influence of age and stature on exercise during incremental cycle ergometry in men and women. Am Rev Respir Dis. 1989;140(5):1373–1380. doi: 10.1164/ajrccm/140.5.1373. [DOI] [PubMed] [Google Scholar]
- 29.Foster C, Crowe AJ, Daines E, Dumit M, Green MA, Lettau S, et al. Predicting functional capacity during treadmill testing independent of exercise protocol. Med Sci Sports Exerc. 1996;28(6):752–756. doi: 10.1097/00005768-199606000-00014. [DOI] [PubMed] [Google Scholar]
- 30.Peterson MJ, Pieper CF, Morey MC. Accuracy of VO2max prediction equations in older adults. Med Sci Sports Exerc. 2003;35(1):145–149. doi: 10.1097/00005768-200301000-00022. [DOI] [PubMed] [Google Scholar]
- 31.Rondon MU, Forjaz CL, Nunes N, do Amaral SL, Barretto AC, Negrão CE. Comparação entre prescrição de intensidade de treinamento físico baseado na avaliação ergométrica convencional e na ergoespirométrica. Arq Bras Cardiol. 1998;70(3):159–166. doi: 10.1590/s0066-782x1998000300004. [DOI] [PubMed] [Google Scholar]
- 32.Greiwe JS, Kaminsky LA, Wharley MH, Dwyer GB. Evaluation of the ACSM submaximal ergometer test for estimating VO2max. Med Sci Sports Exerc. 1995;27(9):1315–1320. [PubMed] [Google Scholar]
- 33.Ahmadian HR, Clafani JS, Emmons EE, Morris MJ, Leclerc KM, Slim AM. Comparison of predicted exercise capacity equations and the effect of actual versus ideal body weight among subjects undergoing cardiopulmonary exercise testing. Cardiol Res Pract. 2013;2013:940170. doi: 10.1155/2013/940170. [DOI] [PMC free article] [PubMed] [Google Scholar]
- 34.Instituto Brasileiro de Geografia e Estatística. (IBGE) [Acesso em 2014 fev 27]; Disponível em: http://www.ibge.gov.br/home/estatistica/populacao/censo2010/default.shtm.
- 35.Ministério da Saúde. Secretaria de Vigilância em Saúde. Departamento de Vigilância de Doenças e Agravos Não Transmissíveis e Promoção de Saúde . Vigitel Brasil 2012: vigilância de fatores de risco e proteção para doenças crônicas por inquérito telefônico. Brasília: 2013. [Google Scholar]