Abstract
Osteoporosis causes over 1.5 million fractures per year, costing about $15 billion annually in the USA. Current guidelines utilize bone mineral density (BMD) to assess fracture risk; however, BMD alone only accounts for 30–50% of fractures. The other two major components of bone, organic matrix and water, contribute significantly to bone mechanical properties, but cannot be assessed with conventional imaging techniques in spite of the fact that they make up about 57% of cortical bone by volume. Conventional clinical MRI usually detects signals from water in tissues without difficulty, but cannot detect the water bound to the organic matrix, or the free water in the microscopic pores of the Haversian and the lacunar-canalicular system of cortical bone, because of their very short apparent transverse relaxation times (T2*). In recent years, a new class of sequences, ultrashort-TE (UTE) sequences, with nominal TEs of less than 100 μs, which are much shorter than the TEs available with conventional sequences, have received increasing interest. These sequences can detect water signals from within cortical bone and provide an opportunity to study disease of this tissue in a new way. This review summarizes the recent developments in qualitative UTE imaging (techniques and contrast mechanisms to produce bone images with high contrast) and quantitative UTE imaging (techniques to quantify the MR properties, including T1, T2* and the magnetization transfer ratio, and tissue properties, including bone perfusion, as well as total, bound and free water content) of cortical bone in vitro and in vivo. The limitations of the current techniques for clinical applications and future directions are also discussed.
Keywords: cortical bone, osteoporosis, ultrashort TE, contrast mechanism, T1, T2*, bound water, free water
INTRODUCTION
The risk of bone fracture depends on the risk of a fall, the force of impact and the strength of the relevant bone. This depends on the bone mineral density (BMD), geometry and quality (1). The World Health Organization (WHO) Task Force on osteoporosis (OP), although briefly mentioning the importance of microstructure, recommended the use of BMD only for the determination of fracture risk (2). BMD is not only used to assess fracture risk, but also for the diagnosis of OP (T-score <−2.5) and for the monitoring of the response to drug intervention.
However, a number of clinical studies have demonstrated the limitations of BMD measurements (3–5). Vertebral fractures in older adults are only weakly associated with BMD (3). A recent study of over 7806 patients found that only 44% of all nonvertebral fractures occurred in women with a T-score below −2.5, and that this percentage was even lower (21%) in men (4). BMD by itself predicts fractures with a detection rate of 30–50%. Low correlation coefficients have been reported between BMD and cortical bone strength (5). There is also strong discordance between changes in BMD and fracture risk after therapeutic intervention with antiresorptive agents (6). Overall fracture risk increases 13-fold from the age of 60 to 80 years, but it is estimated that the decrease in BMD alone can only explain a doubling of this fracture risk (7). There is a clear need for more sensitive risk assessment tools, potentially using not only BMD, but other determinants of risk, such as bone microstructure (8–19), porosity (20–27), organic matrix (28–32), bone water (33–41) and bone perfusion (42–48).
About 80% of the skeleton is cortical bone. Trabecular bone accounts for the remaining 20% of total bone mass. Cortical bone is traversed by Haversian canals (typically 30–200 μm in diameter), as well as lacunae (~10 μm) and canaliculi (~0.5 μm) (39). Bone loss involves thinning of the cortex and an increase in intracortical porosity ranging from about 5% to 30% (20). Numerous studies have confirmed that porosity has a dramatic impact on the mechanical properties of bone (20–22). The age-related increase in cortical porosity is a major contributor to the concurrent decrease in mechanical properties of bone, and accounts for 76% of the loss of bone strength with age (20). Increased porosity decreases elasticity and fracture toughness. A 4% rise in porosity increases crack propagation through bone by 84% (21). An increase in porosity from 4% to 10% more than halves the peak stress that can be tolerated by bone before fracture (22). The elastic modulus of cortical bone decreases as a power of increasing porosity (22). Fracture toughness is affected by changes in porosity, but is independent of BMD (26).
There is a close association between bone perfusion and both bone remodeling and fracture repair (42–48). Increased cortical bone turnover and inflammation are associated with increased blood flow (44). There is also a strong correlation between bone perfusion and BMD (45–47). However, the nature of bone makes it difficult to investigate perfusion (48). The techniques applicable to soft tissues are often difficult or impossible to apply to bone (48).
The current standard technique for the assessment of bone, dual-energy X-ray absorptiometry (DEXA), only provides information on BMD, not bone porosity (8). Micro-computed tomography (μCT) has emerged as a reference tool for the assessment of bone porosity in vitro. The recent development of high-resolution peripheral quantitative CT with spatial resolution down to 82 μm has allowed the in vivo assessment of bone porosity (27), and preliminary results have shown a high correlation between cortical porosity and biomechanical properties (27). The limitations of quantitative CT include the use of ionizing radiation, and the inability to detect small pores or to assess bone organic matrix and water.
These and other considerations have stimulated considerable interest in the imaging of the nonmineral component of bone with proton MRI. However, bone water protons possess very short apparent transverse relaxation times (T2*) and their MR signals decay to zero before the receive mode of conventional clinical MR systems can be enabled and the signals can be encoded. Bone therefore appears as zero signal with all clinical pulse sequences at all field strengths with all conventional clinical MR systems. The lack of signal means that it is not possible to measure normal values of T1, T2* and proton density, to actively manipulate bone contrast or to distinguish bone from adjacent short-T2 tissues, such as the periosteum and the basal layers of articular cartilage.
ULTRASHORT-TE (UTE) MRI
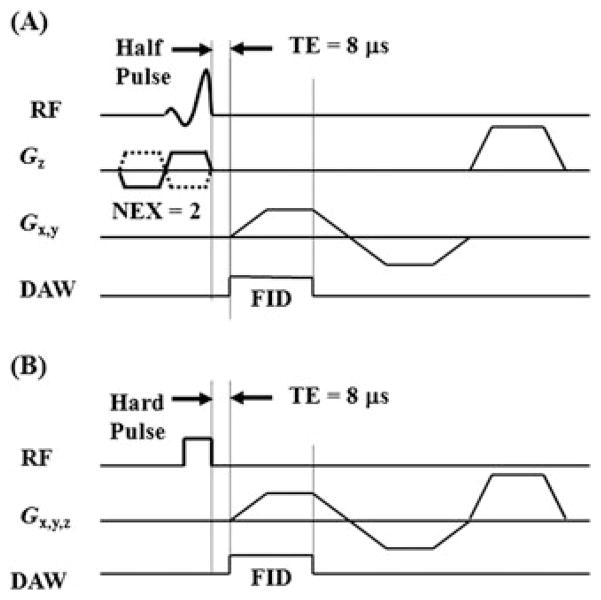
By using a different form of slice selection, radial mapping of k space and variable rate selective excitation (VERSE), TEs of around 100 μs or less have been achieved with two-dimensional (2D) UTE imaging (Fig. 1A) (49–61). Similarly, 3D UTE imaging can be achieved by combining short hard pulse excitation and three-dimensional (3D) radial sampling (Fig. 1B) (62–71). These UTE pulse sequences make it possible to image directly cortical bone and its adjacent tissues with spatial resolution, signal-to-noise ratios (SNRs) and contrast-to-noise ratios (CNRs) comparable with those of conventional clinical pulse sequences. This has allowed the measurement of T1 and T2* (53–61,71), the assessment of perfusion (53), the distinction of cortical bone from periosteum (53), the quantification of bone water content (59–61), the visualization of fracture healing (53), the measurement of phosphorus and sodium content (66–68) and the evaluation of the magnetization transfer ratio (MTR) (69).
Figure 1.
Ultrashort-TE (UTE) pulse sequence diagrams: two-dimensional (2D) UTE sequence with a slice-selective half-pulse excitation, followed by 2D radial ramp sampling (A), and three-dimensional (3D) UTE with a short rectangular hard pulse excitation, followed by 3D radial ramp sampling (B). DAW, data acquisition window; FID, free induction decay; NEX, number of excitations; RF, radiofrequency.
Although bone signal is detectable with UTE sequences, positive visualization of bone for qualitative purposes is limited by the presence of high signals from long-T2 water and fat. Efficient suppression of long-T2 water and fat signals is critical for direct imaging of cortical bone. There are also several specific considerations required for the quantitative evaluation of cortical bone using UTE sequences on clinical MR scanners. This review includes two parts. Part I focuses on qualitative UTE imaging techniques, including contrast mechanisms to produce bone images with high contrast. Part II focuses on quantitative UTE imaging techniques, including techniques to quantify MR properties (T1, T2* and MTR) and tissue properties (total, bound and free water) of cortical bone.
PART I. QUALITATIVE UTE IMAGING OF CORTICAL BONE – CONTRAST MECHANISMS
The basic 2D and 3D UTE sequences shown in Fig. 1 have been used with several short-T2 contrast mechanisms, including dual-echo UTE with echo subtraction (dUTE), dual-echo UTE with rescaled subtraction (UTE-RS), long-T2 saturation UTE (sUTE), long-T2 saturation dual-echo UTE with echo subtraction (sdUTE), UTE with off-resonance saturation (UTE-OSC), single adiabatic inversion recovery UTE (SIR-UTE), dual adiabatic inversion recovery UTE (DIR-UTE), UTE spectroscopic imaging (UTESI) and UTE phase imaging. The feasibility of these approaches has been demonstrated in tissue specimens and in healthy human volunteers using a 3-T clinical MR scanner.
Dual-echo UTE with echo subtraction (dUTE)
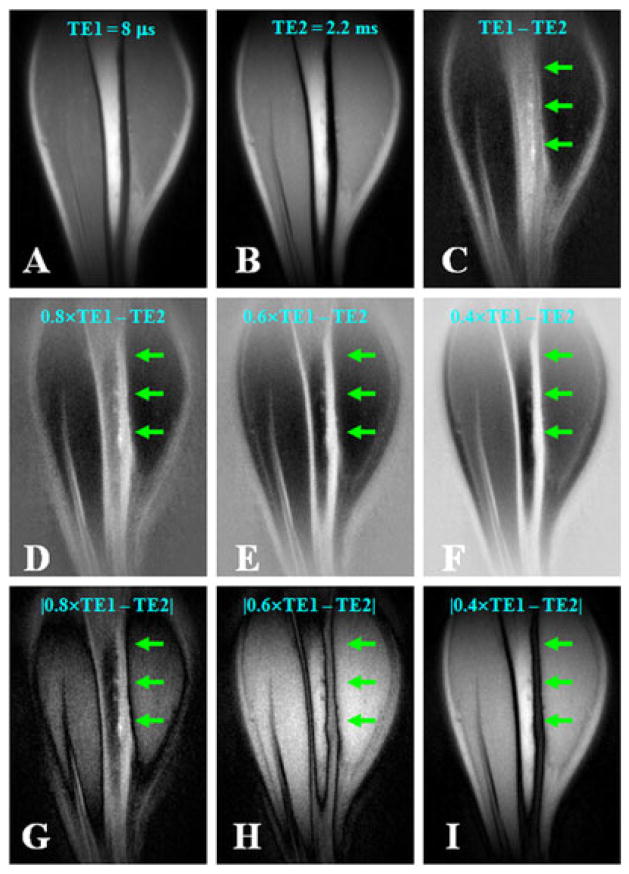
Dual echo acquisition with later echo subtraction has been used previously to suppress long-T2 signals in 2D and 3D UTE imaging (52,63). With this approach, the first free induction decay (FID) acquisition detects signal from both long- and short-T2 components, whereas the second echo detects signal mainly from long-T2 components. TE for the second echo is often kept at the minimal value for the fat and water in-phase imaging, i.e. 2.2 ms at 3 T. Subtraction of the second echo from the first selectively suppresses signal from the longer T2 components, and typically provides high contrast in the short-T2 range. This approach is simple and time efficient. The main drawbacks are that the second echo contributes low signal, but increases significantly the noise level by the square root of two. In addition, the second echo is acquired with a longer TE, and is therefore more vulnerable to effects from eddy currents, susceptibility and inter-echo signal decay (63). For ultrashort-T2 species (T2 < 1 ms), such as bone, the echo spacing should be kept as short as possible to reduce long-T2 signal decay during the echo spacing interval. Figure 2 shows an example.
Figure 2.
Dual-echo three-dimensional (3D) ultrashort-TE (UTE) imaging of the tibia of a volunteer with TE = 8 μs (A) and TE = 2.2 ms (B), with an acquired voxel size of 0.9 × 0.9 × 0.9 mm3 in a total scan time of 9.3 min. Subtraction of the second echo from the first provides limited contrast for cortical bone (C). Increased bone contrast was observed when negative pixel intensities were allowed and the second echo was subtracted from the free induction decay (FID) image whose intensity was rescaled down by a factor of 0.8 (D), 0.6 (E) or 0.4 (F). However, bone contrast gradually decreased when the absolute pixel intensity values were used with the same rescaling factors of 0.8 (G), 0.6 (H) and 0.4 (I). The bone signal remained positive on all the rescaled subtraction images. From ref. (63), with permission.
UTE with rescaled echo subtraction (UTE-RS)
Simple subtraction of the second image from the first may yield strong residual signal from muscle and fat, and compromise image contrast for short-T2 species, such as cortical bone. With UTE-RS, the FID image is scaled down so that signals from muscle and fat become lower than those from the second echo (63). In the subtraction image, signals from muscle and fat are negative, whereas those from short-T2 species are positive, separating them from air, which has a signal intensity fluctuating around zero (63). The UTE-RS technique can be efficient in creating high positive contrast for short-T2 species, especially cortical bone, which has a much lower mobile proton density than surrounding muscle and fat. Regular unscaled echo subtraction may reduce significantly bone contrast in this situation. Figure 2 shows an example on regular echo subtraction (Fig. 2C) and rescaled echo subtraction (Fig. 2D–F).
Long-T2 saturation UTE (sUTE) imaging
In the long-T2 saturation approach, a 90° pulse is typically used to tip the long-T2 magnetization into the transverse plane, where it is dephased by a large crusher gradient (51). The short-T2 magnetization experiences significant transverse relaxation during the 90° pulse and its longitudinal magnetization may be largely unaffected by this procedure. However, contrast may be degraded as a result of signal recovery between the saturation procedure and the UTE data acquisition, especially from short-T1 species, such as fat. Long Gaussian pulses (8–16 ms in duration) with a 100°–110° flip angle can be used to suppress both long-T2 water and fat signals (72). The longitudinal magnetizations of long-T2 water and fat are slightly inverted, and recover to near the zero-crossing before the start of UTE data acquisition (Fig. 3, top row). Any residual long-T2 signals caused by imperfect saturation (e.g. as a result of B1 inhomogeneity) can be reduced by subtraction of the second image from the first (Fig. 3, bottom row).
Figure 3.
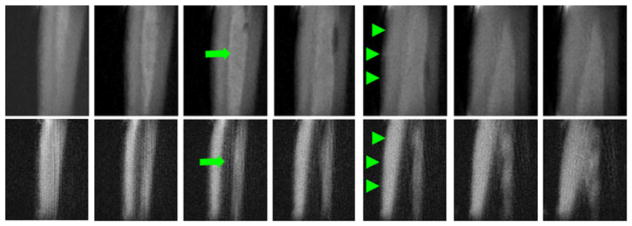
Three-dimensional (3D) long-T2 saturation ultrashort-TE (sUTE) imaging of tibia of a healthy young volunteer in the coronal plane with an acquired voxel size of 0.9 × 0.9 × 0.9 mm3 in a total scan time of 18.7 min. This shows high signal from both cortical bone (arrowheads) and bone marrow fat (arrows) with excellent suppression of muscle signal (top row). The combination of a long-T2 saturation pulse with dual echo acquisition and echo subtraction (3D sdUTE) reduces the signal from marrow fat further and enhances bone contrast (bottom row). From ref. (63), with permission.
UTE with off-resonance saturation (UTE-OSC)
The combination of off-resonance saturation and UTE acquisition may provide high contrast for bone imaging (57). The water protons and collagen protons in cortical bone have a short T2* and therefore a broad spectral linewidth. A radiofrequency (RF) pulse placed at a frequency far from the narrow line of long-T2 water and fat is expected to have a minimal effect on soft tissues, such as muscle and fat, but the pulse may still overlap with that of bound water and collagen protons with a spectral linewidth of several kilohertz. The off-resonance RF pulse is expected to suppress the UTE signal of cortical bone via direct saturation (saturation of water loosely bound to the organic matrix), cross-relaxation (proton–proton cross-relaxation between collagen protons and protons in bound water) or chemical exchange (chemical exchange between bound and free water). High-contrast images of cortical bone can then be formed by subtracting the off-resonance saturated image from a conventional UTE image. This suppresses signals from long-T2 water and fat, leaving high contrast for cortical bone. In our study, a Fermi pulse with a high amplitude and large flip angle was followed by gradient dephasing to produce effective off-resonance saturation of short-T2 species, such as cortical bone, with minimal saturation of long-T2 species.
Figure 4 shows axial imaging of a pig tibia with regular UTE and UTE-OSC sequences. The subtraction of these two sets of images suppressed effectively the signals from bone marrow fat, and provided high nominal spatial resolution and excellent contrast for cortical bone. Periosteum was partly suppressed by the off-resonance saturation pulse because of its relatively short T2. The strong susceptibility effects near the bone–periosteal interface may also contribute to the signal reduction in UTE imaging with off-resonance saturation. As a result, periosteum appears as a high signal in UTE-OSC subtraction images.
Figure 4.

Ultrashort-TE (UTE) imaging without (A) and with (B) a hard saturation pulse (with a duration of 10 ms and flip angle of 2400°) shifted +2 kHz from the water peak, and the corresponding subtracted image (C), which shows higher contrast for cortical bone in a total scan time of 4 min. From ref. (57), with permission.
Single adiabatic inversion recovery UTE (SIR-UTE)
In this approach, an adiabatic fast passage (Silver–Hoult) inversion pulse (8.6 ms in duration) is used to invert the longitudinal magnetization of long-T2 water and long-T2 fat (59). Adiabatic inversion pulses are relatively insensitive to B1 inhomogeneities, and so provide relatively uniform inversion when the pulse amplitude is above the adiabatic threshold. The short-T2 longitudinal magnetization is not inverted, but partially saturated during the long adiabatic inversion process. The UTE acquisition is begun at a delay time (TI) designed to allow the inverted long-T2 water and fat magnetization to approach the null point. As a result of the large difference in T1 values between fat (~360 ms) and muscle (~1400 ms) at 3 T, their longitudinal magnetizations do not reach the null point simultaneously. Simulation using the Bloch equations showed that both fat and muscle long-T2 signals can be reduced by more than 80% with appropriate combinations of TR and TI (59). The residual long-T2 signals caused by imperfect nulling can be further suppressed by subtraction of the later image from the first image.
Figure 5 shows clinical 2D fast spin echo (FSE) and SIR-UTE images of the radius and ulna from a cadaveric forearm. The clinical 2D FSE image (Fig. 5A) provides near zero signal from the radius, ulna and tendons. In contrast, the 2D SIR-UTE image (Fig. 5B) provides a high SNR of 44 ± 4 for cortical bone, a high CNR of 36 ± 2 between bone and muscle and a high CNR of 28 ± 2 between bone and marrow fat, with a nominal spatial resolution of 0.2 × 0.2 × 6 mm3.
Figure 5.
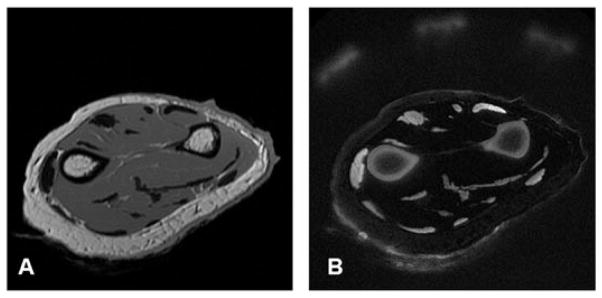
A cadaveric forearm imaged with a clinical two-dimensional fast spin echo (2D FSE) sequence (A) and a single adiabatic inversion recovery ultra-short-TE (SIR-UTE) sequence (B) with an acquired voxel size of 0.2 × 0.2 × 6.0 mm3 in a total scan time of 9 min. The 2D FSE sequence shows near-zero signal for bone and tendon. These are depicted with high spatial resolution and contrast with the 2D SIR-UTE sequence. From ref. (59), with permission.
Dual adiabatic inversion recovery UTE (DIR-UTE)
In this approach, two long adiabatic inversion pulses are used to successively invert the longitudinal magnetization of long-T2 water and long-T2 fat (58). The longitudinal magnetization of cortical bone with short T2 is not inverted because of significant transverse relaxation during the long adiabatic inversion process. The UTE acquisition starts at a delay time of TI1 necessary for the inverted long-T2 water magnetization to reach the null point, and of TI2 for the inverted fat magnetization to also reach the null point. The long-T2 water magnetization is inverted first (TI1 > TI2) because of its longer T1 and the fat magnetization is inverted later because of its shorter T1. Appropriate combination of TI1, TI2 and TR allows robust (insensitive to B1 and B0 inhomogeneities) and efficient simultaneous suppression of long-T2 water and fat signals.
Figure 6 shows images of the left distal tibia of a 31-year-old healthy male volunteer using clinical 2D gradient recalled echo (GRE), conventional UTE and DIR-UTE techniques with a field of view of 10 cm and slice thickness of 5 mm. Two long adiabatic inversion pulses (duration, ~25 ms; spectral bandwidth, ~520 Hz) were centered at 0 Hz (to cover the water peak and CH peak) and −440 Hz (to cover the CH2 and CH3 peaks) to provide effective coverage of the water and multiple fat peaks, allowing inversion of their longitudinal magnetization. TI1 of 140 ms and TI2 of 110 ms were employed for long-T2 suppression (TI2 is suboptimal in order to avoid overlap between the two long adiabatic pulses). Cortical bone demonstrates a signal void with the 2D GRE sequence and poor contrast with the conventional UTE sequence because of the high signal from the surrounding muscle and fat. The DIR-UTE sequence suppresses long-T2 water signals (such as muscle) and fat, and displays cortical bone with high contrast.
Figure 6.

The mid-tibia of a volunteer imaged with the gradient recalled echo (GRE) (left), ultrashort-TE (UTE) (middle) and dual adiabatic inversion recovery UTE (DIR-UTE) (right) sequences. The GRE sequence shows a signal void for cortical bone. The regular UTE image shows slightly higher signal from bone, but poor contrast. The DIR-UTE image selectively suppresses signal from fat and muscle, creating high contrast for cortical bone, with an acquired voxel size of 0.2 × 0.2 × 5.0 mm3 in a total scan time of 5 min. From ref. (58), with permission.
UTE spectroscopic imaging (UTESI)
UTESI combines UTE with a highly undersampled interleaved multi-echo variable-TE acquisition scheme (55). Spectroscopic images are generated through Fourier transformation of the series of time-domain images. The projection data are highly undersampled with a speedup factor of up to 50–100, and this drastically reduces the total scan time. In addition, the under-sampled projections are interleaved to produce oscillating streaks, which are automatically shifted to high spectral frequencies and provide streak-free water images. UTESI provides information about chemical shift, bulk magnetic susceptibility, resonance frequency shift and phase evolution (73). This can all be achieved in a single scan of less than 10 min using clinical systems.
Figure 7 shows UTE spectroscopic images of the tibial midshaft from a 34-year-old healthy volunteer reconstructed at different resonance frequencies. Long-T2* signals from fat and muscle were suppressed with a long maximal phase 90° pulse (8 ms in duration), followed by gradient dephasing. Bone was well depicted with a relatively low spatial resolution of 0.78 × 0.78 mm2. There is no obvious streak artifact over a wide range of resonance frequencies because of the interleaved UTE acquisition which shifts all the undersampling streaks to high spectral frequencies. There is some residual signal from muscle and fat because of imperfect saturation, as well as recovery of the longitudinal magnetization during the gradient dephasing. The residual signal provides useful information on the bulk susceptibility of cortical bone relative to muscle and fat. There is a shift of 195 Hz between the on-resonance frequency of muscle and on-resonance frequency of bone, which is probably a result of the greater diamagnetic susceptibility of bone (12). The fat resonance frequency is shifted by 415 Hz relative to muscle and 220 Hz relative to bone.
Figure 7.
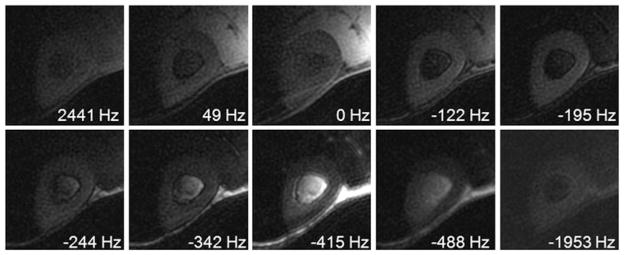
Ultrashort-TE spectroscopic imaging (UTESI) of cortical bone of a healthy volunteer with an acquired voxel size of 0.8 × 0.8 × 8.0 mm3 in a total scan time of 5 min. There is a shift of 195 Hz between the bone peak and muscle peak, because of the greater diamagnetic susceptibility of cortical bone. From ref. (55), with permission.
UTE phase mapping
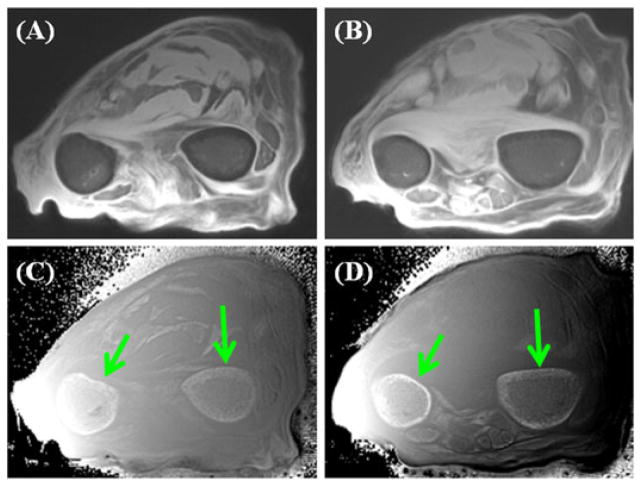
The bulk susceptibility effect on water confined in the spaces of the Haversian and lacuno-canalicular system in cortical bone can lead to local magnetic field variation, and thus off-resonance frequency shifts ωoff. The phase evolution resulting from these frequency shifts may be used to create contrast for UTE imaging of cortical bone. Figure 8 shows a 2D UTE magnitude image of a forearm specimen and the corresponding phase image. The high image contrast for cortical bone provided by the phase image should be noted. The magnitude image shows low signal and contrast for cortical bone.
Figure 8.
Two different cross-sections of ultrashort-TE (UTE) imaging of the forearm in a total scan time of 9 min: magnitude images (A, B) and the corresponding phase images (C, D). High contrast is seen between the cortex and surrounding tissue in (C, D) even though the magnitude of the signal from the cortex is low (A, B).
Other techniques for morphological imaging of cortical bone
There are several other techniques that have been developed for high contrast imaging of cortical bone. Sussman et al. (51) first provided the theoretical basis of the design of practical T2-selective RF excitation (TELEX) pulses, which were investigated extensively in later studies. Wu and colleagues (64–67) developed water- and fat-suppressed proton projection MRI (WASPI) for bone imaging. Figure 9 shows an example of in vivo WASPI images of a volunteer (67). Excellent image contrast was achieved for cortical bone with efficient suppression of signal from muscle and marrow fat.
Figure 9.
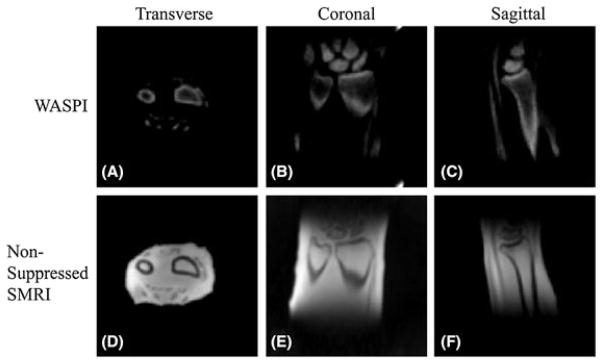
In vivo water- and fat-suppressed proton projection MRI (WASPI) and nonsuppressed SMRI images of a 57-year-old male volunteer’s left wrist with an acquired voxel size of 0.9 × 0.9 × 0.9 mm3 in a total scan time of 18 min. (A–C) Transverse, coronal and sagittal slices from the three-dimensional (3D) WASPI image dataset. The signal-to-noise ratio (SNR) of the cortical bone is above 40 and that of the trabecular bone is above 10. (D–F) Corresponding slices from the nonsuppressed solid state MRI (SMRI) image dataset. From ref. (67), with permission.
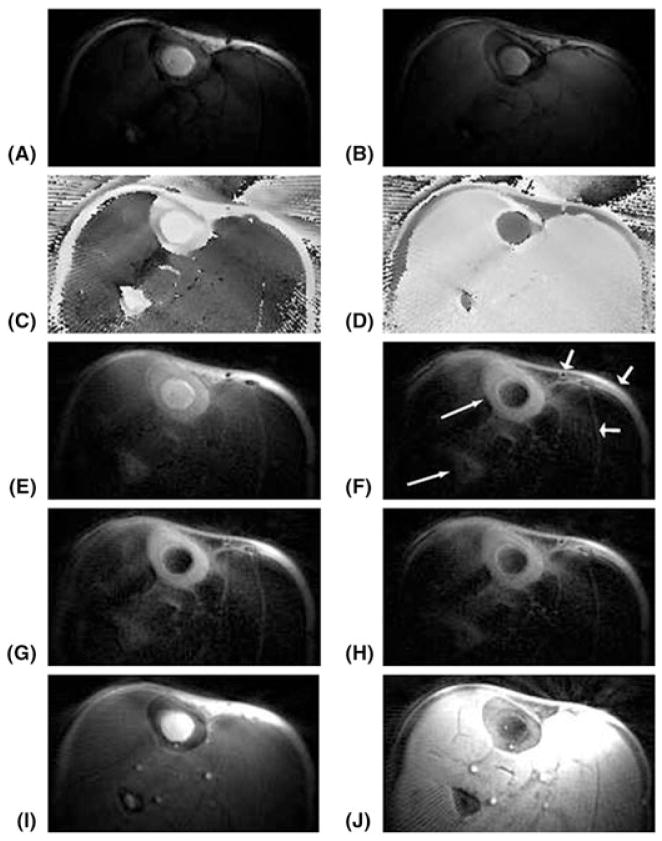
Larson et al. (54) proposed the use of narrow-bandwidth inversion pulses to selectively invert only long-T2 components, which were then suppressed by combining images prepared with and without inversion pulses. The scaled sum of the two datasets provides high-contrast imaging of the cortical bone in the tibia with excellent suppression of the marrow fat signal (Fig. 10).
Figure 10.
Axial images at the middle of the lower leg with an acquired voxel size of 0.7 × 0.7 × 5.0 mm3 in a total scan time of 5.3 min. (A) Water-inverted magnitude image. (B) Fat-inverted magnitude image. (C) Water-inverted phase image, corrected. (D) Fat-inverted phase image, corrected. (E) Sum of (A) and (B). (F) Scaled sum of (A) and (B). (G, H) Scaled sums with 80% and 120%, respectively, of the desired radiofrequency (RF) amplitude, windowed the same as in (F). (I) Ultrashort-TE (UTE) image (TE = 80 μs). (J) Scaled sum of a noninverted and a fat-inverted image (not shown), also windowed the same as in (F). The scaled sums of water- and fat-inverted images (F–H) show excellent contrast for the cortical bone in both the tibia and fibula (long thin arrows). The signal in the skin, around the vessels and between the muscles and fascicles (short thick arrows) may be from short-T2 components or suppression failures caused by off-resonance and/or partial volume effects. From ref. (54), with permission.
Techawiboonwong et al. (60,61) applied low-amplitude and long-duration rectangular RF pulses at both water and fat resonances to selectively suppress water and fat signals for high-contrast bone imaging. More recently, Li et al. (74) investigated the performance of three long-T2 suppression UTE sequences: echo subtraction (dual-echo UTE), saturation via dual-band saturation pulses (dual-band UTE) and inversion by adiabatic inversion pulses (IR-UTE). They found that a combination of dual-band UTE with dual-echo UTE provides good short-T2 SNR and CNR with less sensitivity to B1 inhomogeneity, whereas IR-UTE has the lowest short-T2 SNR efficiency, but highly uniform short-T2 contrast. Furthermore, techniques such as pointwise encoding time reduction with radial acquisition (PETRA) and zero TE (ZTE) may reduce blurring in bone imaging (75,76).
Sweep imaging with Fourier transformation (SWIFT) is an entirely different class of imaging technique (77). In SWIFT, time-domain signals are acquired in a time-shared manner during a swept RF excitation of the nuclear spins with negligible time delay between RF excitation and data acquisition. This technique has considerable potential for the imaging of objects consisting of spins with extremely short T2 values, such as macromolecules which may not be directly detectable with UTE sequences.
Summary of qualitative imaging of cortical bone
Of the various morphological bone imaging techniques now available, adiabatic inversion recovery (AIR)-based approaches, including SIR-UTE, DIR-UTE and narrow-bandwidth IR-UTE, appear to provide the most uniform suppression of long-T2 water and fat signals. This is probably because AIR pulses are insensitive to B1 inhomogeneity (53,54,58,59,74,78). Saturation-based approaches, including TELEX, WASPI, UTE-OSC and dual-band UTE, may be more SNR efficient, but are more sensitive to B1 and B0 inhomogeneities (51,57,64,74). SWIFT is a new category of bone imaging technique, and its clinical application is now being demonstrated using whole-body scanners (77). Dual-echo UTE with echo subtraction, especially with rescaled subtraction, is a simple technique which is capable of high-resolution imaging of bone with relatively low sensitivity to B1 and B0 field inhomogeneities. It may have significant potential applications in bone imaging because of its simplicity and fast data acquisition (52,63).
Direct imaging of cortical bone can be used to monitor recovery from bone fracture (53). A reduction in the signal from short-T2 components is seen in acute fractures, and an increase in signal in these components is seen with new bone formation (53). In OP, bone cross-sectional area and signal level appear to be reduced (53). However, it may be more important to employ the MR techniques to quantify bone properties in addition to physical dimensions. These properties include relaxation times (T1, T2*, T2 and T1rho), total, bound and free water concentration, MTR and bone perfusion, all of which are inaccessible with current gold standard techniques, such as DEXA and CT.
QUANTITATIVE UTE IMAGING OF CORTICAL BONE
The main focus of current UTE techniques is to reduce TE and improve signal detection. However, it is also important to be able to evaluate quantitatively short-T2 tissues, including relaxation times, such as T1 and T2*. Other tissue properties, such as bone perfusion, proton density, and bound and free water fractions, including their T2* values, may also be important.
T1 quantification
Conventional inversion recovery-based T1 quantification techniques are problematic for cortical bone. There may be significant signal decay during the relatively long-duration inversion pulses normally used in clinical MR sequences (52). Quantification of T1 of cortical bone requires the use of UTE sequences because of the tissue’s short T2. Saturation recovery techniques are preferred as it is much easier to saturate than to invert bone magnetization (52,53,59–61). In saturation recovery UTE, a nonselective 90° rectangular pulse (~256 μs, which is limited by the RF system) is followed by a large crusher gradient to saturate signals from both long- and short-T2 species. UTE acquisitions with progressively increasing saturation recovery times are then used to detect the recovery of cortical bone longitudinal magnetization. T1 is calculated by fitting the bone signal using the exponential signal recovery model. Figure 11 shows an example.
Figure 11.
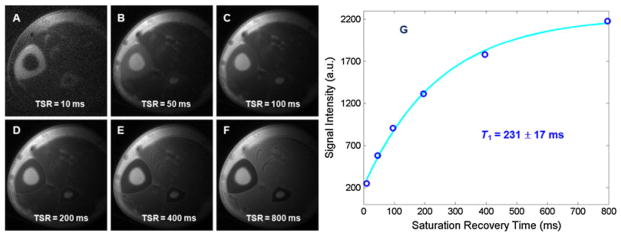
Saturation recovery ultrashort-TE (UTE) imaging of the tibia of a volunteer with saturation recovery times (TSR) of 10 ms (A), 50 ms (B), 100 ms (C), 200 ms (D), 400 ms (E) and 800 ms (F). Mono-exponential fitting shows a short T1 of 231 ± 17 ms (G) for cortical bone. The total T1 quantification time was 14 min. From ref. (59), with permission.
The saturation recovery approach may be too time consuming for 3D UTE imaging and T1 mapping. Recently, Springer et al. (71) introduced a variable flip angle method for fast 3D T1 mapping, in which two 3D UTE datasets are acquired with two optimized flip angles (e.g. 10° and 60°). T1 maps are calculated based on Bloch equations. Figure 12 shows an example of 3D T1 mapping of the tibial midshaft of a healthy volunteer.
Figure 12.
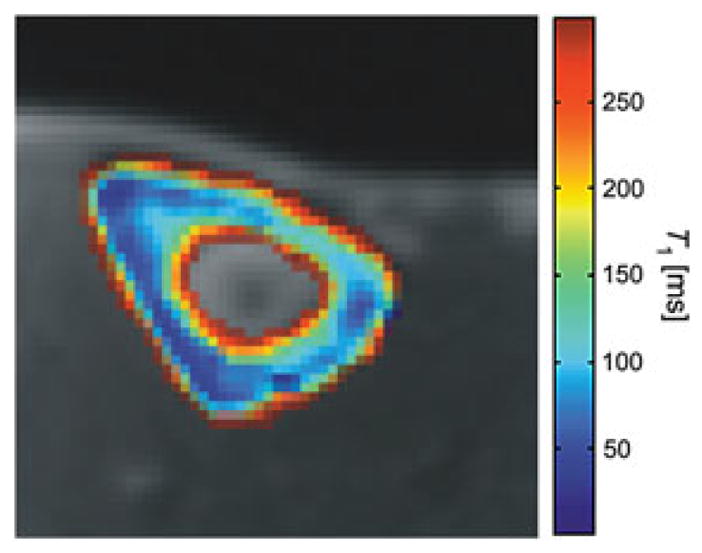
A pixel-by-pixel calculated map of the longitudinal relaxation times of the tibial cortical bone of a healthy volunteer. From ref. (71), with permission.
T2* quantification
The T2* value of cortical bone has been measured with UTE acquisitions at progressively increasing TEs (52). However, the increase in TE results in different effects from time-varying eddy currents, including alterations to the slice profile and different degrees of long-T2 signal contamination (79). As a result, significant errors in T2* quantification may be introduced. Efficient long-T2 signal suppression with adiabatic inversion and nulling may reduce significantly out-of-slice long-T2 signal contamination (59). T2* can then be calculated by fitting the bone signal using an exponential signal decay model. Figure 13 shows an example. Imaging parameters were similar to those used in SIR-UTE, except for a series of different TEs (8, 200, 800 and 1500 μs).
Figure 13.
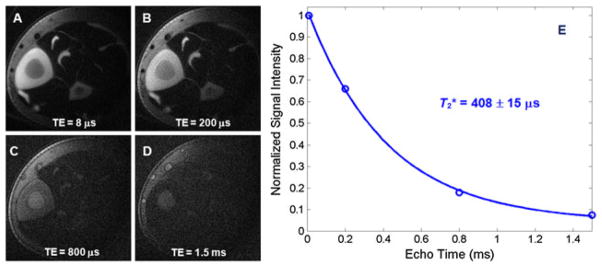
Single adiabatic inversion recovery ultrashort-TE (SIR-UTE) imaging of the mid-diaphyseal tibia of a young healthy volunteer with TE delays of 8 μs (A), 200 μs (B), 800 μs (C) and 1.5 ms (D). Mono-exponential fitting from a small region of interest (ROI) drawn in cortical bone demonstrates a short T2* of 408 ± 16 μs for this volunteer. The total T2* quantification time was 10 min. From ref. (59), with permission.
Bone water quantification
UTE sequences are capable of direct quantification of bone water concentration by comparison of signal intensities from bone and an external reference (60). The accurate estimation of bone water requires the consideration of tissue and fluid relaxation, coil sensitivity and slice profile effects. The external reference can be a mix of distilled water (20%) and D2O (80%) doped with MnCl2, titrated to match the effective T2* of cortical bone, in order to maximize the dynamic range of the bone signal and to minimize errors caused by relaxation during RF excitation and acquisition (59).
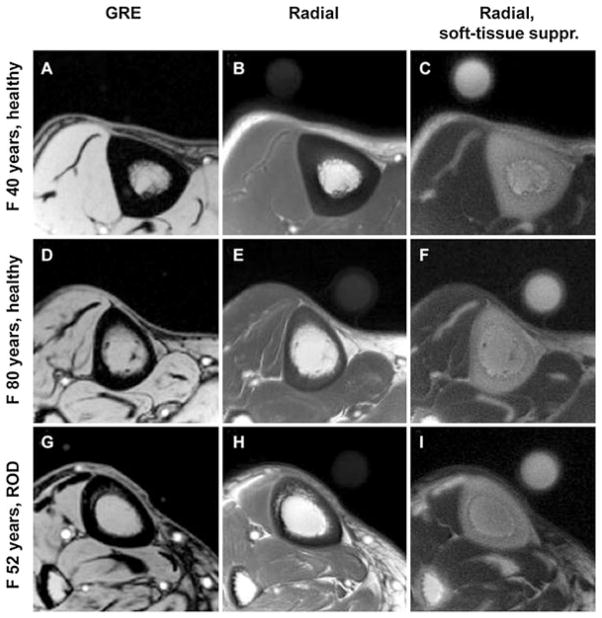
The signal intensity of cortical bone relative to that of a reference water phantom allows the in vivo bone water concentration to be estimated. Figure 14 shows an example in which transverse images of the tibial midshaft obtained in three subjects (40-year-old healthy female volunteer, 80-year-old healthy female volunteer and 52-year-old female volunteer with renal osteodystrophy) are shown together with a water reference phantom (61). The bone water concentration was found to be ~18% for the premenopausal volunteer, ~29% for the postmenopausal volunteer and ~40% for the volunteer with renal osteodystrophy, whereas BMD values showed no significant difference between the groups (61).
Figure 14.
Representative transverse MR images of the tibial midshaft from each of the three groups studied, with and without soft tissue signal suppression. (A, D, G) Gradient recalled echo (GRE) images. (B, E, H) Radial ultrashort-TE images. (C, F, I) Radial ultrashort-TE images with soft tissue suppression (suppr.). The circular structure is the reference sample with T2 at approximately 300 s which, similar to bone, is visible only on radial MR images. The images obtained in the 40-year-old healthy subject (top row) display noticeably thicker cortex than those in the 80-year-old subject (middle row) or those in the 52-year-old patient with renal osteodystrophy (ROD) (bottom row). Images in the patient with ROD display the effect of increased cortical bone porosity. From ref. (61), with permission.
Bi-component analysis – bound and free water evaluation
Biological tissues frequently contain distinct water compartments with different transverse relaxation times. Multi-component fitting techniques are important for the realistic analysis of T2 relaxation curves. However, multi-component fitting is very sensitive to image SNR, the number of fitting components and the differences between T2 values (80). The following four approaches can be employed to improve curve fitting. First, only two components are assumed, with the UTE MR signal given by water bound to the organic matrix with a very short T2* and free water in pores with a longer T2*. Second, the UTE T2* signal is normalized before bi-component fitting, so that the sum of the amplitude of the two components equals unity (one degree of freedom is saved in the fitting). Third, background noise is estimated using a fully automated comprehensive four-step noise estimation algorithm primarily based on the maximum likelihood estimation model (81,82); thus, another degree of freedom (background noise) is regained in the subsequent fitting. Fourth, a noise-corrected model based on the Bessel function of the first kind of nth order is used for bi-component fitting with reduced sensitivity to noise (83). A recent study by Raya et al. (83) showed that this noise-corrected model is the most accurate and precise method for T2 calculation, especially for low-SNR images.
The existence of two distinct components in cortical bone is demonstrated in Fig. 15, which shows selected UTE images of a cortical bone sample with progressively increasing TEs ranging from 8 μs to 12 ms, as well as the single- and bi-component curve fitting of UTE T2* signal decay. SNR ~ 54 and an in-plane spatial resolution of 0.3 × 0.3 mm2 were achieved in a scan time of under 2 min. Single-component fitting of the UTE T2* decay curve from a region of interest (ROI) drawn in cortical bone shows a short T2* of 0.66 ± 0.05 ms. However, there is systematic residual signal with errors greater than 10% around TEs of 2–4 ms, suggesting the existence of another water component with a longer T2*. Excellent fitting was achieved with the bi-component model, which demonstrated two distinct components, one with a short T2* of 0.34 ms and the other with a long T2* of 2.92 ms. The shorter T2* component accounts for 75.4% of the total UTE MR signal decay, and the longer T2* component accounts for the other 24.6% of the signal decay. The residual signal was reduced to less than 2%, demonstrating that the bi-component model accounts well for the UTE T2* decay behavior.
Figure 15.
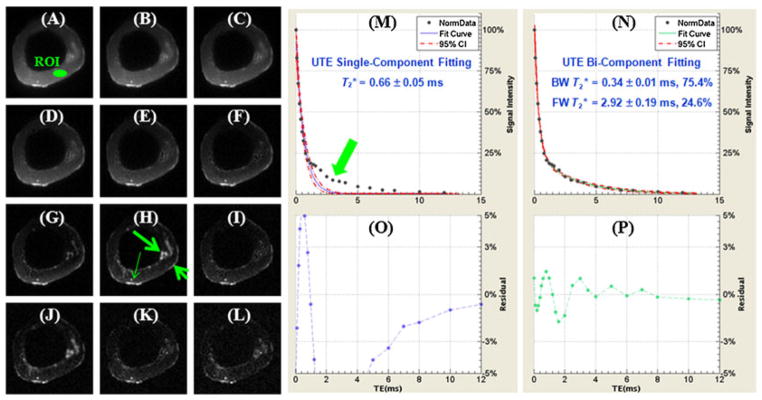
Selected non-slice-selective two-dimensional (2D) ultrashort-TE (UTE) imaging of a human cortical bone sample immersed in perfluorooctyl bromide with TEs of 8 μs (A), 0.2 ms (B), 0.4 ms (C), 0.6 ms (D), 0.8 ms (E), 1.2 ms (F), 1.6 ms (G), 2.0 ms (H), 3.0 ms (I), 4.0 ms (J), 5.0 ms (K) and 6.0 ms (L), as well as single-component fitting (M) and the corresponding fitting residuals (O), and bi-component fitting (N) and the corresponding fitting residuals (P). Free water residing in large pores (long thin arrow), periosteum (short thick arrow) and marrow fat residing in the inner and middle cortex (long thick arrow) are well depicted. A region of interest (ROI) was drawn in the mid-cortex, avoiding free water, periosteum and marrow fat. Single-component fitting shows significant residual signal (>10%). The residual signal is reduced to less than 2% by bi-component fitting, which shows a shorter T2* of 0.34 ms and a longer T2* of 2.92 ms with respective fractions of 75.4% and 24.6% by volume.
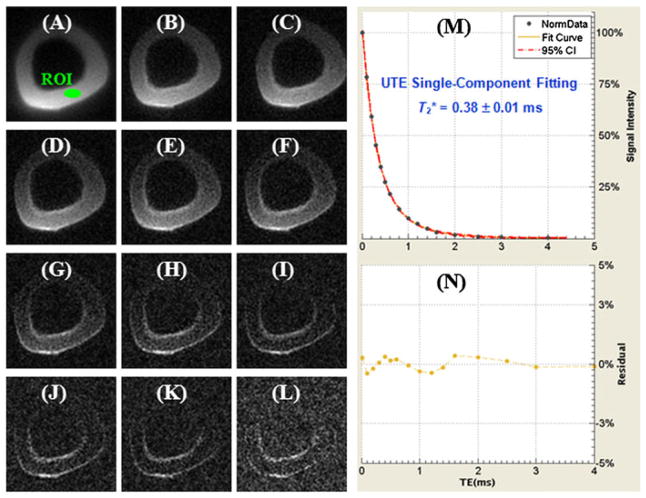
A single-component T2* decay was observed in the SIR-UTE images. Figure 16 shows selected SIR-UTE images of the same cortical bone as shown in Fig. 15, as well as the corresponding single-component curve fitting, which accounted for 99.9% of the signal variance, with a residual signal of less than 0.5%. The fitted T2* of 0.38 ms was very close to the shorter T2* value of 0.34 ms from the bi-component fitting of UTE T2* signal decay. These results suggest that only one component, water bound to the organic matrix, exists in SIR-UTE imaging. The free water component with longer T2 was selectively suppressed by the SIR preparation pulse through adiabatic inversion and signal nulling.
Figure 16.
Selected non-slice-selective two-dimensional (2D) single adiabatic inversion recovery ultrashort-TE (SIR-UTE) imaging of the same human cortical bone sample as shown in Figure 1 with TEs of 8 μs (A), 0.2 ms (B), 0.4 ms (C), 0.6 ms (D), 0.8 ms (E), 1.0 ms (F), 1.2 ms (G), 1.6 ms (H), 2.0 ms (I), 2.6 ms (J), 3.0 ms (K) and 4.0 ms (L), as well as single-component fitting (M) and the corresponding fitting residuals (N). The residual signal is less than 0.5% by single-component fitting, suggesting that only signal from bound water is detected with SIR-UTE imaging.
There are no standard reference techniques available to accurately measure bound and free water in cortical bone. A bovine bone drying experiment was conducted to validate indirectly the results. Figure 17 shows UTE images of bovine cortical bone before (A) and after (B) air drying at room temperature for 3 days, as well as bi-component fitting (C) of UTE images of the wet bone. Figure 16C shows that there is a short-T2 component (80.6%) and a longer T2 component (19.4%) for wet bone. Free water is expected to largely disappear after 3 days of air drying. Bi-component fitting indeed shows a near-zero fraction of 0.7% for the free water component, whereas the bound water component accounts for 99.3% of the total UTE signal.
Figure 17.
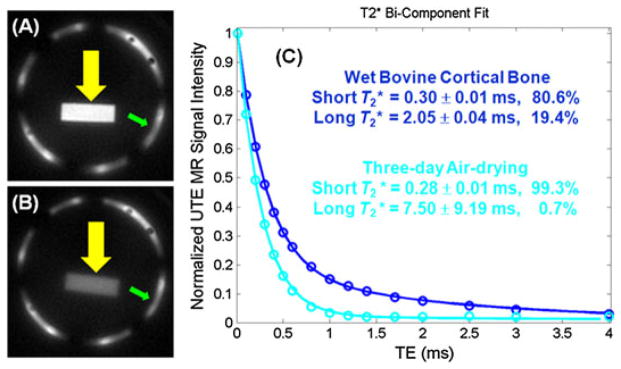
Ultrashort-TE (UTE) imaging of a wet bovine cortical bone sample (A). After air drying for 3 days, signal from bound water remains (B). A bi-component model demonstrates a T2* of 0.30 ms and a fraction of 80.6% for bound water, as well as a T2* of 2.05 ms and a fraction of 19.4% for free water in the wet sample. After 3 days of drying, free water dropped to near zero (C).
Figure 18 shows the correlation between UTE MR-measured water loss and gravimetric bone water loss of seven bovine cortical bone samples during sequential air drying. There was a high correlation (R = 0.91; p <0.0001) between the UTE MR-measured free water loss and gravimetric bone weight loss during sequential air drying, and a significant correlation (R = 0.69; p <0.01) between UTE bound water loss and gravimetric bone weight loss during oven drying (84). These results show that UTE bi-component analysis can be used to estimate bound and free water in cortical bone. The technique has potential applications for the in vivo evaluation of bone porosity and organic matrix.
Figure 18.
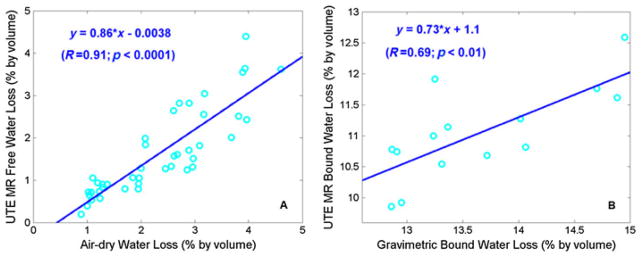
A high correlation was observed between ultrashort-TE (UTE)-measured free water loss and gravimetric water loss during sequential air drying (A), as well as between UTE-measured bound water loss and gravimetric water loss during oven drying (B). UTE water loss is lower, probably because residual surface water only contributes to gravimetric water loss. UTE-assessed bound water loss is consistently lower than gravimetric bound water loss. From ref. (84), modified.
Another study showed that UTE bound and free water measurements correlated significantly with μCT porosity and biomechanical measurements of failure strain, ultimate stress and failure energy, suggesting that UTE measurements are sensitive to the structure and failure properties of human cortical bone, and may provide a novel way of evaluating cortical bone quality (85).
Direct imaging of bound and free bone water components
NMR spectroscopy studies have demonstrated that free water in pores has a long T2 value of 100 ms or longer (86–88). This portion of bone water may be detected with conventional clinical FSE sequences with TEs of around 10 ms. However, this long-T2 bone water component has only recently been demonstrated with clinical spin echo sequences on whole-body scanners (89). There are three technical challenges for direct imaging of bone porosity with MRI. First, cortical bone has a very low free water concentration, which makes it difficult to image with proton-based MR techniques. The majority of bone water in cortical bone of healthy volunteers exists in the form of bound water (bound to the organic matrix or mineral). Only a small fraction (20% or less) exists in free form in the Haversian and lacuno-canalicular systems (88). Water typically occupies a small fraction of bone by volume (~20%) (90–92). Hence, free water only occupies about 4% of bone by volume. Second, there is a lack of dynamic range in direct imaging of bone water. Cortical bone is surrounded by bone marrow (inside) and muscle (outside). These tissues usually have high proton densities of 80–90% by volume. Third, there is a need for high spatial resolution and thus associated low SNR in imaging bone architecture. Free bone water resides in the fine structure of cortical bone, and requires a spatial resolution of 100 μm or less for depiction. Small coils with high SNR efficiency and long scan times are required for optimal imaging. Considering the longitudinal structure of the Haversian and lacuno-canalicular systems, axial imaging with thick slices is one way to improve SNR for the clinical assessment of cortical bone structure (89). Another way is to focus on the giant canals with diameters of 300 μm or larger. Studies by Bell et al. (93) have shown that giant canals with diameters above 385 μm make a substantial contribution to cortical porosity, and have a negative influence on the ability of cortical bone to withstand stresses associated with a fall. Therefore, direct imaging of such giant canals with a 2D FSE sequence combined with technical approaches, including relatively low-resolution, thick axial slices and high-performance local coils, may make it possible to evaluate bone quality in vivo using clinical MR sequences. Figure 19 shows an example of 2D FSE imaging of a cortical bone sample with excellent depiction of the cortical bone structure.
Figure 19.
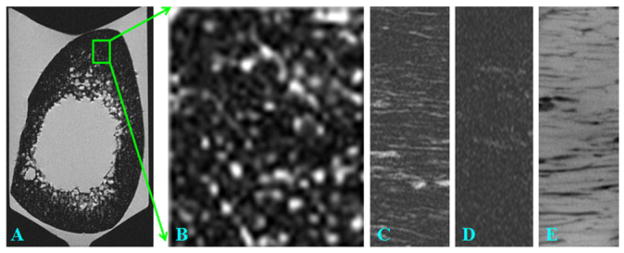
Fast spin echo (FSE) imaging of a bone sample in the axial plane (A) and zoom-in of a subregion (B), as well as a sagittal slice imaged with FSE (C), GRE (D) and micro-CT (E). The bright bone water signal in (A–C) corresponds to long-T2 water residing in the Haversian and lacuno-canalicular systems.
Figure 20 shows the results of 2D FSE, 2D GRE, 2D and 3D UTE, as well as 2D and 3D SIR-UTE, imaging of a cortical bone sample. Free water in the Haversian canals is well depicted by the 2D FSE sequence, but appears as a signal void with the 2D GRE sequence, consistent with free water having a long T2, but short T2*, in cortical bone. The 2D and 3D UTE sequences detect both free water in the pores, which appears as high-signal fine structure, and water bound to the organic matrix, which appears as a uniform background signal. The high-signal fine structure disappears with the 2D and 3D SIR-UTE sequence, where the free water signal is suppressed by the AIR preparation pulse. The uniform background signal is probably from water bound to the organic matrix.
Figure 20.
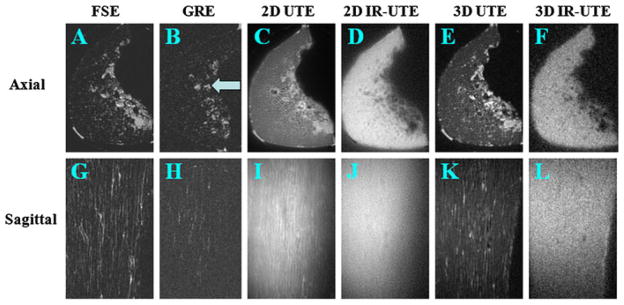
Two-dimensional fast spin echo (2D FSE) (A, G), 2D gradient recalled echo (GRE) (B, H), 2D ultrashort-TE (UTE) (C, I), 2D single adiabatic inversion recovery UTE (SIR-UTE) (D, J), 3D UTE (E, K) and 3D SIR-UTE (F, L) imaging of a cortical bone sample immersed in perfluorooctyl bromide in the axial (top row) and sagittal (bottom row) planes. Free water in the Haversian canals is detected by FSE (A, G), 2D UTE (C, I) and 3D UTE (E, K) sequences. Both 2D SIR-UTE (D, J) and 3D SIR-UTE (F, L) show a uniform bright signal, consistent with only bound water being detected. GRE (B, H) shows little or no signal for both bound and free water in cortical bone. The bright signal shown in (B) corresponds to residual marrow fat (arrow).
Magnetization transfer (MT)
In recent years, MT imaging has been introduced for the quantitative evaluation of bound and free water components, including their T1 and T2 values and fractions (94–96). The clinical MT sequences employ an off-resonance saturation pulse, followed by conventional spin echo or gradient echo imaging sequences. The RF saturation pulse is typically a Gaussian pulse placed at a frequency that is far from the narrow line of free water, but still on-resonance for bound water with a spectral linewidth of several kilohertz. The off-resonance Gaussian pulse results in selective saturation of bound water, which exchanges with the free water, leading to a loss of longitudinal magnetization and hence a decrease in free water magnetization (94). MT is ideal for probing interactions between protons bound to macromolecules and free water protons of tissue. One limitation is that conventional clinical MT sequences can only be applied to long-T2 tissues, such as articular cartilage, muscle, etc. The MT effects in short-T2 tissues, such as cortical bone, are inaccessible. This technical challenge may be resolved by developing magnetization-prepared 2D or 3D UTE sequences.
Springer et al. (69) first investigated magnetization transfer contrast imaging in bovine and human cortical bone, where a 3D UTE sequence with a rectangular-shaped on-resonance excitation pulse and a Gaussian-shaped off-resonant saturation pulse for MT preparation was applied. An MTR was calculated from the 3D UTE datasets acquired with a series of off-resonance frequencies of the MT pulse, after correction for direct on-resonance saturation effects of the MT prepulses. They found that in vivo studies of the MT effect of cortical bone are feasible under clinical conditions on a 3-T scanner. Figure 21 shows an example in which a mean in vivo MTR value of 0.30 ± 0.08 was found for tibial cortical bone of healthy volunteers (69).
Figure 21.
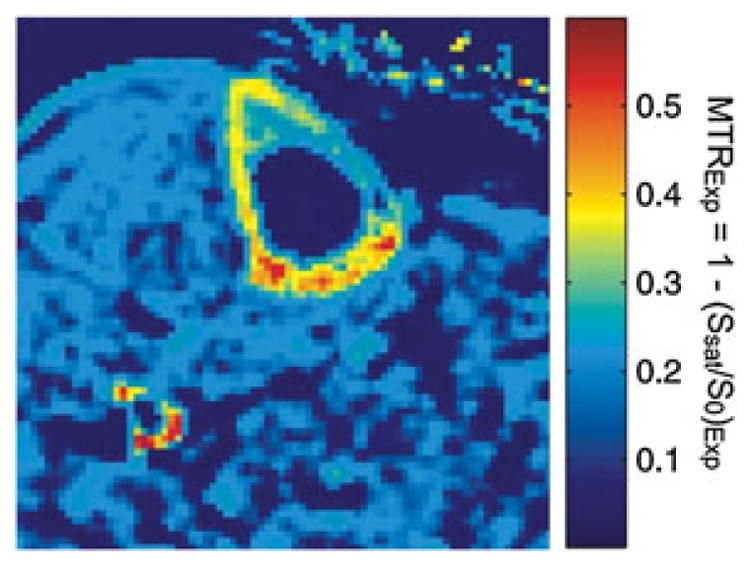
Pixelwise calculated in vivo magnetization transfer ratio [MTRExp = 1 − (Ssat/S0)Exp] map of human tibial cortical bone. The magnetization transfer (MT) pulse was applied at an off-resonance frequency of 10 kHz and the MT pulse flip angle was 300°. From ref. (69), with permission.
Bone perfusion
The importance of skeletal perfusion in bone health is apparent from a large number of studies which have shown a direct relation between bone perfusion and bone remodeling (42–48). Therefore, noninvasive methods for the measurement of bone hemodynamics would be desirable.
Dynamic contrast-enhanced MRI has been applied for the kinetic analysis of various tissues, such as brain lesions and body tumors. Typically, it requires the measurement of the dynamic MRI signal over the ROI using a fast gradient echo sequence. Its application to bone perfusion characterization has been limited so far by the lack of detectable signal from cortical bone (53,97). UTE sequences offer an opportunity to measure signal from cortical bone. 2D UTE acquisitions with a short TR (e.g. ~20 ms) allow the imaging of contrast dynamics in cortical bone with relatively high spatial and temporal resolution (20–30 s per frame) (97). The classical Tofts model can be applied to process the data with the transfer constant (Ktrans), the elimination rate (kep), the volume fraction of the plasma space (vp) and the bolus arrival time as free parameters (97,98).
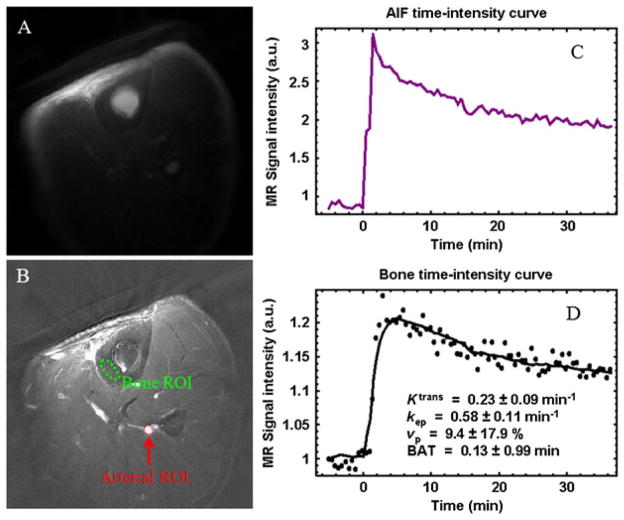
UTE perfusion imaging was performed on the tibial midshaft of a healthy volunteer. Figure 22 shows representative UTE images obtained pre-injection (A) and with peak enhancement minus the pre-injection value (B). The ROIs for the arterial input function and cortical bone are shown in (B). The bone SNR was 29 pre-injection and peaked at 34 about 3 min after injection. (C) and (D) display the corresponding kinetic analyses. Ktrans and kep were estimated to be 0.23 and 0.58 min−1, respectively.
Figure 22.
Tibia of a volunteer: pre-injection (A), peak enhancement minus the pre-injection value (B), contrast enhancement curve for an arterial region of interest (ROI) (C) and bone ROI (D). A temporal resolution of 30 s per frame was achieved with a TR of 20 ms and an acquired voxel size of 0.6 × 0.6 × 10 mm3. Kinetic analysis shows Ktrans = 0.23 min−1, kep = 0.58 min−1 and vp = 9.4%. BAT, bolus arrival time.
Recent studies have shown that OP has an effect on marrow perfusion (45,46). In subjects with low bone mass and OP, bone perfusion in the proximal femur is reduced (46). Both the vascular permeability and plasma elimination rate decrease as BMD decreases (45). Direct assessment of bone perfusion with UTE sequences and pharmacokinetic modeling may further increase our understanding of bone vascularity, metabolism and related diseases.
Summary of quantitative imaging of cortical bone
Quantitative UTE techniques can provide measurements of T1, T2*, total water, bound water, free water, phosphorus, sodium and bone perfusion parameters. T1 and T2* are related to bone water states (12,53). The bound water concentration is an indirect measure of organic matrix density (64–67). The free water concentration is an indirect measure of cortical porosity (61,85). Bone perfusion has been shown to decrease significantly with age and the presence of OP (42–48). Phosphorus imaging provides an indirect measure of bone mineralization (66–68). MT provides information about bound and free water fractions, as well as their T1 and T2 values (69,94–96). These parameters have the potential to provide new indices of bone quality for fracture risk assessment. They may have a major impact on the diagnosis and therapeutic monitoring of OP.
Among the various MR measures of cortical bone, bone water (total, bound and free water) may have the greatest potential for bone quality evaluation. A recent study by Wehrli and colleagues (61) showed that the bone water content was 135% higher in patients receiving maintenance dialysis than in premenopausal women, and was 43% higher in postmenopausal than premenopausal women. There was no significant difference in tibial volumetric BMD between patients receiving hemodialysis and pre- and postmenopausal healthy subjects in this study. The authors indicated that the UTE signal source was from free water in large pores.
The WASPI signal from cortical bone, however, has been shown to be from water bound to the organic matrix (64). Recent work by Cao et al. (65) has shown that the WASPI signal is highly correlated with the organic matrix density, and that the WASPI signal can be converted to true 3D bone matrix substance density. These studies are consistent with good suppression of the free bone water signal by the low-power and long-duration, frequency-selective 90° pulse, followed by gradient dephasing in the WASPI sequence, leaving only water bound to the organic matrix to be detected by the 3D data acquisition.
Our recent studies have demonstrated that there is significant UTE signal detectable from bovine cortical bone after 3 days of air drying to remove free water, which suggests that both bound and free bone water contribute to the UTE signal (84). The high correlation between the UTE-measured free water loss and the gravimetric measurement of bone water loss during air drying, and the significant correlation between the UTE-measured bound water loss and the gravimetric measurement of bone water loss during oven drying, provide support for the effectiveness of the UTE bi-component approach for the separation of bound water from free water (84).
The importance of bound and free water separation was demonstrated by a more recent study by Horch et al. (86), which showed that bound and free water make different contributions to the mechanical properties of cortical bone. Water bound to the organic matrix is positively correlated with peak stress, whereas free water in pores is negatively correlated with the peak stress of cortical bone. Therefore, it is of critical importance to separate bound from free water.
Direct imaging of bound water in cortical bone can be achieved with UTE imaging, together with efficient long-T2 suppression techniques, such as WASPI (64) or SIR-UTE (59). More recently, Ong et al. (99) have reported the use of a deuterium NMR technique to quantify unambiguously free and collagen-bound water in cortical bone. They found that 60–80% of detectable bone water is collagen bound, which is comparable with results from UTE bi-component analysis. A dual adiabatic full passage (DAFP) T2 filter has been proposed recently to selectively image free bone water (100). In this technique, consecutive AFP pulses are employed to saturate bound water, whilst leaving free water unaffected and detectable with a conventional UTE data acquisition (100). Similarly, a single AIR scheme can be used to invert and null free water, creating a predominantly bound water signal (100). Easier and more direct imaging of free water in cortical bone can be achieved with conventional FSE imaging, which shows giant canals with clinical sequences (89). As giant canals contribute significantly to cortical porosity and bone biomechanics, FSE assessment of cortical bone structure may have significant clinical potential.
It is noteworthy that the quantification of MR relaxation times (T1 and T2*), as well as other tissue properties of cortical bone (total, bound and free water), may be affected by machine hardware limitations. These include relatively long-duration excitation (especially slice-selective half-pulses) and preparation (90° and 180°) pulses because of the limited peak RF power available on clinical MR scanners. Significant transverse relaxation may occur during the rotation of bone magnetization, resulting in errors in quantification of T1 and T2* relaxation times. The Bloch equation simulations show that ~18% of the cortical bone signal (assuming a T2* value of 400 μs) may be lost during a hard 90° pulse (assuming a duration of 256 μs) excitation (101,102). This is one of the challenges in the quantification of cortical bone using clinical MR systems. Another challenge for the clinical imaging of cortical bone is the relatively long scan time needed for morphological and quantitative UTE imaging. More advanced data acquisition schemes, such as cone trajectories (103), and image reconstruction techniques, such as compressed sensing (104–106), may help to reduce the data acquisition time.
CONCLUSIONS
In summary, there is significant interest in the direct imaging and quantification of cortical bone using UTE imaging techniques. Bone contrast can be generated with a variety of techniques, including dual echo acquisition and echo subtraction, long-T2 saturation, dual-band saturation, single adiabatic inversion and signal nulling, dual adiabatic inversion and signal nulling, UTESI and combinations of these techniques. MR properties of cortical bone, including its T1 and T2* relaxation times, can be measured with a combination of UTE techniques with appropriate preparation pulses. Tissue properties of cortical bone, including its bound water content, free water content and total water content, can be quantified with a variety of techniques, such as WASPI, UTE bi-component analysis, DAFP preparation or AIR preparation. Bone perfusion can be evaluated through UTE imaging of contrast dynamics in cortical bone with relatively high spatial and temporal resolution. Further research is needed to validate the accuracy of these quantitative techniques, as well as to correlate results with other measurements of cortical porosity and the biomechanical properties of bone.
Acknowledgments
The authors are grateful for grant support from GE Healthcare, the Radiological Society of North America (RSNA research scholarship) and the National Institutes of Health (NIH) 1R21AR057901-01A1. The authors are also indebted to Drs Christine Chung, Mark Bydder, Nikolaus Szeverenyi, Won Bae, Olivier Girard, Michael Carl, Sheronda Statum and Richard Znamirowski for their help in preparing the article.
Abbreviations used
- AFP
adiabatic full passage
- AIR
adiabatic inversion recovery
- BMD
bone mineral density
- CNR
contrast-to-noise ratio
- μCT
microcomputed tomography
- 2D
two-dimensional
- 3D
three-dimensional
- DAFP
dual adiabatic full passage
- DEXA
dual-energy X-ray absorptiometry
- DIR-UTE
dual adiabatic inversion recovery UTE
- dual-band UTE
saturation via dual-band saturation pulses
- dUTE
dual-echo UTE with echo subtraction
- FID
free induction decay
- FSE
fast spin echo
- GRE
gradient recalled echo
- IR-UTE
inversion by adiabatic inversion pulses
- MT
magnetization transfer
- MTR
magnetization transfer ratio
- OP
osteoporosis
- PETRA
pointwise encoding time reduction with radial acquisition
- RF
radiofrequency
- ROI
region of interest
- sdUTE
long-T2 saturation dual-echo UTE with echo subtraction
- SIR-UTE
single adiabatic inversion recovery UTE
- SNR
signal-to-noise ratio
- sUTE
long-T2 saturation UTE
- SWIFT
sweep imaging with Fourier transformation
- TELEX
T2-selective RF excitation
- TI
delay time
- UTE
ultrashort TE
- UTE-OSC
UTE with off-resonance saturation
- UTE-RS
dual-echo UTE with rescaled subtraction
- UTESI
ultrashort-TE spectroscopic imaging
- VERSE
variable rate selective excitation
- WASPI
water- and fat-suppressed proton projection MRI
- WHO
World Health Organization
- ZTE
zero TE
References
- 1.World Health Organization (WHO) WHO Technical Report Series 843. WHO; Geneva: 1994. Assessment of fracture risk and its application to screening for postmenopausal osteoporosis. [PubMed] [Google Scholar]
- 2.Genant HK, Cooper C, Poor G, Reid I, Ehrlich G, Kanis J, Nordin BEC, Barrett-Connor E, Black D, Bonjour J-P, Dawson-Hughes B, Delmas PD, Dequeker J, Eis SR, Gennari LR, Martin TJ, Masri B, Mautalen CA, Meunier PJ, Miller PD, Mithal A, Morii H, Papapoulos S, Woolf A, Yu W, Khaltaev N. Interim report and recommendations of the World Health Organization task-force for osteoporosis. Osteoporos Int. 1999;10:259–264. doi: 10.1007/s001980050224. [DOI] [PubMed] [Google Scholar]
- 3.Faulkner KG. Bone matters: are density increases necessary to reduce fracture risk? J Bone Miner Res. 2000;15:183–187. doi: 10.1359/jbmr.2000.15.2.183. [DOI] [PubMed] [Google Scholar]
- 4.Schuit SCE, Klift M, Weel AEAM, de Laet CEDH, Burger H, Seeman E, Hofman A, Uitterlinden AG, van Leeuwen JPTM, Pols HAP. Fracture incidence and association with bone mineral density in elderly men and women: the Rotterdam study. Bone. 2004;34:195–202. doi: 10.1016/j.bone.2003.10.001. [DOI] [PubMed] [Google Scholar]
- 5.Kanis JA, Johnell O, Oden A, Dawson A, De Laet C, Jonsson B. Ten year probabilities of osteoporotic fractures according to BMD and diagnostic thresholds. Osteoporos Int. 2001;12:989–995. doi: 10.1007/s001980170006. [DOI] [PubMed] [Google Scholar]
- 6.Cummings SR, Karpf DB, Harris F, Genant HK, Ensrud K, LaCroix AZ, Black DM. Improvement in spine bone density and reduction in risk of vertebral fractures during treatment with antiresorptive drugs. Am J Med. 2002;112:281–289. doi: 10.1016/s0002-9343(01)01124-x. [DOI] [PubMed] [Google Scholar]
- 7.De Lact C, van Hout B, Burger H, Hofman A, Pols H. Bone density and the risk of hip fracture in men and women: cross sectional analysis. Br Med J. 1997;315:221–225. doi: 10.1136/bmj.315.7102.221. [DOI] [PMC free article] [PubMed] [Google Scholar]
- 8.Brandi ML. Microarchitecture, the key to bone quality. Rheumatology. 2009;48:3–8. doi: 10.1093/rheumatology/kep273. [DOI] [PubMed] [Google Scholar]
- 9.Cummings SR, Nevitt MC, Browner WS, Stone K, Fox KM, Ensrud KE, Cauley J, Black D, Vogt TM. Risk factors for hip fracture in white women. Study of osteoporotic fractures research group. N Engl J Med. 1995;332:767–773. doi: 10.1056/NEJM199503233321202. [DOI] [PubMed] [Google Scholar]
- 10.Miller PD, Bonnick SL, Rosen CJ, Altman RD, Avioli LV, Dequeker J, Felsenberg D, Genant HK, Gennari C, Harper KD, Hodsman AB, Kleerekoper M, Mautalen CA, McClung MR, Meunier PJ, Nelson DA, Peel NF, Raisz LG, Recker RR, Utian WH, Wasnich RD, Watts NB. Clinical utility of bone mass measurements in adults: consensus of an international panel. Semin Arthritis Rheum. 1996;25:361–372. doi: 10.1016/s0049-0172(96)80001-1. [DOI] [PubMed] [Google Scholar]
- 11.Thompson DD. Age changes in bone mineralization: cortical thickness and Haversian canal area. Calcif Tissue Int. 1980;31:5–11. doi: 10.1007/BF02407161. [DOI] [PubMed] [Google Scholar]
- 12.Wehrli FW, Song HK, Saha PK, Wright AC. Quantitative MRI for the assessment of bone structure and function. NMR Biomed. 2006;19:731–764. doi: 10.1002/nbm.1066. [DOI] [PubMed] [Google Scholar]
- 13.Wehrli FW, Ford JC, Attie M, Kressel HY, Kaplan FS. Trabecular structure: preliminary application of MR interferometry. Radiology. 1991;179:615–621. doi: 10.1148/radiology.179.3.2027962. [DOI] [PubMed] [Google Scholar]
- 14.Majumdar S, Lin J, Link T, Millard J, Augat P, Ouyang X, Gould NR, Genant H. Fracture analysis of radiographs: assessment of trabecular bone structure and prediction of elastic modulus and strength. Med Phys. 1999;26:1330–1340. doi: 10.1118/1.598628. [DOI] [PubMed] [Google Scholar]
- 15.Veenland J, Link T, Konermann W, Meier N, Grashuis J, Gelsema E. Unraveling the role of structure and density in determining vertebral bone strength. Calcif Tissue Int. 1997;61:474–479. doi: 10.1007/s002239900370. [DOI] [PubMed] [Google Scholar]
- 16.Chevalier F, Laval-Jeantet A, Laval-Jeantet M, Bergot C. CT image analysis of the vertebral trabecular network in vivo. Calcif Tissue Int. 1992;51:8–13. doi: 10.1007/BF00296208. [DOI] [PubMed] [Google Scholar]
- 17.Burrows M, Liu D, McKay H. High-resolution peripheral QCT imaging of bone micro-structure in adolescents. Osteoporos Int. 2009;21:515–520. doi: 10.1007/s00198-009-0913-2. [DOI] [PubMed] [Google Scholar]
- 18.Wehrli FW, Leonard MB, Saha PK, Song H, Gomberg BR. Quantitative high-resolution magnetic resonance imaging reveals structural implications of renal osteodystrophy on trabecular and cortical bone. J Magn Reson Imaging. 2004;20:83–89. doi: 10.1002/jmri.20085. [DOI] [PubMed] [Google Scholar]
- 19.Mintzopoulos D, Ackerman JL, Song YQ. MRI of trabecular bone using a decay due to diffusion in the internal field contrast imaging sequence. J Magn Reson Imaging. 2011;34:361–371. doi: 10.1002/jmri.22612. [DOI] [PMC free article] [PubMed] [Google Scholar]
- 20.McCalden RW, McGeough JA, Barker MB, Court-Brown CM. Age-related changes in the tensile properties of cortical bone: the relative importance of changes in porosity, mineralization and microstructure. J Bone Joint Surg Am. 1993;75:1193–1205. doi: 10.2106/00004623-199308000-00009. [DOI] [PubMed] [Google Scholar]
- 21.Diab T, Vashishth D. Effects of damage morphology on cortical bone fragility. Bone. 2005;37:96–102. doi: 10.1016/j.bone.2005.03.014. [DOI] [PubMed] [Google Scholar]
- 22.Martin RB, Burr DB. Structure, Function, and Adaptation of Compact Bone. Raven Press; New York, NY: 1989. The microscopic structure of bone. [Google Scholar]
- 23.Bousson V, Meunier A, Bergot C, Vicaut E, Rocha MA, Morais MH, Laval-Jeantet AM, Laredo JD. Distribution of intracortical porosity in human midfemoral cortex by age and gender. J Bone Miner Res. 2001;16:1308–1317. doi: 10.1359/jbmr.2001.16.7.1308. [DOI] [PubMed] [Google Scholar]
- 24.Schaffler MB, Burr DB. Stiffness of compact bone: effects of porosity and density. J Biomech. 1988;21:13–16. doi: 10.1016/0021-9290(88)90186-8. [DOI] [PubMed] [Google Scholar]
- 25.Currey J. The effect of porosity and mineral content on Young’s modulus of elasticity of compact bone. J Biomech. 1988;21:131–139. doi: 10.1016/0021-9290(88)90006-1. [DOI] [PubMed] [Google Scholar]
- 26.Yeni YN, Brown CU, Norman TL. Influence of bone composition and apparent density on fracture toughness of the human femur and tibia. Bone. 1998;22:79–84. doi: 10.1016/s8756-3282(97)00227-5. [DOI] [PubMed] [Google Scholar]
- 27.Burghardt AJ, Kazakia GJ, Ramachandran S, Link TM, Majumdar S. Age and gender related differences in the geometric properties and biomechanical significance of intra-cortical porosity in the distal radius and tibia. J Bone Miner Res. 2010;25:983–993. doi: 10.1359/jbmr.091104. [DOI] [PMC free article] [PubMed] [Google Scholar]
- 28.Martin RB, Ishida J. The relative effects of collagen fiber orientation, porosity, density, and mineralization on bone strength. J Biomech. 1989;22:419–426. doi: 10.1016/0021-9290(89)90202-9. [DOI] [PubMed] [Google Scholar]
- 29.Boskey AL, Wright TM, Blank RD. Collagen and bone strength. J Bone Miner Res. 1999;14:330–335. doi: 10.1359/jbmr.1999.14.3.330. [DOI] [PubMed] [Google Scholar]
- 30.Zioupos P, Currey JD, Hamer AJ. The role of collagen in the declining mechanical properties of aging human cortical bone. J Biomed Mater Res. 1999;45:108–116. doi: 10.1002/(sici)1097-4636(199905)45:2<108::aid-jbm5>3.0.co;2-a. [DOI] [PubMed] [Google Scholar]
- 31.Lees S. A mixed pacing model for bone collagen. Calcif Tissue Int. 1981;33:591–602. doi: 10.1007/BF02409497. [DOI] [PubMed] [Google Scholar]
- 32.Wang X, Shen X, Li X, Mauli Agrawal C. Age-related changes in the collagen network and toughness of bone. Bone. 2002;31:1–7. doi: 10.1016/s8756-3282(01)00697-4. [DOI] [PubMed] [Google Scholar]
- 33.Neuman WF, Neuman MW. The Chemical Dynamics of Bone Mineral. University of Chicago Press; Chicago, IL: 1958. p. 101. [Google Scholar]
- 34.Robinson RA, Elliot SR. The water content of bone. J Bone Joint Surg. 1957;39:167–188. [PubMed] [Google Scholar]
- 35.Elliott SR, Robinson RA. The water content of bone.2I. The mass of water, inorganic crystals, organic matrix, and CO space components in a unit volume of the dog bone. J. Bone Joint Surg. Am. 1957;39(A):167–188. [PubMed] [Google Scholar]
- 36.Timmins PA, Wall JC. Bone water. Calcif Tissue Res. 1977;23:1–5. doi: 10.1007/BF02012759. [DOI] [PubMed] [Google Scholar]
- 37.Mueller KH, Trias A, Ray RD. Bone density and composition: age-related and pathological changes in water and mineral content. J Bone Joint Surg Am. 1966;48:140–148. [PubMed] [Google Scholar]
- 38.Morris MA, Lopez-Curto JA, Hughes SPF, An K, Bassingthwaighte JB, Kelly PJ. Fluid spaces in canine bone and marrow. Microvasc Res. 1982;32:188–200. doi: 10.1016/0026-2862(82)90064-4. [DOI] [PMC free article] [PubMed] [Google Scholar]
- 39.Cowin SC. Bone poroelasticity. J Biomech. 1999;32:217–238. doi: 10.1016/s0021-9290(98)00161-4. [DOI] [PubMed] [Google Scholar]
- 40.Nyman JS, Roy A, Shen X, Rae LA, Tyler JH, Wang X. The influence of water removal on the strength and toughness of cortical bone. J Biochem. 2006;39(5):931–938. doi: 10.1016/j.jbiomech.2005.01.012. [DOI] [PMC free article] [PubMed] [Google Scholar]
- 41.Wehrli FW, Fernandez-Seara MA. Nuclear magnetic resonance studies of bone water. Ann Biomed Eng. 2005;33:79–86. doi: 10.1007/s10439-005-8965-8. [DOI] [PubMed] [Google Scholar]
- 42.Hawkins RA, Choi Y, Huang SC, Hoh CK, Dahlbom M, Schiepers C, Satyamurthy N, Barrio JR, Phelps ME. Evaluation of the skeletal kinetics of fluorine-18-fluoride ion with PET. J Nucl Med. 1992;33:633–642. [PubMed] [Google Scholar]
- 43.Reeve J, Arlot M, Wootton R, Edouard C, Tellez M, Hesp R, Green JR, Meunier PJ. Skeletal blood flow, iliac histomorphometry, and strontium kinetics in osteoporosis: a relationship between blood flow and corrected apposition rate. J Clin Endocrinol Metab. 1988;66:1124–1131. doi: 10.1210/jcem-66-6-1124. [DOI] [PubMed] [Google Scholar]
- 44.McCarthy I. The physiology of bone blood flow: a review. J Bone Joint Surg. 2006;88:4–9. doi: 10.2106/JBJS.F.00890. [DOI] [PubMed] [Google Scholar]
- 45.Ma HT, Griffith JF, Yeung DK, Leung PC. Pharmacokinetic modeling study on bone perfusion of osteoporosis. Proceedings of the 18th Annual Meeting ISMRM; Stockholm, Sweden. 2010; 1968. [Google Scholar]
- 46.Wang YX, Griffith JF, Kwok AWL, Leung JCS, Yeung DKW, Ahuja AT, Leung PC. Reduced bone perfusion in proximal femur of subjects with decreased bone mineral density preferentially affects the femoral neck. Bone. 2009;45:711–715. doi: 10.1016/j.bone.2009.06.016. [DOI] [PubMed] [Google Scholar]
- 47.Eriksen EF, Eghbali-Fatourechi GZ, Khosla S. Remodeling and vascular spaces in bone. J Bone Miner Res. 2007;22:1–6. doi: 10.1359/jbmr.060910. [DOI] [PubMed] [Google Scholar]
- 48.Vogt MT, Cauley JA, Kuller LH, Nevitt MC. Bone mineral density and blood flow to the lower extremities: the study of osteoporotic fractures. J Bone Miner Res. 1997;12:283–289. doi: 10.1359/jbmr.1997.12.2.283. [DOI] [PubMed] [Google Scholar]
- 49.Bergin CJ, Pauly JM, Macovski A. Lung parenchyma: projection reconstruction MR imaging. Radiology. 1991;179:777–781. doi: 10.1148/radiology.179.3.2027991. [DOI] [PubMed] [Google Scholar]
- 50.Conolly S, Nishimura D, Macovski A, Glover G. Variable-rate selective excitation. J Magn Reson. 1988;78:440–458. [Google Scholar]
- 51.Sussman MS, Pauly JM, Wright GA. Design of practical T2-selective RF excitation (TELEX) pulses. Magn Reson Med. 1998;40:890–899. doi: 10.1002/mrm.1910400615. [DOI] [PubMed] [Google Scholar]
- 52.Robson MD, Gatehouse PD, Bydder M, Bydder GM. Magnetic resonance: an introduction to ultrashort TE (UTE) imaging. J Comput Assist Tomogr. 2003;27:825–846. doi: 10.1097/00004728-200311000-00001. [DOI] [PubMed] [Google Scholar]
- 53.Reichert ILH, Robson MD, Gatehouse PD, He T, Chappell KE, Holmes J, Girgis S, Bydder GM. Magnetic resonance imaging of cortical bone with ultrashort TE (UTE) pulse sequences. Magn Reson Imaging. 2005;23:611–618. doi: 10.1016/j.mri.2005.02.017. [DOI] [PubMed] [Google Scholar]
- 54.Larson PE, Conolly SM, Pauly JM, Nishimura DG. Using adiabatic inversion pulses for long-T2 suppression in ultrashort echo time (UTE) imaging. Magn Reson Med. 2007;58:952–961. doi: 10.1002/mrm.21341. [DOI] [PMC free article] [PubMed] [Google Scholar]
- 55.Du J, Hamilton G, Takahashi A, Bydder M, Chung CB. Ultrashort TE spectroscopic imaging (UTESI) of cortical bone. Magn Reson Med. 2007;58:1001–1009. doi: 10.1002/mrm.21397. [DOI] [PubMed] [Google Scholar]
- 56.Du J, Takahashi A, Bydder M, Chung CB. Two dimensional ultrashort echo time imaging using a spiral trajectory. Magn Reson Imaging. 2008;26:304–312. doi: 10.1016/j.mri.2007.08.005. [DOI] [PubMed] [Google Scholar]
- 57.Du J, Takahashi A, Bydder M, Chung CB, Bydder GM. Ultrashort TE imaging with off-resonance saturation contrast (UTE-OSC) Magn Reson Med. 2009;62:527–531. doi: 10.1002/mrm.22007. [DOI] [PubMed] [Google Scholar]
- 58.Du J, Takahashi A, Bae WC, Chung CB, Bydder GM. Dual inversion recovery, ultrashort echo time (DIR UTE) imaging: creating high contrast for short-T2 species. Magn Reson Med. 2010;63:447–455. doi: 10.1002/mrm.22257. [DOI] [PMC free article] [PubMed] [Google Scholar]
- 59.Du J, Carl M, Bydder M, Takahashi A, Chung CB, Bydder GM. Qualitative and quantitative ultrashort echo time (UTE) imaging of cortical bone. J Magn Reson. 2010;207:304–311. doi: 10.1016/j.jmr.2010.09.013. [DOI] [PubMed] [Google Scholar]
- 60.Techawiboonwong A, Song HK, Wehrli FW. In vivo MRI of submilli second T2 species with two-dimensional and three-dimensional radial sequences and applications to the measurement of cortical bone water. NMR Biomed. 2008;21:59–70. doi: 10.1002/nbm.1179. [DOI] [PubMed] [Google Scholar]
- 61.Techawiboonwong A, Song HK, Leonard MB, Wehrli FW. Cortical bone water: in vivo quantification with ultrashort echo-time MR imaging. Radiology. 2008;248:824–833. doi: 10.1148/radiol.2482071995. [DOI] [PMC free article] [PubMed] [Google Scholar]
- 62.Rahmer J, Bornert P, Groen J, Bos C. Three-dimensional radial ultra-short echo-time imaging with T2 adapted sampling. Magn Reson Med. 2006;55:1075–1082. doi: 10.1002/mrm.20868. [DOI] [PubMed] [Google Scholar]
- 63.Du J, Bydder M, Takahashi AM, Carl M, Chung CB, Bydder GM. Short T2 contrast with three-dimensional ultrashort echo time imaging. Magn Reson Imaging. 2011;29:470–482. doi: 10.1016/j.mri.2010.11.003. [DOI] [PMC free article] [PubMed] [Google Scholar]
- 64.Wu Y, Ackerman JL, Chesler DA, Graham L, Wang Y, Glimcher MJ. Density of organic matrix of native mineralized bone measured by water- and fat-suppressed proton projection MRI. Magn Reson Med. 2003;50:59–68. doi: 10.1002/mrm.10512. [DOI] [PubMed] [Google Scholar]
- 65.Cao H, Ackerman JL, Hrovat MI, Graham L, Glimcher MJ, Wu Y. Quantitative bone matrix density measurement by water- and fat-suppressed proton projection MRI (WASPI) with polymer calibration phantoms. Magn Reson Med. 2008;60:1433–1443. doi: 10.1002/mrm.21771. [DOI] [PMC free article] [PubMed] [Google Scholar]
- 66.Cho G, Wu Y, Ackerman JL. Detection of hydroxyl ions in bone mineral by solid-state NMR spectroscopy. Science. 2003;300:1123–1127. doi: 10.1126/science.1078470. [DOI] [PubMed] [Google Scholar]
- 67.Wu Y, Hrovat MI, Ackerman JL, Reese TG, Cao H, Ecklund K, Glimcher MJ. Bone matrix imaged in vivo by water- and fat-suppressed proton projection MRI (WASPI) of animal and human subjects. J Magn Reson Imaging. 2010;31:954–963. doi: 10.1002/jmri.22130. [DOI] [PMC free article] [PubMed] [Google Scholar]
- 68.Wehrli F. Role of MRI and MRS for the study of bone and bone marrow in animal models of disease. Sunrise Lecture Notes of the 19th Annual Meeting ISMRM; Montreal, Canada. 2011. [Google Scholar]
- 69.Springer F, Martirosian P, Machann J, Schwenzer NF, Claussen CD, Schick F. Magnetization transfer contrast imaging in bovine and human cortical bone applying an ultrashort echo time sequence at 3 Tesla. Magn Reson Med. 2009;61:1040–1048. doi: 10.1002/mrm.21866. [DOI] [PubMed] [Google Scholar]
- 70.Springer F, Martirosian P, Schwenzer NF, Szimtenings M, Kreisler P, Claussen CD, Schick F. Three-dimensional ultrashort echo time imaging of solid polymers on a 3-Tesla whole-body MRI scanner. Invest Radiol. 2008;43:802–808. doi: 10.1097/RLI.0b013e318188601f. [DOI] [PubMed] [Google Scholar]
- 71.Springer F, Steidle G, Martirosian P, Syha R, Claussen CD, Schick F. Rapid assessment of longitudinal relaxation time in materials and tissue with extremely fast signal decay using UTE sequences and the variable flip angle method. Invest Radiol. 2011;46:610–617. doi: 10.1097/RLI.0b013e31821c44cd. [DOI] [PubMed] [Google Scholar]
- 72.Du J, Takahashi AM, Shimakawa A, Bydder M, Sinha S, Bydder GM. Ultrashort TE (UTE) imaging of the cortical bone at 3T. Proceedings of the 15th Annual Meeting ISMRM; Berlin, Germany. 2007. p. 381. [Google Scholar]
- 73.Du J, Chiang AJ, Chung CB, Statum S, Znamirowski R, Takahashi A, Bydder GM. Orientational analysis of the Achilles tendon and enthesis using an ultrashort echo time spectroscopic imaging sequence. Magn Reson Imaging. 2010;28:178–184. doi: 10.1016/j.mri.2009.06.002. [DOI] [PubMed] [Google Scholar]
- 74.Li C, Magland J, Rad H, Song HK, Wehrli F. Comparison of optimized soft-tissue suppression schemes for ultrashort echo time (UTE) MRI. Magn Reson Med. 2011;68:680–689. doi: 10.1002/mrm.23267. (Epub ahead of print) [DOI] [PMC free article] [PubMed] [Google Scholar]
- 75.Grodzki DM, Jakob PM, Heismann B. Ultrashort echo time imaging using pointwise encoding time reduction with radial acquisition (PETRA) Magn Reson Med. 2011;67:510–518. doi: 10.1002/mrm.23017. (Epub ahead of print) [DOI] [PubMed] [Google Scholar]
- 76.Weiger M, Pruessmann KP, Hennel F. MRI with zero echo time: hard versus sweep pulse excitation. Magn Reson Med. 2011;66:379–389. doi: 10.1002/mrm.22799. [DOI] [PubMed] [Google Scholar]
- 77.Idiyatullin D, Corum C, Park JY, Garwood M. Fast and quiet MRI using a swept radiofrequency. J Magn Reson. 2006;181:342–349. doi: 10.1016/j.jmr.2006.05.014. [DOI] [PubMed] [Google Scholar]
- 78.Du J, Corbeil J, Znamirowski R, Angle N, Peterson M, Bydder GM, Kahn AM. Direct imaging and quantification of carotid plaque calcification. Magn Reson Med. 2011;65:1013–1020. doi: 10.1002/mrm.22682. [DOI] [PubMed] [Google Scholar]
- 79.Lu A, Daniel BL, Pauly JM, Pauly KB. Improved slice selection for R2* mapping during cryoablation with eddy current compensation. J Magn Reson Imaging. 2008;28:190–198. doi: 10.1002/jmri.21396. [DOI] [PMC free article] [PubMed] [Google Scholar]
- 80.Anastasiou A, Hall LD. Optimisation of T2 and M0 measurements of bi-exponential systems. Magn Reson Imaging. 2004;22:67–80. doi: 10.1016/j.mri.2003.05.005. [DOI] [PubMed] [Google Scholar]
- 81.Diaz E, Chung CB, Bae WC, Statum S, Znamirowski R, Bydder GM, Du J. Ultrashort echo time spectroscopic imaging (UTESI): an efficient method for quantifying bound and free water. NMR Biomed. 2012;25:161–168. doi: 10.1002/nbm.1728. [DOI] [PubMed] [Google Scholar]
- 82.Du J, Diaz E, Carl M, Bae W, Chung C, Bydder GM. Ultrashort echo time imaging with bicomponent analysis. Magn Reson Med. 2012;67:645–649. doi: 10.1002/mrm.23047. [DOI] [PubMed] [Google Scholar]
- 83.Raya JG, Dietrich O, Horng A, Weber J, Reiser MF, Glaser C. T2 measurement in articular cartilage: impact of the fitting method on accuracy and precision at low SNR. Magn. Reson. Med. 2010;63:181–193. doi: 10.1002/mrm.22178. [DOI] [PubMed] [Google Scholar]
- 84.Biswas R, Bae W, Diaz E, Masuda K, Chung C, Bydder GM, Du J. Ultra-short echo time (UTE) imaging with bicomponent analysis: bound and free water evaluation of bovine cortical bone subject to sequential drying. Bone. 2012;50:749–755. doi: 10.1016/j.bone.2011.11.029. [DOI] [PMC free article] [PubMed] [Google Scholar]
- 85.Bae WC, Chen PC, Chung CB, Masuda K, Lima D, Du J. Quantitative ultrashort echo time (UTE) MRI of human cortical bone: correlation with porosity and biomechanical properties. J Bone Miner Res. 2011;27:848–857. doi: 10.1002/jbmr.1535. (Epub ahead of print) [DOI] [PMC free article] [PubMed] [Google Scholar]
- 86.Horch RA, Gochberg DF, Nyman JS, Does MD. Non-invasive predictors of human cortical bone mechanical properties: T-2-discriminated H-1 NMR compared with high resolution X-ray. PLoS One. 2011;6(1):e16359. doi: 10.1371/journal.pone.0016359. [DOI] [PMC free article] [PubMed] [Google Scholar]
- 87.Nyman JS, Ni Q, Nicolella DP, Wang X. Measurements of mobile and bound water by nuclear magnetic resonance correlate with mechanical properties of bone. Bone. 2008;42(1):193–199. doi: 10.1016/j.bone.2007.09.049. [DOI] [PMC free article] [PubMed] [Google Scholar]
- 88.Horch RA, Nyman JS, Gochberg DF, Dortch RD, Does MD. Characterization of 1H NMR signal in human cortical bone for magnetization resonance imaging. Magn. Reson. Med. 2010;64:680–687. doi: 10.1002/mrm.22459. [DOI] [PMC free article] [PubMed] [Google Scholar]
- 89.Du J, Bae W, Bydder CM, Takahashi A, Chung CB, Bydder GM. Assessment of cortical bone structure with FSE, 2D and 3D UTE sequences. ISMRM Workshop: Advances in Musculoskeletal Magnetic Resonance Imaging; 16 February 2009; San Francisco, CA, USA. 2009. [Google Scholar]
- 90.Wehrli FW, Song HK, Saha PK, Wright AC. Quantitative MRI for the assessment of bone structure and function. NMR Biomed. 2006;19:731–764. doi: 10.1002/nbm.1066. [DOI] [PubMed] [Google Scholar]
- 91.Wehrli FW, Fernandez-Seara MA. Nuclear magnetic resonance studies of bone water. Ann Biomed Eng. 2005;33:79–86. doi: 10.1007/s10439-005-8965-8. [DOI] [PubMed] [Google Scholar]
- 92.Fernandez-Seara MA, Wehrli SL, Wehrli FW. Diffusion of exchangeable water in cortical bone studies by nuclear magnetic resonance. Biophys J. 2002;82:522–529. doi: 10.1016/S0006-3495(02)75417-9. [DOI] [PMC free article] [PubMed] [Google Scholar]
- 93.Bell KL, Loveridge N, Reever J, Thomas C, Feik SA, Clement JG. Super-Osteons (remodeling clusters) in the cortex of the femoral shaft influence of age and gender. Anat Rec. 2001;264:378–386. doi: 10.1002/ar.10014. [DOI] [PubMed] [Google Scholar]
- 94.Henkelman RM, Huang X, Xiang Q, Stanisz GJ, Swanson SD, Bronskill MJ. Quantitative interpretation of magnetization transfer. Magn Reson Med. 1993;29:759–766. doi: 10.1002/mrm.1910290607. [DOI] [PubMed] [Google Scholar]
- 95.Henkelman RM, Stanisz GJ, Graham SJ. Magnetization transfer in MRI: a review. NMR Biomed. 2001;14:57–64. doi: 10.1002/nbm.683. [DOI] [PubMed] [Google Scholar]
- 96.Ramani A, Dalton C, Miller DH, Tofts PS, Barker GJ. Precise estimation of fundamental in-vivo MT parameters in human brain in clinically feasible times. Magn Reson Imaging. 2002;20:721–731. doi: 10.1016/s0730-725x(02)00598-2. [DOI] [PubMed] [Google Scholar]
- 97.Girard O, Du J, Bydder GM, Mattrey R. Preliminary results on bone perfusion measurement using dynamic contrast enhanced ultra-short TE imaging. Proceedings of the 19th Annual Meeting ISMRM; Montreal, QC, Canada. 2011. p. 3210. [Google Scholar]
- 98.Tofts P. Modeling tracer kinetics in dynamic Gd-DTPA MR imaging. J Magn Reson Imaging. 1997;7:91–101. doi: 10.1002/jmri.1880070113. [DOI] [PubMed] [Google Scholar]
- 99.Ong HH, Wright AC, Wehrli F. Deuterium nuclear magnetic resonance unambiguously quantifies pore and collagen-bound water in cortical bone. J Bone Miner Res. 2012 doi: 10.1002/jbmr.1709. in press. [DOI] [PMC free article] [PubMed] [Google Scholar]
- 100.Horch R, Gochberg D, Nyman J, Does M. Clinically-compatible MRI strategies for discriminating bound and pore water in cortical bone. Magn Reson Med. 2012;68:1774–1784. doi: 10.1002/mrm.24186. (Epub ahead of print) [DOI] [PMC free article] [PubMed] [Google Scholar]
- 101.Du J, Carl M, Diaz E, Takahashi A, Han E, Szeverenyi NM, Chung CB, Bydder GM. Ultrashort TE T1rho (UTE T1rho) imaging of the Achilles tendon and meniscus. Magn Reson Med. 2010;64:834–842. doi: 10.1002/mrm.22474. [DOI] [PubMed] [Google Scholar]
- 102.Carl M, Bydder M, Du J, Takahashi A, Han E. Optimization of RF excitation to maximize signal and T2 contrast of tissues with rapid transverse relaxation. Magn Reson Med. 2010;64:481–490. doi: 10.1002/mrm.22433. [DOI] [PubMed] [Google Scholar]
- 103.Gurney PT, Hargreaves BA, Nishimura DG. Design and analysis of a practical 3D cones trajectory. Magn Reson Med. 2006;55:575–582. doi: 10.1002/mrm.20796. [DOI] [PubMed] [Google Scholar]
- 104.Lustig M, Donoho D, Pauly JM. Sparse MRI: the application of compressed sensing for rapid MR imaging. Magn Reson Med. 2007;58:1182–1195. doi: 10.1002/mrm.21391. [DOI] [PubMed] [Google Scholar]
- 105.Johnson KM. Radial-Cones: a new sampling scheme for compressed sensing accelerated 3D ultrashort echo time imaging. Proceedings of the 20th Annual Meeting ISMRM; Melbourne, Australia. 2012. p. 285. [Google Scholar]
- 106.Li C, Magland J, Wehrli F. Compressed sensing 3D ultrashort echo time (COMPUTE) imaging. Proceedings of the 20th Annual Meeting ISMRM; Melbourne, Australia. 2012. p. 1402. [Google Scholar]


