Abstract
AMP-activated protein kinase α1 knockout (prkaa1−/−) mice manifest splenomegaly and anemia. The underlying molecular mechanisms, however, remain to be established. In this study, we tested the hypothesis that defective autophagy-dependent mitochondrial clearance in prkaa1−/− mice exacerbates oxidative stress, thereby enhancing erythrocyte destruction. The levels of ULK1 phosphorylation, autophagical flux, mitochondrial contents, and reactive oxygen species (ROS) were examined in human erythroleukemia cell line, K562 cells, as well as prkaa1−/− mouse embryonic fibroblasts and erythrocytes. Deletion of Prkaa1 resulted in the inhibition of ULK1 phosphorylation at Ser555, prevented the formation of ULK1 and BECN1- PtdIns3K complexes, and reduced autophagy capacity. The suppression of autophagy was associated with enhanced damaged mitochondrial accumulation and ROS production. Compared with wild-type (WT) mice, prkaa1−/− mice exhibited a shortened erythrocyte life span, hemolytic destruction of erythrocytes, splenomegaly, and anemia, all of which were alleviated by the administration of either rapamycin to activate autophagy or Mito-tempol, a mitochondria-targeted antioxidant, to scavenge mitochondrial ROS. Furthermore, transplantation of WT bone marrow into prkaa1−/− mice restored mitochondrial removal, reduced intracellular ROS levels, and normalized hematologic parameters and spleen size. Conversely, transplantation of prkaa1 −/− bone marrow into WT mice recapitulated the prkaa1−/− mouse phenotypes. We conclude that PRKAA1-dependent autophagy-mediated clearance of damaged mitochondria is required for erythrocyte maturation and homeostasis.
Keywords: AMPK, autophagy, erythrocyte, mitophagy, oxidative stress
Introduction
In most mammals, mature erythrocytes lack nuclei and organelles.1,2 Erythrocytes have nuclei during the early phase of erythropoiesis, but they expulse the nucleus and remove all intracellular organelles, including mitochondria, Golgi apparatus, and endoplasmic reticula (ERs), during terminal differentiation.3-7 As a result, mature erythrocytes contain more hemoglobin to transport oxygen and produce energy purely through the glycolytic pathway.5,8 The mechanisms by which erythrocytes remove organelles from developing erythroid cells are still being investigated. Because mitochondria are the most abundant organelles in immature erythrocytes, removal of mitochondria is a major process for the completion of erythropoiesis.9-11
Autophagy is a regulated catalytic pathway that includes the engulfment of cytoplasmic components, including long-lived proteins and organelles, and delivery of the cargos to lysosomes for hydrolytic degradation.12,13 Initially, autophagy has been considered a nonselective process,14-17 but recent evidence suggests that autophagy may specifically target intracellular pathogens and organelles such as mitochondria and peroxisomes.17,18 The specific autophagic elimination of mitochondria (mitophagy) is a well-characterized cargo-specific process19-21 that has been implicated in mitochondrial clearance during reticulocyte maturation,22-24 however the mechanisms regulating the removal of mitochondria from developing erythrocytes are incompletely understood.
The AMP-activated protein kinase (AMPK), a serine/threonine kinase conserved from yeast to humans, senses the cellular energy status and controls energy homeostasis by regulating glucose and lipid metabolism.25,26 Mammalian AMPK consists of α, β, and γ subunits, and the α-subunit contains a catalytic kinase domain and exists as either the α1 or α2 isoform. AMPK is activated in response to various cellular stresses, including hypoxia, nutrient deprivation, and oxidative stress.7,27 Once activated, AMPK phosphorylates and regulates several downstream molecules that reduce energy demand and increase energy supply. In addition, AMPK also regulates many other cellular processes, including mitochondrial biogenesis,28,29 apoptosis, and autophagy.30-33 As autophagy and AMPK are both stimulated by nutrient deprivation,34,35 it is reasonable to connect AMPK activation to increased autophagic activity. Indeed, activated AMPK phosphorylates and activates ULK1 (unc-51 like autophagy activating kinase 1), a mammalian ortholog of yeast Atg1 (autophagy-related 1), which initiates the autophagic process.36-39 In the heart, activation of AMPK by metformin induces autophagy and protects against cardiac apoptosis.32,40,41 In addition, several recent studies demonstrated that prkaa1−/− and prkag1−/− mice manifest anemia with splenomegaly and increased hemolytic destruction of erythrocytes.41-45 The underlying mechanism, however, remains to be established.
In this study, we hypothesize that PRKAA1 modulates erythrocyte homeostasis by regulating the selective degradation of mitochondria by autophagy (mitophagy). Here, we report that PRKAA1 inactivation decreases ULK1 phosphorylation, inhibits autophagy-dependent mitochondrial clearance, and increases mitochondrial accumulation, resulting in the hemolytic destruction of erythrocytes via excessive mitochondrial ROS.
Results
Deletion of Prkaa1 reduces ULK1 phosphorylation in mouse TFRC+/CD71+ and GYPA+/Ter119+ erythroid precursors
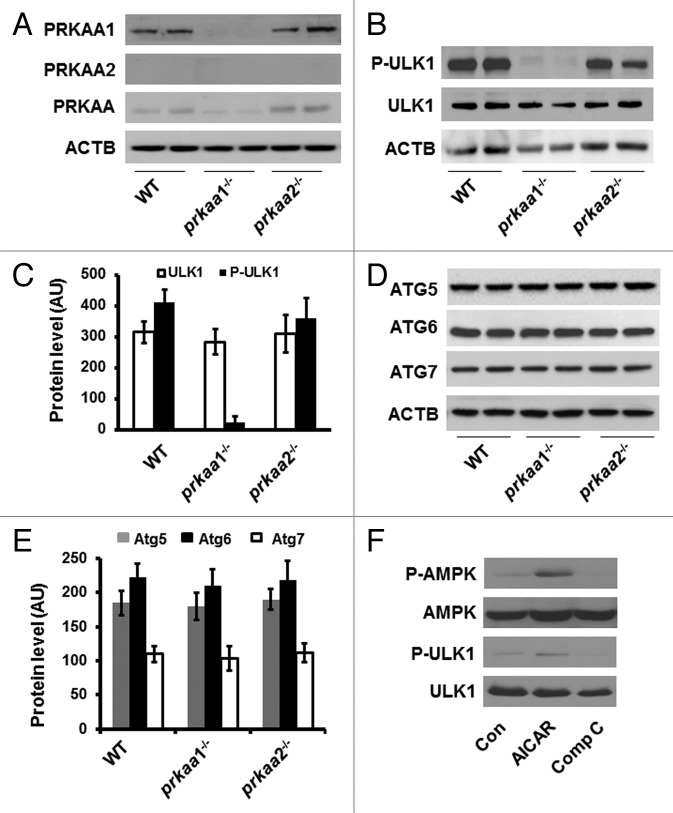
To investigate whether AMPK has a functional role in the regulation of erythrocyte maturation, we first examined the protein levels of PRKAA isoforms in TFRC+ and GYPA+ erthyroid precursors isolated from the bone marrows of WT, prkaa1−/−, and prkaa2−/−. The expression of PRKAA1 in WT TFRC+ and GYPA+ erthyroid precursors was not different from that in prkaa2−/− cells (Fig. 1A). Deletion of the prkaa1 gene completely inhibited PRKAA1 protein expression in prkaa1−/− TFRC+ and GYPA+ erthyroid precursors (Fig. 1A). Western blot analysis using a PRKAA2 antibody that recognized PRKAA2 in mouse embryonic fibroblasts (MEFs) did not detect PRKAA2 isoform in prkaa2−/− TFRC+ and GYPA+ erythroid precursors (Fig. S1). Unexpectedly, the PRKAA2 isoform was not detected in WT and prkaa1−/− TFRC+ and GYPA+ erthyroid precursors either (Fig. 1A). To rule out the possibility that the PRKAA2 antibody did not work well in erythroid precursors, we used an antibody that recognizes both PRKAA1 and PRKAA2 isoforms to approach the amount of PRKAA2 isoform. The western blot indicated that the expression of total PRKAA was significantly inhibited in prkaa1−/− TFRC+ and GYPA+ erythroid precursors but its expression in prkaa2−/− TFRC+ and GYPA+ erythroid precursors remained similar to that in WT TFRC+ and GYPA+ erythroid precursors (Fig. 1A). The residual band detected in prkaa1−/− TFRC+ and GYPA+ erthyroid precursors suggested that the expression of PRKAA2 was very low in these cells (Fig. 1A). Thus, PRKAA1 is the predominant isoform of PRKAA in TFRC+ and GYPA+ erythroid precursors.
Figure 1. Deletion of prkaa1 inhibits ULK1 phosphorylation. (A) Cell lysates prepared from WT, prkaa1−/−, and prkaa2−/− TFRC+ and GYPA+ erythroid precursors were subjected to western blot analyses to detect the expression of PRKAA1, PRKAA2, and total PRKAA. (B) Expression of total and phosphorylated ULK1 (Ser555) in mouse TFRC+ and GYPA+ erythroid precursors was analyzed by western blotting. (C) The expression of ULK1 was quantified by densitometry and normalized to ACTB (n = 4). (D and E) ATG protein levels in mouse TFRC+ and GYPA+ erythroid precursors were detected by western blotting (D) and quantified by densitometry (E). (F) K562 cells were treated with AICAR (2 mM) or Compound C (10 µM) for 4 h, and the cell lysates were subjected to western blotting to determine the phosphorylation of PRKAA (Thr172) and ULK1 (Ser555). The blot shown is representative of 3 independent replicates. Con, control; Comp C, compound C.
Recent reports have indicated that ULK1 is required for autophagy.38 To test whether AMPK regulates the autophagic pathway during erythrocyte maturation, the expression of ATG proteins and phosphorylation of ULK1 (Ser555) were determined in WT and prkaa−/− TFRC+ and GYPA+ erythroid precursors. Compared with the cells from WT or prkaa2−/− mice, prkaa1−/− TFRC+ and GYPA+ erythroid precursors exhibited significantly reduced ULK1 phosphorylation (Fig. 1B and C). However, there was no obvious change in ATG5, ATG6, and ATG7 protein levels in TFRC+ and GYPA+ erythroid precursors from prkaa1−/− and prkaa2−/− mice as compared with the cells form WT mice (Fig. 1D and E), suggesting that the deletion of Prka may suppress autophagy by reducing ULK1 activity.
To validate the effect of AMPK on ULK1 phosphorylation, K562 cells (a human erythroleukemia cell line) were treated with 5-aminoimidazole-4-carboxamide ribonucleoside (AICAR), a potent AMPK activator, or compound C (a potent AMPK inhibitor). Total and phosphorylated ULK1 levels were measured by western blotting. AICAR increased AMPK phosphorylation at Thr172 and ULK1 phosphorylation at Ser555 (Fig. 1F). By contrast, Compound C reduced AMPK phosphorylation at Thr172 and lowered ULK1 phosphorylation at Ser555 (Fig. 1F). Overall, these data are suggestive of AMPK-dependent ULK1 phosphorylation in K562 cells.
Reduced ULK1 phosphorylation at Ser555 inhibits ULK1 complex formation and disrupts the association between AMBRA1 and PtdIns3K
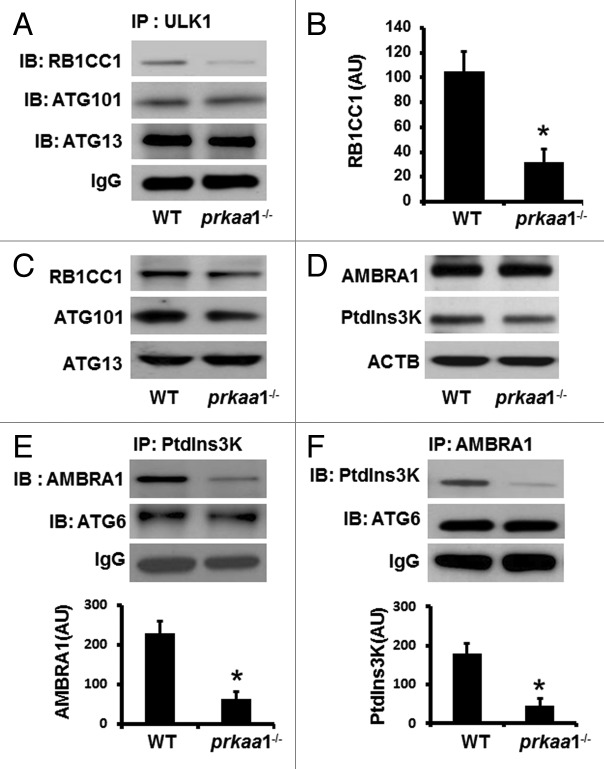
ULK1 complex formation and activation are required for autophagy initiation, we therefore tested whether the suppression of ULK1 phosphorylation at Ser555 in PRKAA1–deficient cells impaired ULK1 complex formation and activation. Although the inhibition of ULK1 phosphorylation had no effect on protein levels of complex components, ATG13, ATG101, and RB1CC1, in both reticulocytes (Fig. 2C) and MEFs (Fig. S2A), the low level of ULK1 phosphorylation prevented the association between ULK1 and RB1CC1 in reticulocytes (Fig. 2A and B), thereby disrupting the ULK1 complex.
Figure 2. Reduced ULK1 phosphorylation inhibits the formation of ULK1 and BECN1-PtdIns3K complexes. (A and B) Cell lysates prepared from WT and prkaa1−/− MEFs were immunoprecipitated (IP) with anti-ULK1 antibody, and the immunoprecipitates were probed by western blotting (IB) with the indicated antibodies. (C) The expression of RB1CC1, ATG101, and ATG13 in WT and prkaa1−/− TFRC+ and GYPA+ reticulocytes was analyzed by western blotting. (D) The expression of AMBRA1 and PtdIns3K in WT and prkaa1−/− reticulocytes was analyzed by western blotting. (E) The cell lysates from WT and prkaa1−/− MEFs were immunoprecipitated with anti-PtdIns3K antibody and the immunoprecipitates were probed by western blotting with indicated antibodies. (F) The interaction among AMBRA1, PtdIns3K, and BECN1 was assessed by immunoprecipitation and western blotting. The blot shown is representative of 3 independent repeats. *P < 0.05 vs. WT.
We further examined the effect of low ULK1 phosphorylation on the formation of BECN1-PtdIns3K complex, which is essential in vesicle nucleation during autophagy. Western blot analysis in WT and prkaa1−/− reticulocytes (Fig. 2D) and MEFs (Fig. S2B) did not show any difference in protein levels of AMBRA1 and BECN1. However, immunoprecipitation of PtdIns3K followed by probing for AMBRA1 and BECN1 (or the reverse experiment) indicated that deletion of PRKAA1 disrupted the association between PtdIns3K and AMBRA1 (Fig. 2E and F). Thus, autophagy signaling was defective in prkaa1−/− reticulocytes.
Lack of PRKAA1 leads to suppression of autophagy
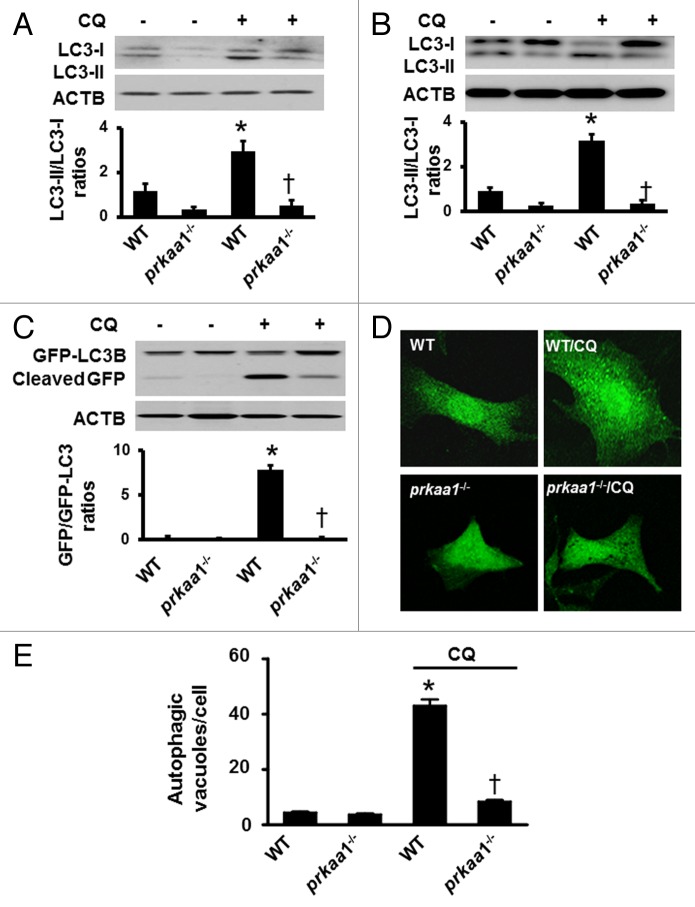
During autophagy, the cytosolic form of MAP1LC3 (microtubule-associated protein 1 light chain 3), LC3-I, a mammalian ortholog of yeast Atg8, is conjugated to phosphatidylethanolamine to form the LC3–phosphatidylethanolamine conjugate (LC3-II), which is recruited to phagophore membranes and serves as a reliable marker of autophagosome formation.46,47 Because deletion of PRKAA1 results in defects in autophagy signaling, we determined whether the deletion of PRKAA1 suppresses autophagy by analyzing the conversion of LC3-I to LC3-II in reticulocytes in the presence or absence of CQ. In the absence of CQ, the deletion of PRKAA1 reduced LC3-II protein levels (Fig. 3A). Conversely, the addition of CQ enhanced LC3-II levels in WT reticulocytes but failed to do it in prkaa1−/− reticulocytes, indicating that autophagy was inhibited in prkaa1−/− reticulocytes (Fig. 3A). The role of PRKAA1 in LC3 processing was also analyzed in prkaa1−/− MEFs. Similar to the finding in the reticulocytes, deletion of Prkaa1 impaired the conversion of LC3-I to LC3-II (Fig. 3B). Administration of CQ significantly enhanced LC3-II levels in WT MEFs but not in prkaa1−/− MEFs (Fig. 3B), confirming that PRKAA1 regulated autophagy.
Figure 3. Inhibition of PRKAA1 suppresses autophagic flux in erythrocytes. (A) WT and prkaa1−/− TFRC+ and GYPA+ reticulocytes from peripheral blood were treated with or without 5 µM CQ for 6 h, and the ratio of LC3-II/LC3-I were determined by western blotting. *P < 0.05 vs. WT; n = 4. (B) WT and prkaa1−/− MEFs were treated with or without CQ (5 µM) for 6 h and LC3-II/LC3-I was analyzed by western blotting. (C) WT and prkaa1−/− MEFs were treated with or without CQ (5 µM) for 6 h after infected with an adenovirus encoding GFP-LC3 for 24 h. GFP-LC3 and cleaved GFP were detected by using western blotting with an anti-GFP antibody. (D and E) WT and prkaa1−/− MEFs were infected with an adenovirus encoding GFP-LC3, for 24 h and then treated with or without CQ (5 µM) for 16 h. (D) Representative microphotograph of GFP-LC3 signal. (E) Autophagic vacuoles (AVs) were quantified by counting the GFP-LC3 puncta in the cells (n = 3, *P < 0.05 vs. WT, †P < 0.05 vs. WT/CQ).
We further monitored the effect of PRKAA1 on autophagic flux by conducting GFP-LC3 cleavage assay in WT and prkaa1−/− MEFs. Free GFP fragments were lower in prkaa1−/− MEFs than in WT MEFs. Treatment with CQ dramatically increased free GFP fragments in WT MEFs but not in prkaa1−/− MEFs (Fig. 3C). To confirm the effect of PRKAA1 on autophagosome formation, we performed immunofluorescence analysis in the MEFs transfected with GFP-LC3 and treated with or without CQ because the number of punctate LC3 and GFP-LC3 structures per cell is usually an accurate measure of autophagosomes.46 Although there was no significant difference in GFP-LC3 puncta between WT and prkaa1−/− MEFs in the absence of CQ, the addition of CQ significantly increased autophagosome formation in WT MEFs, whereas this effect was absent in prkaa1−/− MEFs (Fig. 3D and E). These results indicate that PRKAA1 deficiency reduces autophagosome formation.
Defects in autophagy delay mitochondrial clearance in prkaa1−/− erythrocytes
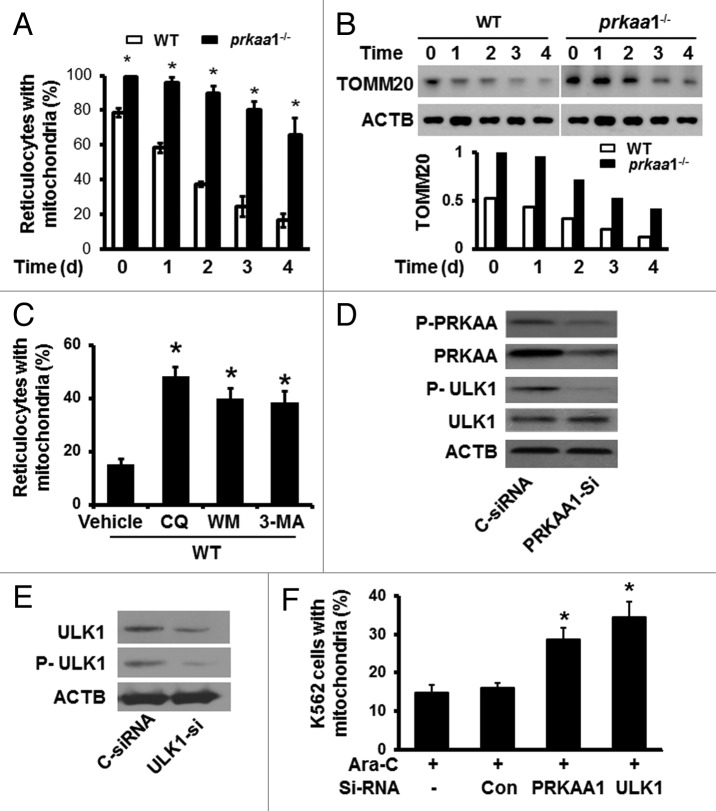
Erythrocyte maturation involves the coordinated removal of organelles.23,48 Because autophagy has been implicated in the removal of mitochondria during erythrocyte maturation,22-24 we examined whether defects in autophagy lead to mitochondrial retention during erythrocyte maturation by using flow cytometry after staining the cells with MitoTracker Deep Red and phycoerythrin-conjugated anti-GYPA (PE-anti-GYPA). As shown in Figure 4A and Figure S3, the mitochondrial content in prkaa1−/− reticulocytes was significantly higher than that in WT reticulocytes throughout the study period. In addition, the expression of mitochondrial protein, TOMM20, was also higher in prkaa1−/− than in WT reticulocytes (Fig. 4B), suggesting that mitochondrial clearance was delayed in prkaa1−/− reticulocytes. To further establish the role of autophagy in mitochondrial retention, mitochondrial content was measured in WT reticulocytes treated with autophagy inhibitors, 5 mM 3-methyladenine (3-MA), 100 nM wortmannin (WM), or 5 μM CQ. The inhibition of autophagy led to increased mitochondrial content in WT reticulocytes to a similar extent as observed after Prkaa1 deletion (Fig. 4C).
Figure 4. Defective autophagy delays mitochondrial clearance in prkaa1−/− reticulocytes. (A) Reticulocytes enriched at d 5 after phlebotomy treatment were cultured for in vitro maturation for 0, 1, 2, 3, and 4 d. The mitochondrial content in reticulocytes was determined by flow cytometry after staining the cells with MitoTracker Deep Red and phycoerythrin-conjugated anti-GYPA (PE-anti-GYPA). *P < 0.05 vs. WT. (B) The expression of mitochondrial protein, TOMM20, was detected at the indicated time points by western blotting. (C) WT reticulocytes harvested at d 5 after phlebotomy were cultured for in vitro maturation for 4 ds in the presence of 5 mM 3-MA, 100 nM WM, or 5 μM CQ. Mitochondrial content was assessed by staining the cells with MitoTracker Deep Red and phycoerythrin–anti-GYPA and flow cytometry. *P < 0.05 vs. WT vehicle (Veh). (D) K562 cells were transfected with control siRNA (C-siRNA) or PRKAA1 siRNA (PRKAA1-si) for 48 h. Cell lysates were subjected to western blotting by probing with antibodies to P-AMPK and P-ULK1. (E and F) K562 cells were first transfected with C-siRNA or PRKAA1-si, ULK1-si for 24 h and then treated with 50 nM Ara-C for 6 ds. After the treatment, the expression of ULK1 and P-ULK1 was analyzed by western blotting (E). The cells were stained with MitoTracker Deep Red and analyzed by flow cytometry to determine mitochondrial content (F). *P < 0.05 vs. C-siRNA.
We next assayed whether PRKAA1 plays a role in the regulation of mitochondrial clearance during erythroid maturation by promoting ULK1 phosphorylation. Transfection of ULK1- or PRKAA1-specific siRNA into human K562 cells significantly reduced ULK1 phosphorylation (Fig. 4D and E). After ULK1 or PRKAA1 siRNA transfection, K562 cells were induced to undergo erythrocyte maturation by 50 nM arabinofuranosylcytosine (Ara-C) for 6 ds, and mitochondrial removal during erythrocyte differentiation was analyzed by MitoTracker Deep Red staining and flow cytometry. As shown in Figure 4E and F, depletion of either PRKAA1 or ULK1 increased mitochondrial content in the cells, indicating that PRKAA1 and ULK1 are central to the regulation of mitochondrial removal, a key event in erythrocyte maturation.
Damaged mitochondria accumulate in prkaa1−/− reticulocytes and erythrocytes
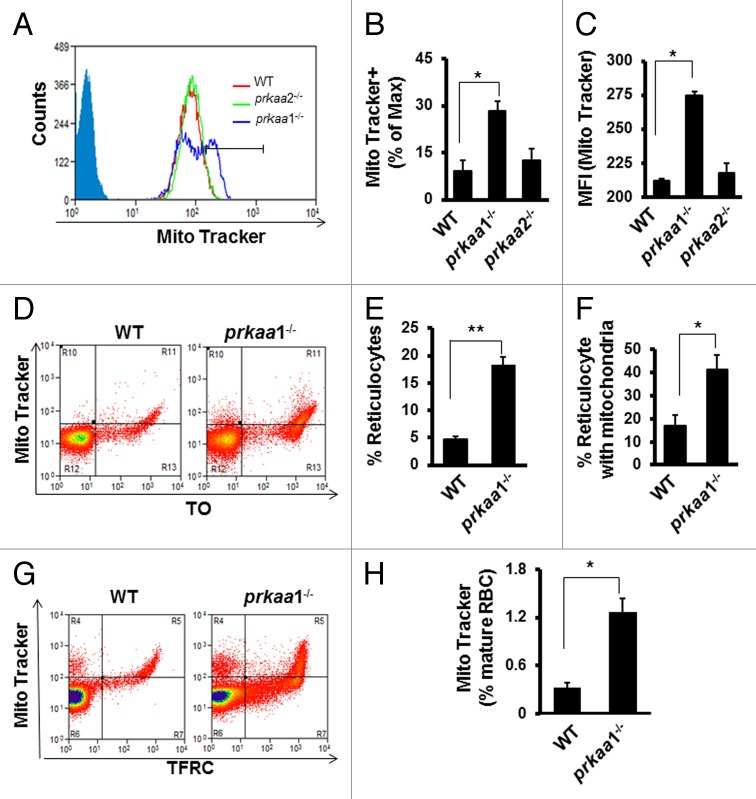
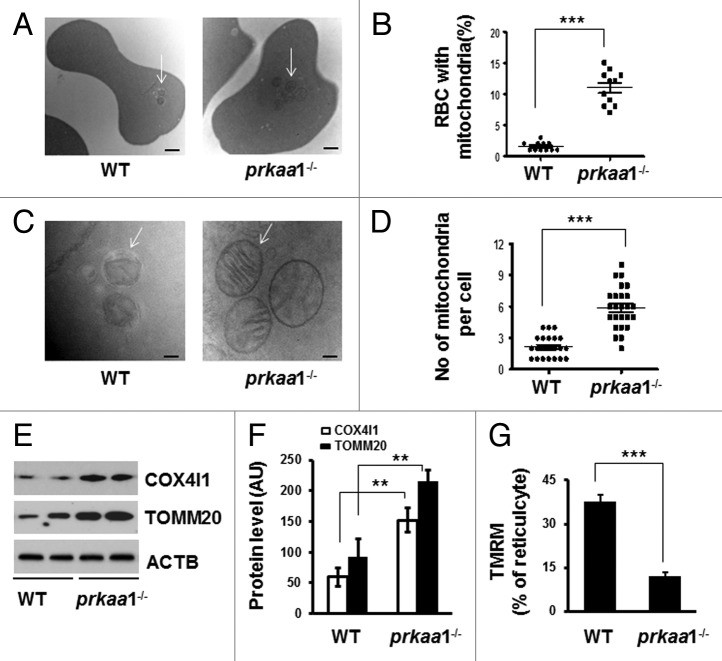
We further tested whether mitochondrial removal is altered in prkaa1−/− reticulocytes and erythrocytes in vivo using MitoTracker Deep Red as a mitochondrial probe. prkaa1−/− but not prkaa2−/− reticulocytes had a significantly higher mitochondrial content than did WT reticulocytes (Fig. 5A–C), as evidenced by a higher percentage of reticulocytes that were maximally stained by MitoTracker Deep Red (Fig. 5B) and MFI (Fig. 5C). Double staining with the RNA-specific dye thiazole orange (TO) and MitoTracker Deep Red confirmed that prkaa1−/− reticulocytes had more mitochondria than WT reticulocytes (Fig. 5D and F). Additionally, co-staining of erythrocytes with anti-TFRC (to distinguish mature and immature erythrocytes) and MitoTracker Deep Red demonstrated that prkaa1−/− mice had a significantly higher percentage of TFRC− mature erythrocytes containing mitochondria compared with WT mice (Fig. 5G and H). These data indicated that the ability of prkaa1−/− reticulocytes to remove mitochondria was insufficient. Although electron microscope analysis did not find an increase in cell volume in prkaa1−/− erythrocytes, it revealed prkaa1−/− mouse peripheral blood had more irregularly shaped erythrocytes (Fig. S4), and a significant proportion of the peripheral blood cells contained mitochondrial remnants, which was rarely observed in WT cells (Fig. 6A and B). A similar phenomenon was also found in the erythroid cells collected from bone marrow and spleen (Fig. S5). The micrographs also indicated that the prkaa1−/− erythrocytes contained more mitochondrial remnants than did WT erythrocytes (Fig. 6C and D). When mitochondrial remnants were found in WT erythrocytes, they were often present within autophagosomes. Notably, many intact mitochondria were observed in prkaa1−/− erythrocytes (Fig. 6A and C). Western blot analysis of mitochondrial proteins, TOMM20 and COX4I1, in reticulocytes indicated that the protein levels of TOMM20 and COX4I1 were higher in prkaa1−/− reticulocytes than in WT cells (Fig. 6E and F). Using TMRM, a potentiometric dye that accumulates only in intact polarized mitochondria, prkaa1−/− reticulocytes were found to contain more mitochondria with lower membrane potential compared with WT reticulocytes (Fig. 6G). Taken together, deletion of Prkaa1 results in damaged mitochondrial accumulation in reticulocytes and erythrocytes. We also found that erythrocytes from prkaa1−/− mice contained more ERs than WT erythrocytes (Fig. S6). However, the nuclear numbers in erythrocytes were not different between WT and prkaa1−/− mice (Fig. S7), indicating that Prkaa1 deletion did not affect the ability of erythrocytes to extrude the nucleus during erythrocyte maturation.
Figure 5. Analysis of mitochondrial content in erythrocytes by flow cytometry. (A–C) Mitochondrial content in TFRC+ and GYPA+ reticulocytes was determined by staining the cells with MitoTracker Deep Red and flow cytometry. (A) Representative contour plots of WT, prkaa1−/−, and prkaa2−/− reticulocytes stained with MitoTracker. The percentage of the cells maximally stained by MitoTracker Deep Red and the mean fluorescent intensity (MFI) were determined by gating on TFRC+ and GYPA+ reticulocytes. (B) Percentage of TFRC+ and GYPA+ reticulocytes that were maximally stained by MitoTracker Deep Red, *P < 0.05 vs. WT. (C) Mean fluorescent intensity (MFI) of MitoTracker Deep Red, *P < 0.05 vs. WT. (D) Peripheral blood erythrocytes were stained with MitoTracker Deep Red and TO followed by flow cytometry analysis. (E) Percentage of reticulocytes in WT and prkaa1−/− peripheral blood. (F) Percentage of reticulocytes containing mitochondria, *P < 0.05 vs. WT. (G) Representative contour plots of flow cytometry analysis of peripheral blood erythrocytes stained with MitoTracker Deep Red and TFRC. (H) Percentage of mature erythrocytes (TFRC−) containing mitochondria. *P < 0.05 vs. WT.
Figure 6. Retention of mitochondria in prkaa1−/− erythrocytes. (A) Representative electron micrographs of WT and prkaa1−/− erythrocytes (Scale bars: 500 nm). Arrows: mitochondrial remnants. (B) Erythrocytes containing remnants of mitochondria and other organelles were quantified, and the percentage of erythrocytes containing fragmented organelles was calculated. (C) Representative electron micrographs of WT and prkaa1−/− erythrocytes (Scale bars: 100 nm). In WT erythrocytes, the arrow points to an autophagosome; in prkaa1−/− erythrocytes, the arrows point to mitochondria. (D) The number of mitochondria and membranes in each cell was quantified. (E and F) Mitochondrial proteins (COX4I1 and TOMM20) in WT and prkaa1−/− TFRC+ and GYPA+ reticulocytes were analyzed by western blotting (M) and quantified by densitometry and normalized to ACTB. n = 4, *P < 0.05 vs. WT. (G) Percentage of TFRC+ and GYPA+ reticulocytes that were stained by TMRM, ***P < 0.001 vs. WT.
Delayed mitochondrial clearance increases oxidative stress and erythrocyte damage
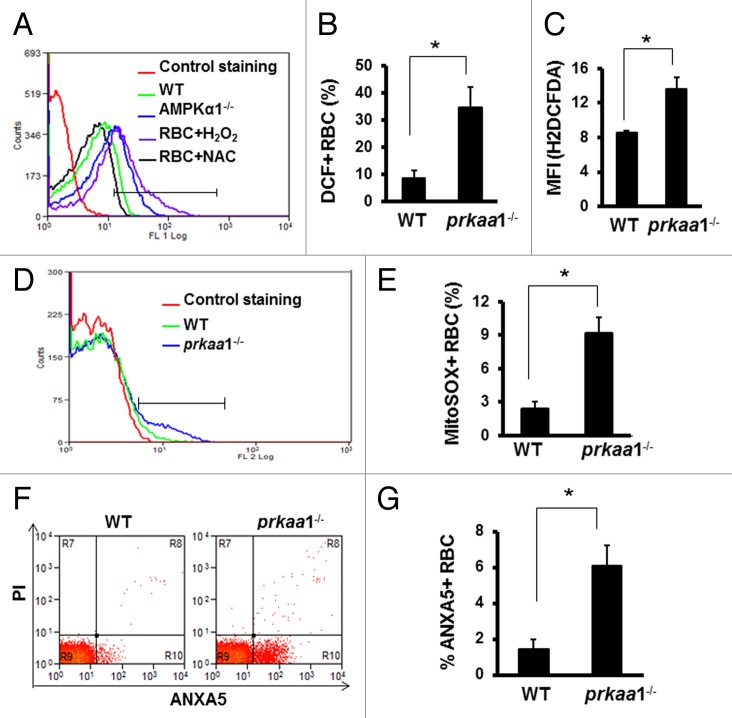
We previously have reported that prkaa1−/− mice manifest anemia with increased reticulocyte numbers, a shortened erythrocyte life span, and increased ROS production.43,44 In addition to producing energy, mitochondria are a major source of ROS. Accumulation of depolarized mitochondria has been associated with oxidative damage, we therefore tested whether retention of damaged mitochondria in erythrocytes results in oxidative stress in the cells. We used 2 methods to measure ROS production. First, erythrocytes were stained with H2DCFDA and analyzed by flow cytometry. In basal conditions, the number of erythrocytes generating ROS was significantly increased in prkaa1−/− mice compared with the findings in WT mice (Fig. 7A–C). We next measured mitochondrial superoxide anion production by MitoSOX staining and found that superoxide production was significantly increased in the erythrocytes of prkaa1−/− mice (Fig. 7D and E).
Figure 7. Deletion of prkaa1 enhances intracellular ROS levels and cell damage. (A to C) Erythrocyte intracellular ROS levels were determined by flow cytometry using H2DCFDA as a probe. (A) Representative contour plots of WT and prkaa1−/− erythrocytes stained with H2DCFDA. (B) Percentage of erythrocytes generating ROS. (C) MFI of H2DCFDA. (D and E) Erythrocyte intracellular superoxide was stained with MitoSOX and detected by flow cytometry. The superoxide levels was expressed as the percentage of erythrocytes containing MitoSOX (n = 5, *P < 0.05 vs. WT). (F) Representative diagram of ANXA5-PI staining. (G) Percentage of ANXA5+ erythrocytes (n = 5, *P < 0.05 vs. WT).
Next, we examined whether or not enhanced oxidative stress promotes erythrocyte destruction. Consistent with our previous finding,43,44 prkaa1−/− erythrocytes are more resistant to hypotonic lysis than WT erythrocytes (Fig. S8), indicating a reduction in cell surface to volume ratio, which may potentiate erythrocyte destruction in an unfavorable environment. In line with the fact that oxidative stress induces cell damage, prkaa1−/− mice had more ANXA5+/annexin V+ erythrocytes than did WT mice (Fig. 7F and G). Together with our previous finding that prkaa1−/− erythrocytes are less deformable in response to shear stress than control erythrocytes,43 our results suggest that prkaa1−/− erythrocytes are more susceptible to damage.
Chronic administration of the antioxidant Mito-tempol ameliorates anemia in prkaa1−/− mice
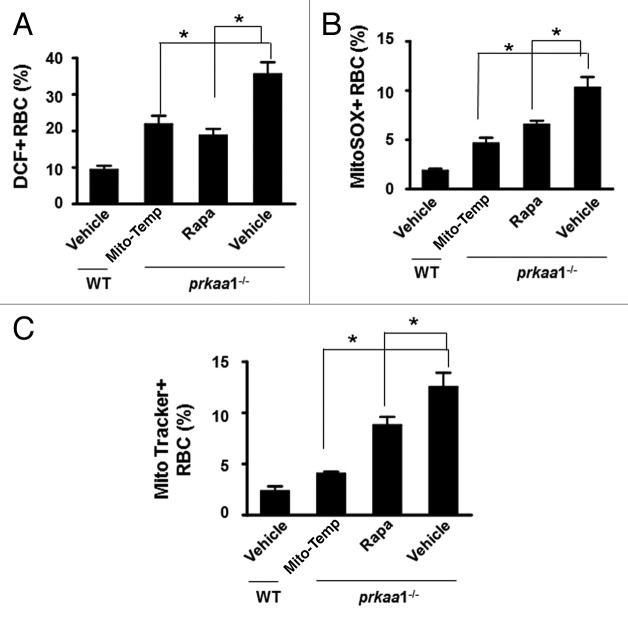
Because prkaa1−/− erythrocytes exhibited higher levels of ROS and superoxide, we tested whether administration of Mito-tempol, a mitochondria-targeted antioxidant, could improve erythrocyte survival and ameliorate anemia. As depicted in Figure 8, the chronic administration of Mito-tempol in prkaa1−/− mice decreased ROS and superoxide levels (Fig. 8A and B), reduced mitochondrial accumulation (Fig. 8C), and recovered erythrocyte numbers, hemoglobin levels, and percentage of reticulocytes compared with the findings in vehicle-treated prkaa1−/− mice (Table 1), suggesting that Prkaa1 deletion induces anemia through enhancing mitochondria-mediated oxidative stress.
Figure 8. Rapamycin and Mito-tempol attenuate oxidative stress and anemia in prkaa1−/− mice. (A) Intracellular ROS levels in erythrocytes were determined as described in Materials and Methods, and the results are presented as percentages of erythrocytes containing H2DCFDA. (B) Intracellular superoxide content was determined by staining erythrocytes with MitoSOX and analyzed by flow cytometry. The results were expressed as percentages of erythrocytes containing MitoSOX. (C) Mitochondrial content in erythrocytes was assessed by MitoTracker Deep Red staining, and the results are presented as the percentage of MitoTracker Deep Red+ erythrocytes (n = 5, *P < 0.05 vs. prkaa1−/− vehicle); NS, not significant; Rapa, rapamycin; Mito-temp, Mito-tempol.
Table 1. Hematological parameters of the peripheral blood from mice treated with Mito-tempol or rapamycin.
| WT | prkaa1−/− | |||
|---|---|---|---|---|
| Vehicle | Rapa | Mito-tempol | ||
| RBC (M/µl) | 8.8 ± 0.7 | 6.1 ± 0.6 | 7.4 ± 0.9* | 8.1 ± 0.6* |
| Hb (g/dl) | 13.8 ± 1.0 | 9.1 ± 0.5 | 11.0 ± 1.4* | 12.6 ± 0.7* |
| Reti (%) | 4.5 ± 0.5 | 18.0 ± 1.5 | 14.5 ± 2.3 | 7.0 ± 2.5* |
*P < 0.05 vs. prkaa1−/− /vehicle; Rapa, rapamycin; Reti, reticulocyte; Hb, hemoglobin.
Chronic administration of rapamycin ameliorates anemia in prkaa1−/− mice
To understand the role of autophagy in Prka deletion-induced anemia, we assessed the impact of rapamycin, an autophagy inducer, on the Prkaa1-knockout phenotype. Compared with control prkaa1−/− mice, chronic administration of rapamycin partially recovered erythrocyte numbers and hemoglobin levels (Table 1). At the same time, rapamycin treatment attenuated oxidative stress in these mice, as estimated by the reduction in mitochondrial content (Fig. 8C) and the decreases in intracellular levels of ROS and superoxide anions (Fig. 8A and B).
Transplantation of WT bone marrow completely restores the erythroid phenotype in prkaa1−/− mice
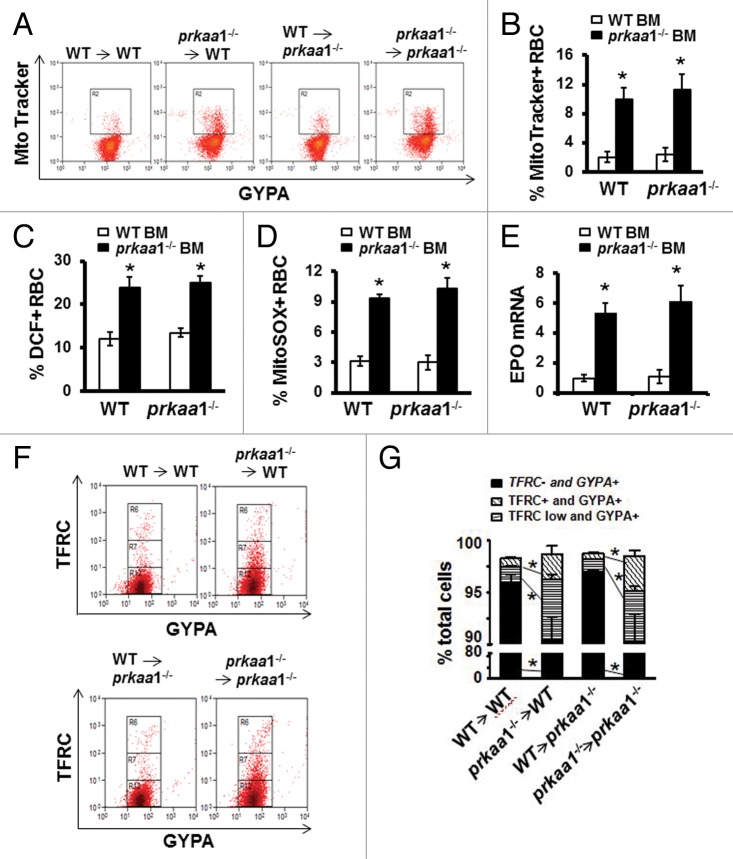
The aforementioned observations prompted us to perform bone marrow transplantation to examine the impact of PRKAA1 deficiency on erythrocyte terminal differentiation and maturation in vivo. Compared with the WT mice that received WT bone marrow cells, the WT mice transplanted with prkaa1−/− bone marrow exhibited significantly lower erythrocyte counts and hemoglobin concentrations and higher reticulocyte counts (Table 2). Transplantation also dramatically elevated the mitochondrial content (Fig. 9A and B), enhanced ROS and superoxide production (Fig. 9C and D), and increased immature erythrocytes (TFRC+GYPA+ and TFRClow GYPA+) (Fig. 9F and G) in peripheral blood. Furthermore, erythrocytes from WT mice transplanted with prkaa1−/− bone marrow cells displayed a comparable magnitude and spectrum of osmotic resistance (Fig. S8), as we previously reported in prkaa1−/− erythrocytes.43,44 Hence, the hematologic phenotype of prkaa1−/− mice was recapitulated by bone marrow transplantation, indicating that PRKAA1 plays an intrinsic role in erythrocyte homeostasis.
Table 2. Hematological parameters of peripheral blood from BMT mice.
| Recipient | WT | prkaa1−/− | ||
|---|---|---|---|---|
| Donor | WT BM | prkaa1−/− BM | WT BM | prkaa1−/− BM |
| RBC (M/µl) | 8.9 ± 0.6 | 7.4 ± 0.1* | 8.9 ± 0.3 | 6.9 ± 0.2† |
| Hb (g/dl) | 12.8 ± 0.7 | 9.9 ± 0.5* | 13.0 ± 0.6 | 8.8 ± 0.2† |
| Reti (%) | 4.5 ± 0.2 | 14.2 ± 0.6* | 4.5 ± 0.4 | 19.8 ± 0.6† |
*P < 0.05 vs. WT BM/WT; †P < 0.05 vs. WT BM/ prkaa1−/−; Reti, reticulocyte; Hb, hemoglobin.
Figure 9. Stem cells from WT bone marrow completely restore the hematologic phenotype of prkaa1−/− mice. Eight-wk-old mice were used to perform BMT experiment. Twelve wk after bone marrow cell transplantation, peripheral blood was analyzed. (A) Erythrocytes were stained with MitoTracker Deep Red and phycoerythrin–anti-GYPA and analyzed by flow cytometry. (B) Mitochondrial content is expressed as the percentage of erythrocytes containing MitoTracker Deep Red. (C) Erythrocyte intracellular ROS levels were determined by flow cytometry using H2DCFDA as a probe. (D) Erythrocyte intracellular superoxide content was evaluated using MitoSOX staining and flow cytometry as described in Materials and Methods. (E) Total mRNA was extracted from the kidneys, and Epo mRNA levels were quantified by real-time PCR. (F and G) Peripheral blood erythroid cell differentiation. Distribution of erythroid developmental stages was analyzed by flow cytometry using the surface marker TFRC/CD71 (transferrin receptor) and GYPA/Ter119 (glycophorin A [MNS blood group]).
To determine whether deletion of Prkaa1 alters the hematopoietic microenvironment for erythropoiesis and erythrocyte survival, we transplanted WT hematopoietic cells into prkaa1−/− recipient mice and observed erythrocyte maturation in these mice. As depicted in Table 2, the transplantation of WT hematopoietic cells into prkaa1−/− recipient mice completely normalized blood parameters including erythrocyte counts and hemoglobin levels (Table 2). Transplantation also rehabilitated mitochondrial clearance (Fig. 9A and B), inhibited ROS, and superoxide production (Fig. 9C and D), and normalized erythrocyte maturity (Fig. 9F and G) in prkaa1−/− recipient mice. In addition, the transplantation of WT hematopoietic cells reduced erythropoietin (Epo) mRNA expression in prkaa1−/− recipient mice (Fig. 9E).
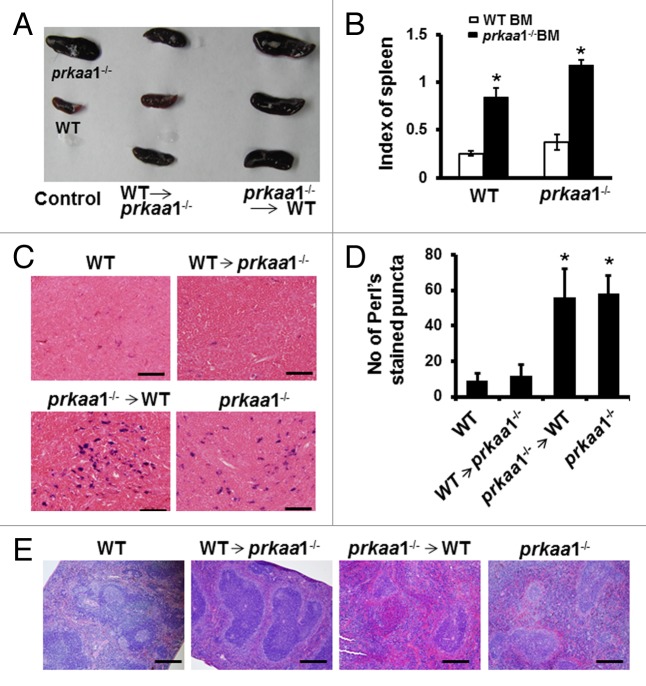
Consistent with previous reports42-44 marked splenomegaly was observed in both WT and prkaa1−/− mice transplanted with prkaa1−/− bone marrow cells (Fig. 10A and B). When prkaa1−/− mice were transplanted with WT bone marrow cells, their spleen size was restored to a size comparable to that of WT mice (Fig. 10A and B). Histologic analysis revealed that the red pulp was markedly expanded (Fig. 10E) and iron was accumulated in the spleens (Fig. 10C and D) of prkaa1−/− and WT mice transplanted with prkaa1−/− bone marrow cells compared with the findings in mice transplanted with WT bone marrow cells. Taken together, these results indicate that the anemia observed in prkaa1−/− mice is due to the defective mitophagy, which delays mitochondrial clearance during erythrocyte terminal differentiation, induces oxidative stress, and enhances hemolytic destruction of erythrocytes.
Figure 10. Stem cells from WT bone marrow ameliorate the splenomegaly of prkaa1−/− mice. (A) Representative images of spleens from bone marrow-transplanted mice. (B) Comparison of the spleen index in different transplantation groups. (C) Iron content in spleen sections was assessed using Perls iron stain. Scale bars: 50 µm. (D) Quantification of Perls stained puncta. n = 5–6; *P < 0.05 vs. mice transplanted with WT bone marrow. (E) The spleens collected from bone marrow-transplanted mice were analyzed by hematoxylin and eosin staining. Scale bars: 200 µm.
Discussion
In this study, we have demonstrated that erythroid cells predominantly express the PRKAA1 isoform, and genetic deletion of Prkaa1 impairs ULK1 phosphorylation, reduces the formation of ULK1 and BECN1-PtdIns3K complexes, and subsequently suppresses autophagy-dependent mitochondrial clearance during erythrocyte maturation. The retention of damaged mitochondria exacerbated mitochondria-mediated oxidative stress that results in the hemolytic destruction of erythrocytes, a shortened erythrocyte life span, splenomegaly, and anemia. All of these detrimental effects induced by the deletion of Prkaa1 were abolished by transplantation of normal hematopoietic stem cells into prkaa1−/− mice. Administration of either rapamycin to activate autophagy or Mito-tempol to eliminate ROS ameliorates the impairments observed in prkaa1−/− mice. Our findings suggest that protecting the ability of erythrocytes to remove damaged mitochondria via autophagy is an important mechanism for the PRKAA1-mediated regulation of the erythrocyte life span.
The most important finding of this study is that PRKAA1 plays a major role in erythrocyte homeostasis through regulating autophagy-dependent mitochondrial clearance during erythrocyte terminal differentiation. prkaa1−/− mice exhibit anemia with splenomegaly and increased hemolytic destruction of erythrocytes.42-44 However, the underlying mechanism remains elusive. The present study provides direct experimental evidence to support the notion that the anemia observed in prkaa1−/− mice is the result of impaired autophagy-dependent mitochondrial clearance and accumulation of damaged mitochondria, which leads to oxidative stress and promotes erythrocyte destruction.
1) Mitochondrial clearance by autophagy is impaired in prkaa1−/− erythrocytes. In addition to regulating energy metabolism, AMPK also modulates autophagy under many physiologic and pathologic conditions. Recently, several studies demonstrated that AMPK directly phosphorylates ULK1 in the mammalian liver and MEFs during energy stress, and the loss of either AMPK or ULK1 leads to defects in mitophagy.38,49 These studies suggest that AMPK regulates ULK1 activity through a concise mechanism, ensuring that ULK1 is activated only under appropriate conditions. In the current study, we observed a dramatic decrease in ULK1 phosphorylation and suppression of autophagy in prkaa1−/− erythrocytes, which were associated with a shortened erythrocyte life span and anemia. Chronic administration of rapamycin stimulates autophagy, prevents mitochondrial accumulation in erythrocytes, and ameliorates anemia in prkaa1−/− mice, suggesting a connection between defective autophagy and the development of anemia in prkaa1−/− mice. In agreement with this hypothesis, the phenotype of prkaa1−/− mice is similar to those of ulk1−/−,24 atg7−/−,11,22 and bnip3l/nix−/− mice.23,50,51 Although deletion of Prkaa1 does not affect the protein levels of ATG5, ATG6, and ATG7, the lack of PRKAA1 does reduce ULK1 phosphorylation at Ser555, which inhibits the formation of a kinase complex essential for the initiation of autophagy. Although prkaa1−/− mice had more severe anemia than did ulk1−/− mice, prkaa1−/− mice exhibit a mild defect in mitochondrial clearance (12% of erythrocytes containing mitochondria in total blood), which is less severe than that caused by deficiency of ULK1 (35%).10,24 The discrepancy between the severity of anemia and the defect in mitochondrial clearance suggests that PRKAA1 deficiency has an additional effect on erythroid development besides impairment of mitochondrial clearance.
In addition to regulating BECN1-PtdIns3K complex formation, AMPK also coordinates with MTORC1 to regulate the formation and activation of ULK1 complex. Under the conditions that autophagy is induced, MTORC1 dissociates from the complex allowing AMPK to bind and phosphorylate ULK1, suggesting that the physical association of AMPK and ULK1 is important in regulating the formation of ULK1 complex. In the in vivo experiment, inhibition of the MTORC1 signaling by rapamycin in prkaa1−/− mice only partially prevented the damage induced by deletion of Prkaa1, suggesting that in the absence of AMPK, inhibition of MTORC1 could not completely restore autophagic capacity. Taken together, defective autophagy may be an important mechanism responsible for the development of anemia in prkaa1−/− mice.
2) ROS levels are significantly increased in prkaa1−/− erythrocytes and administration of Mito-tempol recovers erythrocyte numbers, hemoglobin levels, and reticulocyte count in prkaa1−/− mice. ROS are primarily generated by mitochondria as a byproduct of the electron transport chain. Deletion of Prkaa1 impairs autophagy-dependent mitochondrial clearance, leading to accumulation of depolarized mitochondria and increased ROS production in erythrocytes. Excessive ROS not only induce the nonspecific posttranslational modification of proteins but also cause mitochondrial dysfunction/damage, as mitochondria are both the producers and targets of ROS.52 In addition, depolarization of mitochondria causes mitochondria to produce more ROS and release apoptosis-related factors such as cytochrome c into the cytosol, forming a vicious circle and exaggerating the damage.53 Thus, the impaired ability of erythrocytes to remove dysfunctional mitochondria may damage the cytoplasmic membrane and associated cytoskeleton, which decreases erythrocyte deformability, leading to the sequestration of erythrocytes in the spleen.
3) The lack of PRKAA1 did not alter the microenvironment for erythropoiesis and erythrocyte survival. There are many factors involved in erythrocyte destruction; the defect may occur within the erythrocyte itself (intrinsic factor) or outside the cell (extrinsic factor, also called the microenvironment). In the present study, transplantation of WT bone marrow into prkaa1−/− mice resulted in mitochondrial removal, reduced intracellular ROS levels, and normalized hematologic parameters and spleen size. In addition, transplantation of prkaa1−/− bone marrow into WT recipients could recapitulate the phenotype of prkaa1−/− mice. These results suggest that the anemia induced by Prkaa1 deletion is due to impaired autophagy-dependent mitochondrial clearance in erythrocytes, which worsens oxidative stress and promotes erythrocyte destruction, rather than alteration of the microenvironment of erythrocytes.
The enlargement of the spleen observed in prkaa1−/− mice may be a compensatory response to the hemolytic destruction of erythrocytes. In these mice excessive oxidative stress causes oxidation of membrane proteins, which may change the membrane structure and impair the deformability of erythrocytes.43,44 The damaged erythrocytes are vulnerable to sequestration in the spleen,43,44 leading to marked increases in iron deposition in the spleen. In addition, prkaa1−/− mice exhibited vigorous splenic hematopoiesis, as evidenced by expanded red pulp, increased reticulocyte numbers, and elevated plasma levels of EPO.
In conclusion, we have demonstrated that PRKAA1 plays a critical role in the regulation of autophagy-dependent mitochondrial clearance during erythrocyte differentiation, and defective autophagic clearance of damaged mitochondria contributes to the development of anemia and splenomegaly. Our findings provide new insights into the pathogenesis of hematologic diseases involving defective erythrocyte maturation such as anemia and myelodysplastic syndrome. These findings also suggest that AMPK activation may present a new approach to treat erythrocyte disorders.
Materials and Methods
Mice
All procedures were reviewed and approved by the Institutional Animal Care and Use Committee at the University of Oklahoma Health Sciences Center and at the University Paris Descartes. prkaa1−/− mice backcrossed to the C57BL/6 background for 5 generations were used for these experiments.43 To determine the effects of autophagy on oxidative stress during the development of anemia, prkaa1−/− mice and their littermates (wild-type, WT) were treated with 200 µg/kg/d/ Mito-tempol (Santa Cruz Biotechonoloigy, sc-221945) through Mini Osmotic Pump (Model 2006, DURECT Co., 0007223) for 6 wk. In separate groups, mice were treated with rapamycin (LC Laboratories, R-5000) at dose of 3.0 mg/kg/d or 10% DMSO as vehicle control through intraperitoneal injections for 10 wk.
Peripheral blood analysis and reticulocyte cultures
Peripheral blood samples were harvested in EDTA-coated microtubes (Aktiengesellschaft & Co., 20.1288.100) by retro-orbital sinus bleeding and analyzed by a HEMAVET 950 Veterinary Hematology Analyzer (Drew Scientific Inc., Oxford, Connecticut) using a mouse species program. Reticulocytosis in the mice were induced by daily retro-orbital bleeding (0.35 mL/d) for 4 d. An equal volume of sterile saline was injected intraperitoneally to replace the lost blood. On the fifth d, whole blood were harvested to sort TFRC+GYPA+ cells, refered to as reticulocytes, and cultured for 1 to 4 d in Iscove Modified Dulbecco Media (ATCC, 300-2005) supplemented with 30% fetal bovine serum (Sigma, F2442), 1% deionized bovine serum albumin (Sigma, 05470), 10 U/mL insulin (Sigma, I3536), and transferrin (StemCell Technologies, 36150), 0.1mM monothioglycerol (Sigma, M6145), 100 U/mL penicillin, 100 µg/mL streptomycin, 2 mM L-glutamine, and 0.5 mM adenine hemisulfate.
Bone marrow transplantation
WT and prkaa1−/− mice were used for these experiments. Chimera were generated by irradiating recipient mice with 2 doses of 550 cGy and immediately reconstituting them with 5 × 10⁶ donor bone marrow cells isolated from the femurs and tibias of WT or prkaa1−/− mice. The hematologic parameters of recipient mice were analyzed 12 wk after bone marrow transplantation.
Immunoprecipitation and western blot analysis
Protein extracts were prepared by lysing cells in radioimmunoprecipitation assay buffer [150 mM NaCl, 1.0% Nonidet P-40 (Sigma, I8896), 0.5% sodium deoxycholate (Sigma, 30970), 0.1% sodium dodecyl sulfate (Sigma, L3771), 1 mM EDTA, and 50 mM TRIS-HCl, pH 8.0] supplemented with complete EDTA-free protease inhibitor cocktail tablets (Roche Applied Science, 05892953001) and phosphatase inhibitor cocktails (Sigma-Aldrich, P0044-5ML). Cleared lysates were separated on 10% Tris-glycine or 4–12% Bis-Tris gels (Invitrogen, EC6028BOX) followed by transfer onto polyvinylidene difluoride or nitrocellulose membranes. After blocking in 5% skim milk, blots were probed using the following primary antibodies (1:1000 dilution): anti-mouse ATG5, ATG7, BECN1, PRKAA1, PRKAA2, phospho-PRKAA (Thr172), and phospho-ULK1 (Ser555), RB1CC1/FIP200, AMBRA1, PIK3C3 (phosphatidylinositol 3-kinase, catalytic subunit type 3; the catalytic subunit of PtdIns3K), ATG101, ATG13, and LC3B, all of which were purchased from Cell Signaling Technology (catalog numbers were 8540S, 2631S, 3495S, 2795S, 2757S, 2535, 5869, 12346,12250, 4263, 8764, 6940, and 3868 respectively); and anti-mouse ULK1, and anti-GFP (Sigma, A7481, and G1544). For immunoprecipitation assay, 500 μg of protein cleared lysates were immunoprecipitated with specific antibodies (1:200 dilution) overnight at 4 °C, the immunoprecipitates were subjected to western blot. Control, PRKAA1, and ULK1 siRNA were purchased from Santa Cruz Biotechnology (SC-37007, SC-29673, SC-44182).
Flow cytometry
For erythroid developmental stages, erythroid cells from the peripheral blood, bone marrow, or spleens of WT and prkaa1−/− mice were stained with FITC–anti-TFRC and phycoerythrin–anti-GYPA (BD Biosciences, 553266, 553673). Phosphatidylserine display was measured by staining with FITC–ANXA5/Annexin V (BD Biosciences, 556419). To stain mitochondria, WT, prkaa1−/−, and prkaa2−/− erythrocytes were labeled with 100 nM MitoTracker Deep Red (Molecular Probes, M22426) at 37 °C for 30 min. To analyze mitochondrial depolarization, reticulocytes were stained with 100 nM tetramethylrhodamine methylester (TMRM; Invitrogen, T668) at 37 °C for 15 min. Measurement of intracellular ROS levels in erythrocytes was performed essentially according to the manufacturer’s instruction. Briefly, erythrocytes were washed and resuspended in staining buffer (BD Bioscience, 554657) and loaded with 5-(and-6)-chloromethyl-2′,7′-dichlorodihydrofluorescein diacetate, acetyl ester (H2DCFDA, Molecular Probes, C6827) in the dark for 30 min at 37 °C in a 5% CO2 atmosphere. Intracellular fluorescent products were measured immediately by flow cytometry. To detect intracellular superoxide, erythrocytes were incubated with 5 μM MitoSOX Red (Molecular Probes, M36008) at 37 °C in a 5% CO2 atmosphere and directly analyzed by flow cytometry without fixing.
Visualization of autophagic vacuoles
MEFs from WT and prkaa1−/− mice were plated at 5 × 10⁴ cells per well and allowed to adhere to the plate overnight. Cells were infected with adenovirus encoding GFP-LC3B. After 24 h of infection, the cells were incubated with 5 μM of chloroquine (CQ) for 16 h. Fluorescence images were obtained using a confocal microscope (Leica SP2 MP Confocal Heidelberg GmbH, Germany). Autophagy was measured by quantifying the average number of autophagic vacuoles per cell for each sample. A minimum of 100 cells per sample was counted.
Assays of autophagic flux
MEFs (5 × 10⁴) and TFRC+ GYPA+ reticulocytes from peripheral blood (1 × 10⁶) were seeded in 6-well plates and grown overnight. The cells were then treated with 5 μM of CQ for 6 h. Cell lysates were prepared and subjected to western blot to determine the ratio of LC3-II/LC3-I. To detect the dynamic turnover of GFP-LC3B in lysosome, GFP-LC3 cleavage assay was performed. Briefly, WT and prkaa1−/− MEFs were first infected with adenovirus GFP-LC3 for 24 h, then the cells were treated with or without CQ (5 μM). Total lysates were prepared and subjected to western blot analysis. The appearance of free GFP on western blot can be used to monitor degradation of the inner autophagosome membrane. The reduced amount of free GFP fragments indicates the reduction in autophagic flux.
Electron microscopy
Samples were fixed by addition of 2.5% gluteraldehyde in 0.1 mol/L phosphate buffer, pH 7.4, and left for 24 h at 4 °C. Samples were postfixed with 1% osmium tetroxide, dehydrated with 100% ethanol, and embedded in epoxy resin (Sigma, 45359-1EA-F). Finally, ultrathin slices (70- to 100-nm thick) were cut from the resin blocks with a Reichert Ultracut E ultramicrotome (Leica Microsystems Inc. Buffalo Grove, USA), stained with lead citrate and uranyl acetate. Sections were examined with a JEOL 1010 electron microscope (JEOL USA, Inc. Peabody, MA) fitted with a Hamamatsu digital camera system (Hamamatsu Photonics, Hamamatsu City, Japan).
Perls Prussian Blue Staining
Spleen sections were deparaffinized and rehydrated. Slides were incubated in Perls Staining Solution (comprising equal parts of 2% potassium ferrocyanide and 2% hydrochloric acid), counterstained with filtered neutral red (Sigma, N4638), dehydrated, cleared, and mounted. Images were taken using a Retiga 1300 Color-Cooled Camera (Qimaging, Burnaby BC, Canada) and Q capture software and Perls stained puncta were quantified using a Bioquant analysis system (Nashville, TN).
Statistics
The data were presented as means ± standard errors of the mean. Two-group comparisons were performed using the Student t test. Multiple group comparisons were performed using one-way analysis of variance and the Fisher least significant difference. P values of less than 0.05 were considered statistically significant.
Supplementary Material
Disclosure of Potential Conflicts of Interest
No potential conflicts of interest were disclosed.
Acknowledgments
This study was supported by grants (HL079584, HL080499, HL074399, HL089920, HL096032, HL105157, and HL110488) from the National Institutes of Health, a research award from the American Diabetes Association, and funds from the Warren Chair of the University of Oklahoma Health Sciences Center (all to Dr Zou). Dr Zou is a recipient of the National Established Investigator Award of the American Heart Association. The authors report no conflicts of interest.
Glossary
Abbreviations:
- ACTB
actin, beta
- AICAR
5-aminoimidazole-4-carboxamide-1-β-D-ribofuranoside
- AMBRA1
autophagy/Beclin 1 regulator 1
- AMPK
adenosine monophosphate-activated protein kinase
- ATG
autophagy-related
- BECN1
Beclin 1, autophagy-related (mammalian ortholog of yeast Vps30/Atg6)
- CQ
chloroquine
- COX4I1
cytochrome c oxidase subunit IV isoform 1
- EPO
erythropoietin
- GYPA
glycophorin A (MNS blood group)
- H2DCFDA
2′,7′-dichlorodihydrofluorescein diacetate
- MAP1LC3/LC3
microtubule-associated protein 1 light chain 3 (a mammalian ortholog of yeast Atg8)
- MEF
mouse embryonic fibroblast
- PRKAA1
protein kinase, AMP-activated, alpha1 catalytic subunit
- PRKAA2
protein kinase, AMP-activated, alpha 2 catalytic subunit
- RB1CC1/FIP200
RB1-inducible coiled-coil 1/focal adhesion kinase family interacting protein of 200 kDa
- PtdIns3K
class III phosphatidylinositol 3-kinase
- ROS
reactive oxygen species
- TFRC/CD71
transferrin receptor
- TOMM20
translocase of outer mitochondrial membrane 20 homolog (yeast)
- WT
wild-type
- ULK1
unc-51 like autophagy activating kinase 1
References
- 1.Chasis JA, Mohandas N. Erythroblastic islands: niches for erythropoiesis. Blood. 2008;112:470–8. doi: 10.1182/blood-2008-03-077883. [DOI] [PMC free article] [PubMed] [Google Scholar]
- 2.Hoffbrand AV, Moss PAH, Pettit JE. Essential haematology (ed 5th). Malden, Mass.; Oxford: Blackwell Pub.; 2006. [Google Scholar]
- 3.Socolovsky M, Nam H, Fleming MD, Haase VH, Brugnara C, Lodish HF. Ineffective erythropoiesis in Stat5a(-/-)5b(-/-) mice due to decreased survival of early erythroblasts. Blood. 2001;98:3261–73. doi: 10.1182/blood.V98.12.3261. [DOI] [PubMed] [Google Scholar]
- 4.Koury MJ, Koury ST, Kopsombut P, Bondurant MC. In vitro maturation of nascent reticulocytes to erythrocytes. Blood. 2005;105:2168–74. doi: 10.1182/blood-2004-02-0616. [DOI] [PubMed] [Google Scholar]
- 5.Gronowicz G, Swift H, Steck TL. Maturation of the reticulocyte in vitro. J Cell Sci. 1984;71:177–97. doi: 10.1242/jcs.71.1.177. [DOI] [PubMed] [Google Scholar]
- 6.Heynen MJ, Tricot G, Verwilghen RL. Autophagy of mitochondria in rat bone marrow erythroid cells. Relation to nuclear extrusion. Cell Tissue Res. 1985;239:235–9. doi: 10.1007/BF00214924. [DOI] [PubMed] [Google Scholar]
- 7.Takano-Ohmuro H, Mukaida M, Kominami E, Morioka K. Autophagy in embryonic erythroid cells: its role in maturation. Eur J Cell Biol. 2000;79:759–64. doi: 10.1078/0171-9335-00096. [DOI] [PubMed] [Google Scholar]
- 8.Géminard C, de Gassart A, Vidal M. Reticulocyte maturation: mitoptosis and exosome release. Biocell. 2002;26:205–15. [PubMed] [Google Scholar]
- 9.Kim I, Rodriguez-Enriquez S, Lemasters JJ. Selective degradation of mitochondria by mitophagy. Arch Biochem Biophys. 2007;462:245–53. doi: 10.1016/j.abb.2007.03.034. [DOI] [PMC free article] [PubMed] [Google Scholar]
- 10.Mortensen M, Ferguson DJ, Simon AK. Mitochondrial clearance by autophagy in developing erythrocytes: clearly important, but just how much so? Cell Cycle. 2010;9:1901–6. doi: 10.4161/cc.9.10.11603. [DOI] [PubMed] [Google Scholar]
- 11.Zhang J, Randall MS, Loyd MR, Dorsey FC, Kundu M, Cleveland JL, Ney PA. Mitochondrial clearance is regulated by Atg7-dependent and -independent mechanisms during reticulocyte maturation. Blood. 2009;114:157–64. doi: 10.1182/blood-2008-04-151639. [DOI] [PMC free article] [PubMed] [Google Scholar]
- 12.Nakatogawa H, Suzuki K, Kamada Y, Ohsumi Y. Dynamics and diversity in autophagy mechanisms: lessons from yeast. Nat Rev Mol Cell Biol. 2009;10:458–67. doi: 10.1038/nrm2708. [DOI] [PubMed] [Google Scholar]
- 13.Yang Z, Klionsky DJ. Eaten alive: a history of macroautophagy. Nat Cell Biol. 2010;12:814–22. doi: 10.1038/ncb0910-814. [DOI] [PMC free article] [PubMed] [Google Scholar]
- 14.Levine B, Klionsky DJ. Development by self-digestion: molecular mechanisms and biological functions of autophagy. Dev Cell. 2004;6:463–77. doi: 10.1016/S1534-5807(04)00099-1. [DOI] [PubMed] [Google Scholar]
- 15.Levine B. Cell biology: autophagy and cancer. Nature. 2007;446:745–7. doi: 10.1038/446745a. [DOI] [PubMed] [Google Scholar]
- 16.Levine B, Kroemer G. Autophagy in the pathogenesis of disease. Cell. 2008;132:27–42. doi: 10.1016/j.cell.2007.12.018. [DOI] [PMC free article] [PubMed] [Google Scholar]
- 17.Mizushima N, Levine B. Autophagy in mammalian development and differentiation. Nat Cell Biol. 2010;12:823–30. doi: 10.1038/ncb0910-823. [DOI] [PMC free article] [PubMed] [Google Scholar]
- 18.Youle RJ, Narendra DP. Mechanisms of mitophagy. Nat Rev Mol Cell Biol. 2011;12:9–14. doi: 10.1038/nrm3028. [DOI] [PMC free article] [PubMed] [Google Scholar]
- 19.Okamoto K, Kondo-Okamoto N, Ohsumi Y. Mitochondria-anchored receptor Atg32 mediates degradation of mitochondria via selective autophagy. Dev Cell. 2009;17:87–97. doi: 10.1016/j.devcel.2009.06.013. [DOI] [PubMed] [Google Scholar]
- 20.Vives-Bauza C, Zhou C, Huang Y, Cui M, de Vries RL, Kim J, May J, Tocilescu MA, Liu W, Ko HS, et al. PINK1-dependent recruitment of Parkin to mitochondria in mitophagy. Proc Natl Acad Sci U S A. 2010;107:378–83. doi: 10.1073/pnas.0911187107. [DOI] [PMC free article] [PubMed] [Google Scholar]
- 21.Narendra D, Tanaka A, Suen DF, Youle RJ. Parkin is recruited selectively to impaired mitochondria and promotes their autophagy. J Cell Biol. 2008;183:795–803. doi: 10.1083/jcb.200809125. [DOI] [PMC free article] [PubMed] [Google Scholar]
- 22.Mortensen M, Ferguson DJ, Edelmann M, Kessler B, Morten KJ, Komatsu M, Simon AK. Loss of autophagy in erythroid cells leads to defective removal of mitochondria and severe anemia in vivo. Proc Natl Acad Sci U S A. 2010;107:832–7. doi: 10.1073/pnas.0913170107. [DOI] [PMC free article] [PubMed] [Google Scholar]
- 23.Sandoval H, Thiagarajan P, Dasgupta SK, Schumacher A, Prchal JT, Chen M, Wang J. Essential role for Nix in autophagic maturation of erythroid cells. Nature. 2008;454:232–5. doi: 10.1038/nature07006. [DOI] [PMC free article] [PubMed] [Google Scholar]
- 24.Kundu M, Lindsten T, Yang CY, Wu J, Zhao F, Zhang J, Selak MA, Ney PA, Thompson CB. Ulk1 plays a critical role in the autophagic clearance of mitochondria and ribosomes during reticulocyte maturation. Blood. 2008;112:1493–502. doi: 10.1182/blood-2008-02-137398. [DOI] [PMC free article] [PubMed] [Google Scholar]
- 25.Hardie DG, Scott JW, Pan DA, Hudson ER. Management of cellular energy by the AMP-activated protein kinase system. FEBS Lett. 2003;546:113–20. doi: 10.1016/S0014-5793(03)00560-X. [DOI] [PubMed] [Google Scholar]
- 26.Hardie DG. AMP-activated protein kinase as a drug target. Annu Rev Pharmacol Toxicol. 2007;47:185–210. doi: 10.1146/annurev.pharmtox.47.120505.105304. [DOI] [PubMed] [Google Scholar]
- 27.Kahn BB, Alquier T, Carling D, Hardie DG. AMP-activated protein kinase: ancient energy gauge provides clues to modern understanding of metabolism. Cell Metab. 2005;1:15–25. doi: 10.1016/j.cmet.2004.12.003. [DOI] [PubMed] [Google Scholar]
- 28.Winder WW, Holmes BF, Rubink DS, Jensen EB, Chen M, Holloszy JO. Activation of AMP-activated protein kinase increases mitochondrial enzymes in skeletal muscle. J Appl Physiol (1985) 2000;88:2219–26. doi: 10.1152/jappl.2000.88.6.2219. [DOI] [PubMed] [Google Scholar]
- 29.Hardie DG. AMP-activated protein kinase: an energy sensor that regulates all aspects of cell function. Genes Dev. 2011;25:1895–908. doi: 10.1101/gad.17420111. [DOI] [PMC free article] [PubMed] [Google Scholar]
- 30.Shaw RJ, Kosmatka M, Bardeesy N, Hurley RL, Witters LA, DePinho RA, Cantley LC. The tumor suppressor LKB1 kinase directly activates AMP-activated kinase and regulates apoptosis in response to energy stress. Proc Natl Acad Sci U S A. 2004;101:3329–35. doi: 10.1073/pnas.0308061100. [DOI] [PMC free article] [PubMed] [Google Scholar]
- 31.Ouchi N, Shibata R, Walsh K. AMP-activated protein kinase signaling stimulates VEGF expression and angiogenesis in skeletal muscle. Circ Res. 2005;96:838–46. doi: 10.1161/01.RES.0000163633.10240.3b. [DOI] [PubMed] [Google Scholar]
- 32.Xie Z, Lau K, Eby B, Lozano P, He C, Pennington B, Li H, Rathi S, Dong Y, Tian R, et al. Improvement of cardiac functions by chronic metformin treatment is associated with enhanced cardiac autophagy in diabetic OVE26 mice. Diabetes. 2011;60:1770–8. doi: 10.2337/db10-0351. [DOI] [PMC free article] [PubMed] [Google Scholar]
- 33.Zou MH, Xie Z. Regulation of interplay between autophagy and apoptosis in the diabetic heart: new role of AMPK. Autophagy. 2013;9:624–5. doi: 10.4161/auto.23577. [DOI] [PMC free article] [PubMed] [Google Scholar]
- 34.Kumar SH, Rangarajan A. Simian virus 40 small T antigen activates AMPK and triggers autophagy to protect cancer cells from nutrient deprivation. J Virol. 2009;83:8565–74. doi: 10.1128/JVI.00603-09. [DOI] [PMC free article] [PubMed] [Google Scholar]
- 35.Mihaylova MM, Shaw RJ. The AMPK signalling pathway coordinates cell growth, autophagy and metabolism. Nat Cell Biol. 2011;13:1016–23. doi: 10.1038/ncb2329. [DOI] [PMC free article] [PubMed] [Google Scholar]
- 36.Kijanska M, Peter M. Atg1 kinase regulates early and late steps during autophagy. Autophagy. 2013;9:249–51. doi: 10.4161/auto.22584. [DOI] [PMC free article] [PubMed] [Google Scholar]
- 37.Kraft C, Kijanska M, Kalie E, Siergiejuk E, Lee SS, Semplicio G, Stoffel I, Brezovich A, Verma M, Hansmann I, et al. Binding of the Atg1/ULK1 kinase to the ubiquitin-like protein Atg8 regulates autophagy. EMBO J. 2012;31:3691–703. doi: 10.1038/emboj.2012.225. [DOI] [PMC free article] [PubMed] [Google Scholar]
- 38.Egan DF, Shackelford DB, Mihaylova MM, Gelino S, Kohnz RA, Mair W, Vasquez DS, Joshi A, Gwinn DM, Taylor R, et al. Phosphorylation of ULK1 (hATG1) by AMP-activated protein kinase connects energy sensing to mitophagy. Science. 2011;331:456–61. doi: 10.1126/science.1196371. [DOI] [PMC free article] [PubMed] [Google Scholar]
- 39.Mercer CA, Kaliappan A, Dennis PB. A novel, human Atg13 binding protein, Atg101, interacts with ULK1 and is essential for macroautophagy. Autophagy. 2009;5:649–62. doi: 10.4161/auto.5.5.8249. [DOI] [PubMed] [Google Scholar]
- 40.Xie Z, He C, Zou MH. AMP-activated protein kinase modulates cardiac autophagy in diabetic cardiomyopathy. Autophagy. 2011;7:1254–5. doi: 10.4161/auto.7.10.16740. [DOI] [PMC free article] [PubMed] [Google Scholar]
- 41.He C, Zhu H, Li H, Zou MH, Xie Z. Dissociation of Bcl-2-Beclin1 complex by activated AMPK enhances cardiac autophagy and protects against cardiomyocyte apoptosis in diabetes. Diabetes. 2013;62:1270–81. doi: 10.2337/db12-0533. [DOI] [PMC free article] [PubMed] [Google Scholar]
- 42.Föller M, Sopjani M, Koka S, Gu S, Mahmud H, Wang K, Floride E, Schleicher E, Schulz E, Münzel T, et al. Regulation of erythrocyte survival by AMP-activated protein kinase. FASEB J. 2009;23:1072–80. doi: 10.1096/fj.08-121772. [DOI] [PubMed] [Google Scholar]
- 43.Foretz M, Guihard S, Leclerc J, Fauveau V, Couty JP, Andris F, Gaudry M, Andreelli F, Vaulont S, Viollet B. Maintenance of red blood cell integrity by AMP-activated protein kinase alpha1 catalytic subunit. FEBS Lett. 2010;584:3667–71. doi: 10.1016/j.febslet.2010.07.041. [DOI] [PubMed] [Google Scholar]
- 44.Wang S, Dale GL, Song P, Viollet B, Zou MH. AMPKalpha1 deletion shortens erythrocyte life span in mice: role of oxidative stress. J Biol Chem. 2010;285:19976–85. doi: 10.1074/jbc.M110.102467. [DOI] [PMC free article] [PubMed] [Google Scholar]
- 45.Foretz M, Hébrard S, Guihard S, Leclerc J, Do Cruzeiro M, Hamard G, Niedergang F, Gaudry M, Viollet B. The AMPKγ1 subunit plays an essential role in erythrocyte membrane elasticity, and its genetic inactivation induces splenomegaly and anemia. FASEB J. 2011;25:337–47. doi: 10.1096/fj.10-169383. [DOI] [PubMed] [Google Scholar]
- 46.Kabeya Y, Mizushima N, Ueno T, Yamamoto A, Kirisako T, Noda T, Kominami E, Ohsumi Y, Yoshimori T. LC3, a mammalian homologue of yeast Apg8p, is localized in autophagosome membranes after processing. EMBO J. 2000;19:5720–8. doi: 10.1093/emboj/19.21.5720. [DOI] [PMC free article] [PubMed] [Google Scholar]
- 47.Xie Z, Nair U, Klionsky DJ. Atg8 controls phagophore expansion during autophagosome formation. Mol Biol Cell. 2008;19:3290–8. doi: 10.1091/mbc.E07-12-1292. [DOI] [PMC free article] [PubMed] [Google Scholar]
- 48.Holm TM, Braun A, Trigatti BL, Brugnara C, Sakamoto M, Krieger M, Andrews NC. Failure of red blood cell maturation in mice with defects in the high-density lipoprotein receptor SR-BI. Blood. 2002;99:1817–24. doi: 10.1182/blood.V99.5.1817. [DOI] [PubMed] [Google Scholar]
- 49.Kim J, Kundu M, Viollet B, Guan KL. AMPK and mTOR regulate autophagy through direct phosphorylation of Ulk1. Nat Cell Biol. 2011;13:132–41. doi: 10.1038/ncb2152. [DOI] [PMC free article] [PubMed] [Google Scholar]
- 50.Zhang J, Ney PA. NIX induces mitochondrial autophagy in reticulocytes. Autophagy. 2008;4:354–6. doi: 10.4161/auto.5552. [DOI] [PubMed] [Google Scholar]
- 51.Schweers RL, Zhang J, Randall MS, Loyd MR, Li W, Dorsey FC, Kundu M, Opferman JT, Cleveland JL, Miller JL, et al. NIX is required for programmed mitochondrial clearance during reticulocyte maturation. Proc Natl Acad Sci U S A. 2007;104:19500–5. doi: 10.1073/pnas.0708818104. [DOI] [PMC free article] [PubMed] [Google Scholar]
- 52.Murphy MP. How mitochondria produce reactive oxygen species. Biochem J. 2009;417:1–13. doi: 10.1042/BJ20081386. [DOI] [PMC free article] [PubMed] [Google Scholar]
- 53.Maiuri MC, Zalckvar E, Kimchi A, Kroemer G. Self-eating and self-killing: crosstalk between autophagy and apoptosis. Nat Rev Mol Cell Biol. 2007;8:741–52. doi: 10.1038/nrm2239. [DOI] [PubMed] [Google Scholar]
Associated Data
This section collects any data citations, data availability statements, or supplementary materials included in this article.


