

Abstract
Increased glycolytic flux is a common feature of many cancer cells, which have adapted their metabolism to maximize glucose incorporation and catabolism to generate ATP and substrates for biosynthetic reactions. Indeed, glycolysis allows a rapid production of ATP and provides metabolic intermediates required for cancer cells growth. Moreover, it makes cancer cells less sensitive to fluctuations of oxygen tension, a condition usually occurring in a newly established tumor environment. Here, we provide evidence for a dual role of MAPK14 in driving a rearrangement of glucose metabolism that contributes to limiting reactive oxygen species (ROS) production and autophagy activation in condition of nutrient deprivation. We demonstrate that MAPK14 is phosphoactivated during nutrient deprivation and affects glucose metabolism at 2 different levels: on the one hand, it increases SLC2A3 mRNA and protein levels, resulting in a higher incorporation of glucose within the cell. This event involves the MAPK14-mediated enhancement of HIF1A protein stability. On the other hand, MAPK14 mediates a metabolic shift from glycolysis to the pentose phosphate pathway (PPP) through the modulation of PFKFB3 (6-phosphofructo-2-kinase/fructose 2,6-bisphosphatase 3) degradation by the proteasome. This event requires the presence of 2 distinct degradation sequences, KEN box and DSG motif Ser273, which are recognized by 2 different E3 ligase complexes. The mutation of either motif increases PFKFB3 resistance to starvation-induced degradation. The MAPK14-driven metabolic reprogramming sustains the production of NADPH, an important cofactor for many reduction reactions and for the maintenance of the proper intracellular redox environment, resulting in reduced levels of ROS. The final effect is a reduced activation of autophagy and an increased resistance to nutrient deprivation.
Keywords: autophagy, cell death, glycolysis, HIF1A, MAPK14, PFKFB3, PPP
Introduction
Metabolic alterations are a hallmark of most cancer cells. The first evidence can be dated back to the discovery by Otto Warburg of the so-called aerobic glycolysis or “Warburg Effect,” that stands for the preferential use of glycolysis instead of the far more efficient oxidative phosphorylation (OXPHOS) to produce ATP, even in the presence of normal oxygen tension.1 The use of glycolysis confers cancer cells several metabolic advantages, which are a fast, although inefficient, production of ATP; a robust source of metabolic intermediates for biosynthetic pathways required to sustain a rapid proliferation rate; and a reduced sensitivity to fluctuations of oxygen tension, which often occur in a newly established tumor environment.2,3 To satisfy the increased demand of glucose, cancer cells present various alterations that favor its uptake and catabolism. Glucose is taken up through several glucose transporters, many of which are under the control of oncogenes (e.g., AKT and MYC)4,5 and tumor suppressors (e.g., TP53/TRP53),6 and are upregulated in a great number of tumor histotypes.7,8 Once in the cell and phosphorylated to glucose 6-phosphate (G6P) by hexokinases (HKs), glucose can be converted to fructose 6-phosphate (F6P) and then fructose 1,6-bisphosphate (F1,6BP) by GPI (glucose-6-phosphate isomerase) and PFKL/M (phosphofructokinase, liver/muscle), which commit glucose toward glycolysis. Alternatively, G6P can be redirected to the pentose phosphate pathway (PPP) by G6PD (glucose-6-phosphate dehydrogenase), which converts G6P to 6-phosphoglucono-δ-lactone and NADPH, an important source of reducing equivalents for reductive reactions. Glycolysis is a finely regulated metabolic pathway: the first regulatory point is PFKL/M, whose activity is inhibited by high levels of ATP and citrate and stimulated by AMP and fructose 2,6-bisphosphate (F2,6BP).9,10 The intracellular levels of F2,6BP are controlled by bifunctional enzymes called 6-phosphofructo-2-kinase/fructose 2,6-bisphosphatases (PFKFB1/2/3/4), which catalyze the formation and the degradation of F2,6BP. Four tissue-specific isoforms (PFKFB1/2/3/4) have been so far characterized, each of them showing a characteristic kinase/phosphatase activity ratio.11 Among these 4 isoforms, PFKFB3 is of particular interest because of its ubiquitous expression in most human tissues and its extremely high kinase/phosphatase activity ratio. Indeed, the phosphatase activity of PFKFB3 is negligible and this enzyme only catalyzes the formation of F2,6BP.12 Moreover, this isoform has been observed to be upregulated in a variety of tumor types.13,14 The overexpression of PFKFB3 confers cells a great advantage. The high kinase/phosphatase ratio of PFKFB3 leads to elevated intracellular F2,6BP levels, which in turn activate PFKL/M and redirect glucose toward glycolysis at the expense of the PPP. Moreover, because F2,6BP is one of the most potent activators of PFKL/M, a high F2,6BP concentration can override the inhibitory effects of ATP and citrate, thus contributing to maintaining a high glycolytic flux also when glycolysis products are abundant. PFKFB3 levels are controlled by E3 ligase complexes, such as the anaphase promoting complex/cyclosome (APC/C)-FZR1 (also termed Cdh1) complex (APC/CFZR1) and SKP1-CUL1-F-box (SCF)-BTRC/β-TrCP, which recognize 2 specific regions of the protein, KEN box and DSG motif, respectively, and direct PFKFB3 to proteasomal degradation.15,16
Mitogen-activated protein kinases (MAPKs) are a family of evolutionarily conserved serine/threonine kinases involved in the regulation of several cell processes, ranging from cell growth to differentiation, autophagy, and apoptosis, in response to environmental stimuli. Three are the main MAPKs cascades in mammals: those mediated by MAPK1/ERK2-MAPK3/ERK1, by MAPK8/9/10/JNK1/2/3, and by MAPK14. The MAPK1 cascade is mainly involved in the control of cell proliferation and differentiation, while MAPK14 and MAPK8/9/10 pathways are more implicated in the control of cell survival and cell death, being activated by environmental stresses, which are often associated with the generation of ROS.17,18 MAPKs have been indicated to be also involved in autophagy: while the role of MAPK8/9/10 as positive regulator of autophagy is now rather clear, that of MAPK14 is less defined and is highly dependent on the stimulus provided.19-23 MAPK14 has been, indeed, shown to be able to either promote or suppress autophagy, although its repressive role seems to be the prevalent one. Interestingly, MAPK14 can repress autophagy in a kinase-dependent (through ATG5 phosphorylation), as well as kinase-independent manner. Indeed, phosphorylated MAPK14 competes with the autophagic protein ATG9 for the binding to SUPT20H/P38IP and in turn impairs ATG9 trafficking between the trans-Golgi network and the newly forming autophagosomes.24
Autophagy is a catabolic pathway consisting in the sequestration of cellular components by double-membrane vesicles called autophagosomes, which fuse with lysosomes to form autolysosomes. The content of these vesicles is then degraded and recycled by the cell to produce macromolecules and ATP.25 Autophagy is a crucial mechanism for the maintenance of cellular homeostasis, being involved in the removal of damaged proteins and organelles, and an abnormal or defective activation of autophagy is implicated in the onset of several pathologies, including cancer and neurodegenerative disorders.26
Here, we provide evidence for a dual role of MAPK14 in the control of glucose metabolism in response to nutrient deprivation. In particular, we demonstrate that MAPK14 activation leads to an increase of SLC2A3/GLUT3 expression and glucose uptake. We also demonstrate that MAPK14 redirects glucose toward the PPP by stimulating PFKFB3 degradation by the proteasome. PFKFB3 degradation causes a metabolic reorganization which fuels NADPH production, which finally results in a reduction of ROS levels, a milder activation of autophagy, and a delayed occurrence of starvation-induced cell death.
Results
Nutrient starvation induces a ROS-dependent MAPK14 activation
MAPK14 is involved in the modulation of a plethora of cell processes ranging from proliferation to cell death and autophagy.20 Before investigating the possible involvement of MAPK14 in the modulation of starvation-induced autophagy, we verified whether MAPK14 was phosphoactivated under this experimental condition. Cervix carcinoma HeLa and breast carcinoma SK-BR3 cells were selected for the study, incubated with EBSS for different times and MAPK14 activation was analyzed by western blot. Results depicted in Figure 1A and Figure S1A showed that in both cell lines tested, nutrient deprivation induced a time-dependent increase of phospho-MAPK14. The activation of MAPK14 has been further confirmed by western blot analysis of the phosphorylated form of ATF2, a MAPK14 downstream target, whose phosphorylation pattern reflects that of MAPK14 (Fig. 1A). Moreover, MAPK14 phosphorylation was accompanied by a change in the subcellular distribution, with an increase of its nuclear localization, as shown by western blot and fluorescence microscopy analyses (Fig. 1B and C). Nutrient starvation is known to induce a massive increase of ROS levels,27,28 and MAPK14 is a well-recognized redox-responsive protein kinase.17,29,30 Therefore, to evaluate whether MAPK14 phosphoactivation was dependent on ROS production, we pretreated cells for one h with 5 mM of N-acetyl-l-cysteine (NAC), a well-known antioxidant molecule. Figure 1D and Figure S1D showed that NAC reduced MAPK14 activation, suggesting that this event could be ROS-dependent. Analogous results, although with some cell-line specific differences, were obtained in 2 additional cell lines, namely hepatocarcinoma HepG2 and ovarian carcinoma OC316 cells (Fig. S1B, S1C, S1E, and S1F), indicating that, during starvation, MAPK14 activation could be a common response of most cancer cells. The family of p38 includes 4 different isoforms (MAPK11/p38β, MAPK12/p38γ, MAPK13/p38δ, and MAPK14/p38α),31 among which MAPK14 is the most abundant and widely expressed one. To confirm that MAPK14 was actually phosphorylated in our experimental condition, we downregulated MAPK14 and performed a western blot analysis of phospho-MAPK14. The result showed in Figure S2A revealed that MAPK14 downregulation completely abolished starvation-induced MAPK14 phosphorylation.

Figure 1. Starvation induces MAPK14 phospho-activation and nuclear translocation. (A) HeLa cells were starved for the indicated times and western blot analysis of MAPK14 activation was performed. GAPDH was used as loading control. (B) HeLa cells were starved for the indicated times and both cytosolic and nuclear fractions were collected. Western blot analysis of phospho-MAPK14 was performed. LMNA/Lamin A/C and lactate dehydrogenase (LDH) were used as purity control. (C) (upper panel) Fluorescence microscope analysis of nuclear phospho-MAPK14 of HeLa cells starved for 3 h. Hoechst 33342 was used to detect nuclei. (lower panel) Quantification of cells with nuclear phospho-MAPK14. Data are presented as mean ± SD of n = 3 independent experiments. **P < 0.01 against medium. (D) HeLa cells were pretreated for one h with either vehicle or 5 mM NAC and then starved for the indicated times. Western blot analysis of MAPK14 activation was performed. GAPDH was used as loading control. Western blots are from one experiment representative of 3 that gave similar results. Numbers indicate relative phospho-MAPK14/MAPK14 ratios.
Active MAPK14 limits autophagy and preserves cell viability
After demonstrating that MAPK14 was activated in response to nutrient deprivation, we tested whether MAPK14 activation was functional for the occurrence of autophagy. To this aim, we downregulated MAPK14 activity and/or expression and analyzed cell response. Obtained results indicated that both the downregulation and the pharmacological inhibition of MAPK14 led to a more sustained activation of autophagy in HeLa cells, as shown by fluorescence microscopy (Fig. 2A) and western blot (Fig. 2B; Fig. S2C) analyses of the lipidated form of MAP1LC3B (MAP1LC3B-II), a widely used marker of autophagy.32 Similar results were obtained in SK-BR3 cells (Fig. S2D). To discriminate between an increase and a block of autophagic flux, we treated HeLa cells with 50 μM of the late-stage autophagy inhibitor chloroquine, which led to a further increase of MAP1LC3B-II (Fig. 2B). These results, together with the evidence that protein but not mRNA levels of the autophagy marker SQSTM1/p62 upon siRNA to MAPK14 were decreased (Fig. 2C; Fig. S2B and S2D), indicated that MAPK14 downregulation brought about an increase rather than a block of autophagic flux, thus revealing a role of MAPK14 as negative modulator of starvation-induced autophagy.

Figure 2. MAPK14 modulates autophagy and preserves cell viability. (A) Fluorescence microscopy analysis of HeLa cells cotransfected with an EGFP-LC3-containing plasmid and with either a nontargeting siRNA (siScr) or an siRNA targeting MAPK14 (siMAPK14). Twelve h after transfection, cells were starved for 3 h and the number of LC3-II dots were counted. At least 100 cells per sample were analyzed from n = 3 independent experiments. **P < 0.01 against siScr EBSS. (B and C) HeLa cells were transfected with either a nontargeting siRNA (siScr) or an siRNA targeting MAPK14 (siMAPK14). Twelve h after transfection cells were starved for 3 h and western blot analyses of MAP1LC3B and SQSTM1 were performed. Where indicated, 50 μM chloroquine (CQ) was added 30 min before the end of each experimental time. MAPK14 and GAPDH were used as knockdown and loading control, respectively. (D) HeLa cells were pretreated for one h with either vehicle or 10 μM of the MAPK14 inhibitor SB203580 and then starved for the indicated times. Western blot analyses of CASP9 and 3 were performed. GAPDH was used as a loading control. (E) HeLa cells were pretreated as in (D) and then starved for 48 h. The percentage of dead cells was assayed by Trypan blue staining procedure. Data are expressed as mean ± SD of n = 3 independent experiments. **P < 0.01 against vehicle EBSS. Western blots are from one experiment representative of 3 that gave similar results.
Finally, we tested whether the inhibition of MAPK14 activity has some effects on cell viability by analyzing cell death upon nutrient deprivation. Western blot analyses of CASP3 and 9, as well as Trypan blue exclusion assay in the presence of 10 μM of the pharmacological inhibitor of MAPK14, SB203580 (Fig. 2D and E), showed that the inhibition of MAPK14 caused an earlier and stronger activation of a caspase-dependent cell death mechanism. The increased activation of autophagy upon MAPK14 downregulation and the substantial gap between MAPK14 phosphorylation, which declines after 4 h to 6 h (data not shown), and the occurrence of cell death (30 h to 36 h), allow us to speculate that the increased cell death may be the consequence of the augmented autophagic rate. Indeed, although autophagy is considered to be a prosurvival mechanism, especially under stress conditions, its abnormal activation can be detrimental rather than beneficial and may give rise to cell death.33
MAPK14 modulates glucose metabolism
In searching for a mechanism that could explain the MAPK14 -mediated effects on autophagy, we asked whether the inhibition of autophagy could be due to a modulation of cell metabolism. To this aim, we checked whether MAPK14 was involved in the control of glucose metabolism. Glucose is taken up by several glucose transporters, among which SLC2A1/GLUT1 and SLC2A3 possess the highest affinity for glucose and are often overexpressed in tumors.34 We tested whether MAPK14 could mediate the upregulation of one of these 2 transporters. Real-Time qPCR and western blot analyses showed that starvation induced an increase of SLC2A3 mRNA expression (Fig. 3A; Fig. S3A), as well as protein levels (Fig. 3B; Fig. S3B). This event was almost completely reverted by siRNA against MAPK14 (Fig. 3B and C; Fig. S3B). On the contrary, SLC2A1 expression was not affected (Fig. 3A; Fig. S3C). Cytofluorometric analysis of the incorporation of the fluorescent glucose analog 2-(N-(7-Nitrobenz-2-oxa-1,3-diazol-4-yl)Amino)-2-Deoxyglucose (2-NBDG) showed that MAPK14 activation was associated with a higher uptake of glucose. In fact, this phenomenon is almost completely reverted by MAPK14 downregulation or inhibition (Fig. 3D; Fig. S3D and S3E). The expression of glucose transporters is regulated by several transcription factors, among which HIF1A is one of the most important and it is already known to be modulated by MAPK14.35 Western blot analysis revealed that HIF1A protein levels increased during starvation and that MAPK14 phosphoactivation was associated with this event (Fig. 3E). Western blot analyses of 2 known HIF1A targets, HK2 and BNIP3, confirmed that HIF1A is upregulated and activated in a MAPK14-dependent manner (Fig. 3E). Given that no increase in HIF1A mRNA was observed (data not shown), its increase could reasonably be due to an augmented protein stability. We then performed western blot analysis of SLC2A3 in the presence of 20 μM of the specific inhibitor of HIF1A, YC-1. Results shown in Figure 3F point out that YC-1 reduced both HIF1A and SLC2A3 upregulation, demonstrating that a MAPK14-HIF1A axis participates in the upregulation of SLC2A3 during nutrient deprivation.

Figure 3. HIF1A is involved in MAPK14-mediated SLC2A3 upregulation. (A) HeLa cells were starved for 3 h and the relative expressions of SLC2A1 and SLC2A3 mRNAs were assayed by real-time PCR. Data are presented as mean ± SD of n = 3 independent experiments. **P < 0.01 against Medium. (B) HeLa cells were transfected with either a nontargeting siRNA (siScr) or an siRNA targeting MAPK14 (siMAPK14). Twelve h after transfection cells were starved for the indicated times and western blot analysis of SLC2A3 was performed. SLC2A3 and GAPDH were used as knockdown and loading control, respectively. Numbers indicate relative SLC2A3/GAPDH ratios (C) HeLa cells were transfected as in (B). Twelve h after transfection cells were starved for 3 h and relative expression of SLC2A3 mRNA was assayed by real-time PCR. Data are presented as mean ± SD of n = 3 independent experiments. **P < 0.01 against siScr medium. ##P < 0.01 against siScr EBSS. (D) HeLa cells were transfected and treated as in (C). Thirty min before the end of the experimental time, cell were incubated with 100 μM 2-NBDG and cytofluorometrically analyzed. Data are presented as mean ± SD of n = 3 independent experiments. *P < 0.05 against siScr Medium. #P < 0.05 against siScr EBSS. (E) HeLa cells were transfected and treated as in (C). Western blot analysis of HIF1A, HK2, and BNIP3 were performed. MAPK14 and GAPDH were used as knockdown and loading control, respectively. Numbers indicate relative HIF1A/GAPDH ratios. (F) HeLa cells were pretreated for one h with either vehicle or 20 μM of the HIF1A inhibitor YC-1 and then starved for 3 h. Western blot analyses of HIF1A, SLC2A3, phospho-MAPK14, and MAPK14 were performed. GAPDH was used as loading control. Western blots are from one experiment representative of 3 that gave similar results. Numbers indicate relative SLC2A3/GAPDH ratios.
Once incorporated, glucose can be directed toward 2 main metabolic pathways: glycolysis or the PPP. At this stage, we hypothesized that the increased incorporation of glucose could result in an increased glycolytic flux and, in turn, contribute to fulfill, at least in part, the energetic requirements of the cells. To verify this hypothesis, we analyzed glycolytic flux in conditions of nutrient starvation by measuring lactate concentration in the extracellular medium. Unexpectedly, both the downregulation and the pharmacological inhibition of MAPK14 resulted in an increase in extracellular lactate concentration with respect to control cells, arguing for a negative effect of MAPK14 on glycolysis (Fig. 4A; Fig. S4A and S4B). We then verified the possibility that glucose was channeled toward the PPP to fuel NADPH production. To demonstrate this alternative hypothesis, we measured PPP flux and NADPH levels. Results depicted in Figure 4B and C and Figure S5A showed that during starvation a significant increase in PPP flux and NADPH levels could be observed and that MAPK14 downregulation completely reverted both events. A possible explanation of this shift toward PPP relies on the crucial role of NADPH as a cofactor in many reductive reactions, which contribute to maintain low levels of ROS. During starvation there is a dramatic burst of ROS levels. Cytofluorometric analysis of ROS production revealed that both the downregulation or the pharmacological inhibition of MAPK14 led to a further increase of ROS concentration (Fig. 4D; Fig. S5B). Results so far obtained indicate that MAPK14 regulated glucose metabolism by increasing glucose incorporation and redirecting glucose toward PPP, thus fueling NADPH production and limiting ROS concentration. Since ROS are essential for starvation-induced autophagy, the control of ROS levels by MAPK14 may provide a rationale for the modulatory effect of MAPK14 on autophagy.

Figure 4. Glycolysis to the PPP metabolic shift affects NADPH and ROS levels. (A) HeLa cells were transfected with either a nontargeting siRNA (siScr) or an siRNA targeting MAPK14 (siMAPK14). Twelve h after transfection cells were starved for the indicated times and extracellular lactate assayed spectrophotometrically. Data are presented as mean ± SD of n = 3 independent experiments. (B) HeLa cells were transfected as in (A). Twelve h after transfection cells were cultured for 9 h with either complete medium (Medium) or EBSS containing 10 mM 13C-2-d-glucose. Media were used to analyze PPP flux by NMR. Data are presented as mean ± SD of n = 3 independent experiments.*P < 0.05 against siScr Medium. (c) HeLa cells were transfected as in (A). Twelve h after transfection cells were starved for the indicated times and NADPH assayed spectrophotometrically. Data are presented as mean ± SD of n = 3 independent experiments. *P < 0.05 against siScr Medium. **P < 0.01 against siScr Medium. #P < 0.05 against siMAPK14 Medium. (D) HeLa cells were transfected as in (A). Twelve h after transfection cells were starved for 3 h. Thirty min before the end of the experimental time, cells were incubated with 50 μM H2DCF-DA and ROS levels were measured cytofluorometrically. Data are presented as mean ± SD of n = 3 independent experiments. *P < 0.05 against siScr EBSS.
MAPK14 promotes PFKFB3 degradation via the proteasome
Once we demonstrated that MAPK14 was activated during nutrient deprivation and that it modulated glucose metabolism, we searched for the mechanism responsible for this phenomenon. Since we did not observe any change in G6PD mRNA or protein levels (data not shown), we hypothesized that the glycolysis-PPP switch could be due to a downregulation of glycolysis. We focused our attention on PFK-2/FBPase-2, a key modulator of glycolysis, whose isoform 3 (PFKFB3) is overexpressed in many tumors. We have shown above that during starvation there was an increase of nuclear phospho-MAPK14 (Fig. 1B and C). Given that PFKFB3 also localizes into the nucleus, we hypothesized that MAPK14 could affect glycolysis through PFKFB3. To this aim, we investigated whether PFKFB3 was modulated during starvation and the eventual involvement of MAPK14. Figure 5A and B and Figure S5C showed that nutrient starvation induced a decrease of PFKFB3, as well as of PFKFB3 product F2,6BP and that MAPK14 downregulation restored PFKFB3 and F2,6-BP at normal or even higher levels than control cells. PFKFB3 is known to be regulated by proteasomal degradation.15 To verify whether in our experimental conditions PFKFB3 was degraded through this mechanism, we starved the cells in the presence of 10 μM of the proteasome inhibitor MG132. Western blot analyses showed that proteasome inhibition prevented starvation-induced PFKFB3 decrease (Fig. 5C; Fig. S5D), indicating that PFKFB3 is degraded in a proteasome-dependent manner. The hypothesis of an active role of MAPK14 in the modulation of PFKFB3 was further strengthened by the result showing the increase of the interaction between PFKFB3 and MAPK14 during nutrient deprivation (Fig. 5D).

Figure 5. MAPK14-dependent PFKFB3 degradation requires both the KEN box and Serine 273. (A) HeLa cells were transfected with either a nontargeting siRNA (siScr) or an siRNA targeting MAPK14 (siMAPK14). Twelve h after transfection cells were starved for the indicated times and western blot analysis of PFKFB3 was performed. MAPK14 and GAPDH were used as knockdown and loading controls, respectively. (B) HeLa cells were transfected as in (A) Twelve h after transfection cells were starved for 3 h and fructose 2,6-bisphosphate (F2,6BP) concentration measured. Data are presented as mean ± SD of n = 3 independent experiments. *P < 0.05 against siScr Medium. (C) HeLa cells were pretreated for one h with either vehicle or 10 μM of the proteasome inhibitor MG132 and then starved for 3 h. Western blot analysis of PFKFB3 was performed. GAPDH was used as loading control. (D) HeLa cells were starved for 3 h and cell lysates were immunoprecipitated with either an anti-PFKFB3 antibody or a preimmune antibody (IgG). Western blot analysis of MAPK14 was performed. PFKFB3 was used as a immunoprecipitation control. (E) HeLa cells were transfected with a plasmid containing either PFKFB3 WT or the PFKFB3KEN to AAA mutant (AAA). Thirty-six h after transfection, cells were starved for the indicated time and western blot analysis of PFKFB3 was performed. GAPDH was used as loading control. (F) HeLa cells were transfected with a plasmid containing either PFKFB3 WT or PFKFB3S273A mutant (S273A). Thirty-six h after transfection, cells were starved for the indicated time and western blot analysis of PFKFB3 was performed. GAPDH was used as loading control. Western blots are from one experiment representative of 3 that gave similar results. Numbers indicate relative PFKFB3/GAPDH ratios.
Starvation-induced PFKFB3 proteasome-dependent degradation requires the KEN box and DSG motif Serine 273
PFKFB3 protein levels are controlled by the APC/CFZR1 complex, which recognizes PFKFB3 KEN box, ubiquitinates and directs it to degradation by the proteasome. Thus, we tested whether KEN box was required for starvation-induced PFKFB3 degradation. To this aim, we transfected cells with plasmids expressing either PFKFB3 wild type (WT) or PFKFB3 harboring a KEN to AAA mutation, which has already been demonstrated to be resistant to APC/CFZR1-dependent degradation.16 Result showed in Figure 5E indicated that the PFKFB3KEN to AAA mutant is more resistant to starvation-induced degradation with respect to WT, indicating that PFKFB3 degradation may be mediated by APC/CFZR1. In addition to KEN box, PFKFB3 also possesses a DSG motif, which presents a phosphorylatable serine residue (Ser273), which has been shown to be important for the recognition by SCF-BTRC.36 To test whether Ser273 was required for starvation-induced PFKFB3 degradation, we generated a PFKFB3 mutant which presents a S273A mutation by site-directed mutagenesis. Western blot analysis showed that, similarly to the KEN to AAA mutant, the S273A mutant showed increased resistance to starvation-induced degradation (Fig. 5F) with respect to WT. These results suggested that both APC/CFZR1 and SCF-BTRC might contribute to PFKFB3 degradation upon nutrient deprivation. Finally, to verify whether PFKFB3 degradation was responsible for the glycolysis-PPP switch, we overexpressed the PFKFB3KEN to AAA mutant and measured extracellular lactate and PPP flux, as well as NADPH levels. Results depicted in Figure 6A–C showed that PFKFB3KEN to AAA overexpression reverted starvation-induced enhancement of PPP flux and NADPH levels. Moreover, PFKFB3KEN to AAA overexpression caused a further increase of starvation-induced ROS levels (Fig. 6D) and a more sustained activation of autophagy (Fig. 6E and F). These results resembled those obtained with MAPK14 dowregulation and demonstrated that MAPK14-mediated PFKFB3 degradation was responsible for glycolysis-PPP switch induced by nutrient deprivation (Fig. 7).

Figure 6. PFKFB3KEN to AAA overexpression mimics MAPK14 downregulation. (A) HeLa cells were transfected with either the empty vector or a plasmid containing the PFKFB3KEN to AAA mutant (AAA). Thirty-six h after transfection, cells were starved for the indicated time and extracellular lactate assayed spectrophotometrically. Data are expressed as nmol lactate/ml medium and represent the mean ± SD of n = 3 independent experiments. (B) HeLa cells were transfected as in (A) and cultured for 9 h with either complete medium (Medium) or EBSS containing 10 mM 13C-2-d-glucose. Media were used to analyze PPP flux by NMR. Data are presented as mean ± SD of n = 3 independent experiments. *P < 0.05 against Vector Medium. (C) HeLa cells were transfected as in (A), starved for 3 h and NADPH assayed spectrophotometrically. Data are presented as mean ± SD of n = 3 independent experiments. *P < 0.05 against Vector Medium. (D) HeLa cells were transfected as in (A) and starved for 3 h. Thirty min before the end of the experimental time, cells were incubated with 50 μM H2DCF-DA and ROS levels were measured cytofluorometrically. Data are presented as mean ± SD of n = 3 independent experiments. *P < 0.05 against Vector EBSS. (E) HeLa cells were transfected as in (A), cells starved for 3 h and western blot analysis of MAP1LC3B was performed. PFKFB3 and GAPDH were used as transfection and loading controls, respectively. Western blots are from one experiment representative of 3 that gave similar results. (F) Fluorescence microscopy analysis of HeLa cells cotransfected with an EGFP-LC3-containing plasmid and with either the empty vector or a plasmid containing the PFKFB3KEN to AAA mutant (AAA). Thirty-six h after transfection, cells were starved for 3 h and the number of LC3-II dots were counted. At least 100 cells per sample were analyzed from n = 3 independent experiments. **P < 0.01 against Vector EBSS.
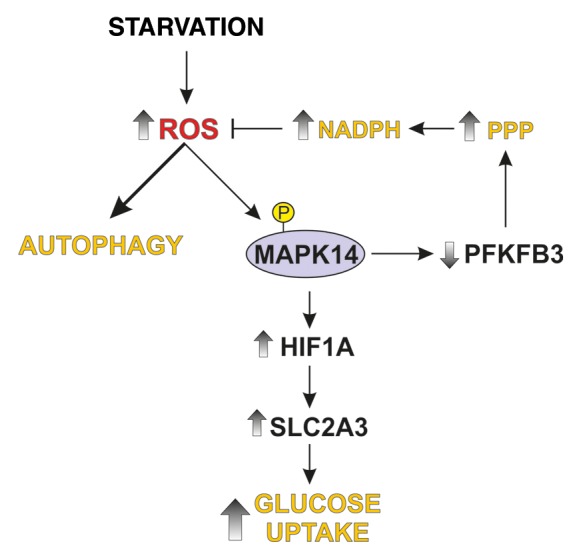
Figure 7. Proposed model of MAPK14-dependent modulation of glucose metabolism. Starvation causes activation of autophagy and MAPK14 phosphorylation. Active MAPK14 upregulates SLC2A3 expression through HIF1A stabilization and increases glucose incorporation. In addition, MAPK14 induces a proteasome-dependent degradation of PFKFB3, which results in an increase of pentose phosphate pathway (PPP) at the expense of glycolysis. PPP enhancements fuels NADPH production, leading to reduced ROS levels and autophagy activation.
Discussion
A great number of alterations responsible for tumorigenesis regard genes involved in cell metabolism, in particular those related to glucose and glutamine.37,38 Overall, these alterations are aimed at maximizing the incorporation and catabolism of nutrients. In addition, when nutrient availability is high, they confer a metabolic advantage to cancer cells with respect to their normal counterparts. However, the high energetic demand makes cancer cells more sensitive to nutrient withdrawal, as demonstrated by many lines of evidence.39,40 Therefore, nutrient addiction of cancer cells can be, in theory, exploited to develop strategies that selectively kill cancer cells by targeting tumor-specific metabolic features.41,42 In this context, we have here demonstrated that cancer cells counteract nutrient-limited conditions by means of a MAPK14 -mediated reorganization of glucose metabolism, which takes place at 2 different levels and contributes to increase cell resistance to this condition. The first effect of MAPK14 deals with the modulation of glucose uptake, which resulted to be increased as a consequence of the upregulation of the glucose transporter SLC2A3. Interestingly, in our experimental conditions, only SLC2A3 is upregulated, while the other main transporter (i.e., SLC2A1) does not seem to be affected by nutrient deprivation. This can be explained taking into consideration that SLC2A3 is the transporter with the highest affinity for glucose (Km = 1.8 mM against 2-deoxy-d-glucose) and one of those with the highest capacity,43 making it the ideal candidate to maintain an appropriate glucose uptake under condition of nutrient shortage. SLC2A3 protein upregulation is the consequence of an increase of its mRNA levels, that we have demonstrated to be under the control of HIF1A. HIF1A is known for its role under hypoxic conditions; however, it has been demonstrated that an increase in its levels can be observed even under normal oxygen tension.44 Notably, in our experimental conditions, HIF1A protein levels augmented in a MAPK14-dependent manner, reasonably as a result of an increased protein stability, as no change in HIF1A mRNA levels was observed (unpublished data). In light of the multiple HIF1A targets besides SLC2A3 (e.g., SLC2A1), it is likely that other factors may contribute in determining the selective activation of the sole SLC2A3 during starvation. This aspect and how HIF1A is modulated by MAPK14 are still under investigation. However, we can hypothesize, at least for the latter, that the ubiquitin ligase Seven in absentia homolog 2 (SIAH2), which controls HIF1A stability, could be involved in this event. In particular, SIAH2 has been demonstrated to control HIF1A abundance by mediating prolyl hydroxylases degradation by the proteasome under hypoxic conditions and has also been indicated to be modulated by MAPK14, which phosphorylates SIAH2 at Thr24 and Ser29, enhancing its activity.45,46 The second event that we have found to be regulated by MAPK14 and that plays a role in facing adverse nutrient conditions is the proteasome-dependent degradation of PFKFB3, which underlies the metabolic shift between glycolysis and the PPP. PFKFB3 is a protein often upregulated in cancer and its strong positive effect on PFKL/M can circumvent the allosteric inhibition of ATP and citrate toward PFK-1, thus contributing to maintain a high glycolytic flux. PFKFB3 protein levels are controlled by at least 2 ubiquitin-ligase complexes, APC/CFZR1 and SCF-BTRC, that recognize 2 different degradation sequences, the so-called degrons, present in PFKFB3: KEN box and DSG motif, respectively. We have shown that mutations on these 2 motifs (i.e., KEN to AAA and S273A) decreased starvation-induced PFKFB3 degradation, suggesting for their involvement in the regulation of PFKFB3 stability. However, the S273A mutant resulted to be much more resistant than the KEN box mutant, which is not completely resistant to degradation, implying that in our experimental condition the role of SCF-BTRC is predominant. Although the mechanism through which MAPK14 affects PFKFB3 stability is still unclear, our results sustain the hypothesis that MAPK14 could control PFKFB3 levels by mediating the phosphorylation of the Ser273 residue located within the DSG motif, either directly or indirectly. Indeed, the phosphorylation of this serine residue has already been shown to be required for the recognition of PFKFB3 by SCF-BTRC.15 This hypothesis is strengthened by the evidence that MAPK14 accumulates into the nucleus (where PFKFB3 also localizes)47 and physically interacts with PFKFB3 to an extent that increases during starvation. Further studies aimed at dissecting this aspect are currently ongoing in our lab. Taken together, our results argue for MAPK14 causing an increase of glucose incorporation despite PFKFB3 degradation. The concomitant occurrence of both these events leads to a rearrangement of glucose metabolism, which results in a reduced glycolytic flux and an increase of the PPP, required to fuel NADPH production. The increased availability of NADPH could have a role in reducing ROS levels and then autophagy, thereby revealing the biological significance of such a metabolic switch. Indeed, although NADPH is not an antioxidant itself, it can indirectly control ROS levels by providing reducing equivalents required for many reductive reactions, which contributes to maintain a proper intracellular redox state.48 In particular, NADPH participates in the maintenance of glutathione homeostasis,49 a crucial determinant of the cellular redox balance, whose alteration modulates a plethora of cellular mechanisms, including autophagy, as we have demonstrated in previous works.27,50 From this point of view, the modulation of autophagy could be at the basis of the protective effect of MAPK14 on starvation-induced cell death. In fact, although autophagy is a well-known protective mechanism that contributes to maintain cell viability by providing substrates for ATP production and macromolecules synthesis through the self-digestion of cellular components, an uncontrolled activation of autophagy may, on the contrary, be detrimental and could finally give rise to cell death. In this context, the contribution of MAPK14 as either an activator or an inhibitor of autophagy seems to always provide beneficial effects to the cell. In fact, if on the one hand, MAPK14 triggers autophagy and confers resistance of colon cancer cells to 5-fluorouracil and irinotecan, on the other hand, results showed in this work suggest that MAPK14 beneficial effect is performed through the prevention of an excessive activation of autophagy.51,52 In conclusion, the results shown in this work provide evidence that MAPK14 is a key factor in driving an adaptive response to an unfavorable stress condition, which could contribute to the emergence of a resistant phenotype in cancers, making this protein a potential therapeutic target for the enhancement of conventional anticancer therapies.
Materials and Methods
Materials
Chloroquine (C6628), dimethyl sulfoxide (DMSO, 154938), N-acetylcysteine (NAC, A9165), TRI Reagent (T9424), fructose 6-phosphate (F1502), fructose-6-phosphate kinase (F2258), aldolase (A8811), α-glycerophosphate dehydrogenase-triosephosphate isomerase (G1881) fructose 2,6-bisphosphate (47822), and sodium pyrophosphate tetrabasic decahydrate (30411) were from Sigma-Aldrich. Trypan Blue 0.4% solution (17-942E) was from Lonza. Goat anti-mouse (172-1011) and anti-rabbit (172-1019) IgG (H+L)-horseradish peroxidase conjugated were from Bio-Rad Laboratories. Anti IgG2a (sc-2061) and normal mouse IgG (sc-2025) were from Santa Cruz Biotechnology. 2′,7′-dihydrodichlorofluorescin diacetate (H2DCF-DA, D399), 2-(N-(7-nitrobenz-2-oxa-1,3-diazol-4-yl)amino)-2-deoxyglucose (2-NBDG) (N13195), Alexa Fluor® 594 goat anti-rabbit IgG (H+L) (A-11012) and Hoechst 33342 (H1399) were from Life Technologies Ltd. TurboFect Transfection Reagent (R0531) and DharmaFECT 1 Transfection Reagent (T-2001-02) were from Thermo Fisher Scientific. HIF1A inhibitor, YC-1 (ALX-420-025) was from Enzo Life Sciences. NAD (10768197103) and NADH (10128023001) were from Roche Applied Science. D-glucose-2-13C (CC855P1) was from Cortecnet. MAPK14 inhibitor SB203580 (559389) and all other chemicals were from Merck Millipore.
Cell lines and cell culture
HeLa, SK-BR3, HepG2, and OC316 cell lines were obtained from the Istituto Tumori Genova; HeLa and SK-BR3 cells were grown in DMEM (Lonza, BE12-614F, Basel, CH), supplemented with 10% FBS (Lonza, DE14-802F) and 2 mM L-glutamine (Lonza, 17-605E). HepG2 were grown in RPMI1640 (Lonza, BE12-115F/U1), supplemented with 10% FBS. OC316 were grown in RPMI1640 (Lonza, BE12-702F), supplemented with 5% FBS. All cell lines were grown at 37 °C in an atmosphere of 5% CO2. Nutrient starvation was performed by culturing cells with EBSS (Lonza, BE10-502F); SB203580 was used at the final concentration of 10 μM; YC-1 was used at the final concentration of 10 μM ; NAC (Sigma-Aldrich, A7250) was used at the final concentration of 5 mM; 2-NBDG was used at the final concentration of 100 μM; H2DCF-DA was used at the final concentration of 50 μM. MG132 was used at the final concentration of 10 μM.
Plasmids, siRNAs, and transfections
The EGFP-LC3-containing plasmid was kindly provided by Prof Francesco Cecconi, Department of Biology, University of Rome “Tor Vergata,” Italy. pIRES2-EGFP-PFKFB3 WT and pIRES2-EGFP-PFKFB3KEN to AAA plasmids were a kind gift of Prof Juan P Bolaños, Departamento de Bioquimica y Biologia Molecular, Instituto de Neurociencias de Castilla y Leon, Universidad de Salamanca, Spain. pIRES2-EGFP-PFKFB3S273A was generated from pIRES2-EGFP-PFKFB3 WT by site-directed mutagenesis using the primer 5′-CGACTCAGGC CTGTCCGCCA GAGGCAAGAA GTTC-3′ and its reverse and complementary primer. The presence of the mutation was verified by DNA sequencing. Knockdown of MAPK14 was performed by transfecting the cells with On-TargetPlus SmartPool small interference RNA (siRNA) (Darmacon). Controls were transfected with a scrambled siRNA duplex, which does not present homology with any other human mRNAs (siScr) (Santa Cruz Biotechnology, sc-37007). Plasmids and siRNAs were transfected using TurboFect Transfection Reagent and DharmaFECT 1 Transfection Reagent (Thermo Fisher Scientific, T-2001-02), respectively, according to the manufacturer’s instructions.
Quantitative real-time PCR
Cells were homogenized in TRI Reagent and RNA was extracted according to manufacturer’s instructions. Total RNA was resuspended in RNase-free water and 1 μg of total RNA was used to generate first-strand cDNA using the GoScript Reverse Transcription System (Promega). In order to hybridize unique regions of the appropriate gene sequence, specific sets of primer pairs were designed and tested with primerBLAST (NCBI). Primers used are as follow: SLC2A1, forward: 5′-TTCACTGTCG TGTCGCTGTT-3′, reverse: 5′-TGAGTATGGC ACAACCCGC-3′; SLC2A3, forward 5′-GCAGCAACGA CACAGAAACT G-3′, reverse 5′-GTTTCAGCGG TGGGTAATGG A-3′; SQSTM1, forward: 5′-GGGAAAGGGC TTGCACCGGG-3′, reverse: 5′-CTGGCCACCC GAAGTGTCCG-3′; ACTB, forward: 5′-GGCCGAGGAC TTTGATTGCA-3′, reverse: 5′-GGGACTTCCT GTAACAACGC A-3′. Real-time PCR was performed using the iTAQ universal SYBR Green Supermix (Bio-Rad Laboratories, 172-5120) on a StepOne real-time PCR System (Applied Biosystems). All reactions were run as triplicates. Data were analyzed by the StepOne™ Software (v2.3) using the second derivative maximum method. The fold changes in mRNA levels were relative to a control after normalization to the internal standard ACTB.
Cell fractionation
To obtain nuclear extracts, cells were lysed in nucleus buffer (1 mM K2HPO4, pH 6.4, 150 mM NaCl, 14 mM MgCl2, 1 mM EGTA, 0.1 mM DTT, 0.3% Triton X-100 (Sigma-Aldrich, X100), centrifuged at 450 × g for 10 min at 4 °C. After 3 washes with nucleus buffer, the nuclear fractions obtained were further lysed with lysis buffer.
Immunoblotting
Total protein lysates were obtained as previously reported,53 electrophoresed by SDS-PAGE and blotted onto nitrocellulose membrane (GE Healtcare, 10402495). Primary antibodies used are as follow: polyclonal anti-CASP9 (9502) and anti-phospho-ATF2 (5112) were from Cell Signaling Technology; anti-ATF2 (sc-187), anti-BNIP3 (sc-56167), anti-SLC2A1 (sc-7903), anti-LDH (sc-33781), anti-HIF1A (sc-107989), anti-LMNA/lamin A/C (sc-20681), anti-MAPK14 (sc-535) and anti-PFKFB3 (sc-10090) were from Santa Cruz Biotechnology; anti-LC3 (L7543) was from Sigma-Aldrich; anti-phospho-MAPK11/12/14 (44-684G) was from Life Technologies Ltd; monoclonal anti-PFKFB3 (H00005209-M08) and anti-HK2 (H00003099-M01) were from Abnova; anti-CASP3 (sc-56053), anti-GAPDH (sc-47724) and anti-SLC2A3 (sc-74399) were from Santa Cruz Biotechnology. The specific protein complex, formed upon incubation with specific secondary antibodies (Bio-Rad Laboratories, 170-6515, 170-6516, 172-1034), was identified using a Fluorchem imaging system (Alpha Innotech) after incubation with ECL™ Select Western Blotting Detection Reagent (GE Healtcare, RPN2235).
Immunoprecipitation
Cell pellets were resuspended in RIPA buffer (50 mM TRIS-HCl, pH 8, 150 mM NaCl, 1% NP-40 [Sigma-Aldrich, 74385], 0.5% sodium deoxycholate, 0.1% SDS), incubated 30 min on ice, and lysates were centrifuged at 14,000 × g for 15 min at 4 °C. Five hundred micrograms of proteins were precleared by incubation with 25 μl of protein A/G-agarose (Santa Cruz Biotechnology, sc-2003) for 2 h at room temperature. Protein G-sepharose was removed by centrifugation and lysates were incubated with either 5 μl of anti-PFKFB3 antibody or an equal amount of normal mouse IgG overnight at 4 °C. Immunocomplexes were then adsorbed with 50 μl of protein G-sepharose for one h at room temperature. After 3 washes with RIPA buffer, immune pellets were resuspended in 50 μl of 2× sample buffer and boiled for 5 min. Thirty μl of proteins were loaded on a 10% SDS-polyacrylamide gel and transferred to nitrocellulose membrane. Polyclonal anti-MAPK14 antibody was used as primary antibody.
NADPH measurement
NADPH measurements were performed using an NADP/NADPH Quantitation Kit (Sigma-Aldrich, MAK038), according to the manufacturer’s instructions.
Extracellular lactate assay
Ten microliters of trichloroacetic acid-precipitated cell media were incubated for 30 min at room temperature in 290 µl of a 0.2 M glycine/hydrazine buffer, pH 9.2, containing 0.6 mg/ml NAD+ and 17 U/ml lactate dehydrogenase (Roche Applied Science, 10127876001). NAD+ reduction was followed at 340 nm and nmoles of NADH formed were considered stoichiometrically equivalent to extracellular lactate.
Fructose 2,6-bisphosphate assay
Intracellular fructose 2,6-bisphosphate (F2,6BP) was measured as described by Van Schaftingen et al.54 Briefly, cell pellets were resuspended with 20 volumes of 0.05 M NaOH and then with one volume of 0.1 M NaOH, vortexed for 10 s and incubated at 80 °C for 5 min. After cooling, cell extracts were neutralized with acetic acid in the presence of 20 mM HEPES and centrifuged for 15 min at 14000 × g at 4 °C. The supernatant was used to measure F2,6BP concentration by analyzing F2,6BP stimulation of PFK1 (Sigma-Aldrich, F2258) activity, assayed in the presence of 50 mM TRIS-HCl pH 8.0, 2 mM MgCl2, 2,5 mM fructose 6-phosphate, 0.15 mM NADH, 0.05 U/ml PPi-dependent PFK1, 0.4 U/ml aldolase, 0.4 U/ml α-glycerophosphate dehydrogenase-triosephosphate isomerase and 0.5 mM pyrophosphate. NADH consumption was measured at 340 nm and recorded for 5 min. F2,6-BP was calculated based on a calibration curve produced by measuring PFK1 activity in presence of 0.1 to 1 pmol of F2,6BP and normalized to total protein.
Oxidative PPP flux analysis
The flux through the oxidative branch of the PPP was measured as described by Mancuso et al.55 Briefly, cells were incubated for 9 h with either complete medium or EBSS, both containing 10 mM 13C-2-d-glucose (CortecNet, CC855P1). Media were then collected, centrifuged at 900 × g for 5 min, and supernatant fractions incubated with 70% ethanol. After centrifugation at 20,000 × g for 30 min, supernatant fractions were dried and then resuspended in 100% D2O. PPP flux was analyzed on the basis of the ratio of 13C incorporated into carbon 2 (glycolysis) and carbon 3 (PPP) of lactate determined by NMR using a Bruker Avance 400 MHz spectrometer. 1H-13C HSQC spectra were obtained using a Bruker Avance 400 MHz spectrometer. Spectra were processed on Bruker software TOPSPIN 3.1 applying a resolution enhancement by multiplication of the fids by a sinebell shifted function of p/2 and a polynomial baseline correction.
ROS evaluation
Thirty min before the end of the experimental time, cells were incubated with 50 µM H2DCF-DA at 37 °C. Cells were then washed, resuspended in ice-cold PBS, and collected. The fluorescence intensities of DCF, formed by the reaction of H2DCF with ROS, were analyzed cytofluorometrically by recording FL-1 fluorescence.
Measurement of 2-NBDG uptake
Thirty min before the end of the experimental time, cells were incubated with 100 µM 2-NBDG, a fluorescent derivative of 2-deoxy-D-glucose, washed with PBS, resuspended in ice-cold PBS, collected, and analyzed cytofluorometrically by recording FL-1 fluorescence.
Cell viability
The percentages of dead cells were evaluated by Trypan blue staining procedure.
Fluorescence microscopy analyses
Cells were fixed with 4% paraformaldehyde, permeabilized and incubated for one h with an anti-phospho-MAPK11/12/14 antibody and for one h with an Alexa Fluor 594 dye-conjugated secondary antibody (Life Technologies). For autophagy evaluation, cells expressing EGFP-LC3 were fixed with 4% paraformaldehyde and visualized by fluorescence microscopy. Images of cells were digitized with a Delta Vision Restoration Microscopy System (Applied Precision Inc., Issaquah, Washington, USA) equipped with an Olympus IX70 fluorescence microscope (Olympus Italia, Segrate [Milano], Italy).
Protein determination
Protein concentration was determined by the method of Lowry et al.56
Data analysis
Data were from at least 3 independent experiments, unless otherwise indicated. The results are presented as means ± SD. Statistical evaluation was conducted by using the unpaired 2-tailed Student t test. Comparisons were considered significant at P ≤ 0.05 and extremely statistically significant at P ≤ 0.01.
Supplementary Material
Disclosure of Potential Conflicts of Interest
No potential conflicts of interest were disclosed.
Acknowledgments
We thank Prof Jason A Chesney (University of Louisville) for his kind gift of fructose-2,6-bisphosphate and Dr Salvatore Rizza for his helpful assistance in real-time qPCR and site-directed mutagenesis experiments. This work was partially supported by grants from Associazione Italiana per la Ricerca sul Cancro (AIRC, IG 10636) and Ministero dell’Istruzione, dell’Università e della Ricerca (MIUR).
Glossary
Abbreviations:
- 2-NBDG
2-(N-[7-nitrobenz-2-oxa-1,3-diazol-4-yl]amino)-2-deoxyglucose
- APC/C
anaphase promoting complex/cyclosome
- ATG9
autophagy-related 9
- BNIP3
BCL2/adenovirus E1B 19 kDa interacting protein 3
- EBSS
Earle’s balanced salt solution
- EGFP
enhanced green fluorescent protein
- F1,6BP
fructose 1,6-bisphosphate
- F2,6BP
fructose 2,6-bisphosphate
- F6P
fructose 6-phosphate
- G6P
glucose-6-phosphate
- G6PD
glucose 6-phosphate dehydrogenase
- GAPDH
glyceraldehyde-3-phosphate dehydrogenase
- GPI
glucose-6-phosphate isomerase
- HIF1A
hypoxia inducible factor 1, alpha subunit (basic helix-loop-helix transcription factor)
- HKs
hexokinases
- MAP1LC3B
microtubule-associated protein 1 light chain 3 beta
- MAPKs
mitogen-activated protein kinases
- NAC
N-acetyl cysteine
- NADH
nicotinammide adenine dinucleotide reduced
- NADPH
nicotinammide adenine dinucleotide phosphate reduced
- OXPHOS
oxidative phosphorylation
- PFKL/M
phosphofructokinase, liver/muscle
- PFKFB1/2/3/4
6-phosphofructo-2-kinase/fructose 2,6-bisphosphatase 1/2/3/4
- PPP
pentose phosphate pathway
- ROS
reactive oxygen species
- SCF
SKP1-CUL1-F-box
- SIAH2
siah E3 ubiquitin protein ligase 2 (formerly termed 7 in absentia homolog 2)
- SLC2A1
solute carrier family 2 (facilitated glucose transporter), member 1
- SLC2A3
solute carrier family 2 (facilitated glucose transporter), member 3
- SQSTM1
sequestosome 1
- SUPT20H
suppressor of Ty 20 homolog (S. cerevisiae)
References
- 1.Warburg O. On the origin of cancer cells. Science. 1956;123:309–14. doi: 10.1126/science.123.3191.309. [DOI] [PubMed] [Google Scholar]
- 2.Vander Heiden MG, Cantley LC, Thompson CB. Understanding the Warburg effect: the metabolic requirements of cell proliferation. Science. 2009;324:1029–33. doi: 10.1126/science.1160809. [DOI] [PMC free article] [PubMed] [Google Scholar]
- 3.Gatenby RA, Gillies RJ. Why do cancers have high aerobic glycolysis? Nat Rev Cancer. 2004;4:891–9. doi: 10.1038/nrc1478. [DOI] [PubMed] [Google Scholar]
- 4.Osthus RC, Shim H, Kim S, Li Q, Reddy R, Mukherjee M, Xu Y, Wonsey D, Lee LA, Dang CV. Deregulation of glucose transporter 1 and glycolytic gene expression by c-Myc. J Biol Chem. 2000;275:21797–800. doi: 10.1074/jbc.C000023200. [DOI] [PubMed] [Google Scholar]
- 5.Barthel A, Okino ST, Liao J, Nakatani K, Li J, Whitlock JP, Jr., Roth RA. Regulation of GLUT1 gene transcription by the serine/threonine kinase Akt1. J Biol Chem. 1999;274:20281–6. doi: 10.1074/jbc.274.29.20281. [DOI] [PubMed] [Google Scholar]
- 6.Kawauchi K, Araki K, Tobiume K, Tanaka N. p53 regulates glucose metabolism through an IKK-NF-kappaB pathway and inhibits cell transformation. Nat Cell Biol. 2008;10:611–8. doi: 10.1038/ncb1724. [DOI] [PubMed] [Google Scholar]
- 7.Aparicio LM, Villaamil VM, Calvo MB, Rubira LV, Rois JM, Valladares-Ayerbes M, Campelo RG, Bolós MV, Pulido EG. Glucose transporter expression and the potential role of fructose in renal cell carcinoma: A correlation with pathological parameters. Mol Med Rep. 2010;3:575–80. doi: 10.3892/mmr_00000300. [DOI] [PubMed] [Google Scholar]
- 8.Krzeslak A, Wojcik-Krowiranda K, Forma E, Jozwiak P, Romanowicz H, Bienkiewicz A, Brys M. Expression of GLUT1 and GLUT3 glucose transporters in endometrial and breast cancers. Pathol Oncol Res. 2012;18:721–8. doi: 10.1007/s12253-012-9500-5. [DOI] [PMC free article] [PubMed] [Google Scholar]
- 9.Mor I, Cheung EC, Vousden KH. Control of glycolysis through regulation of PFK1: old friends and recent additions. Cold Spring Harb Symp Quant Biol. 2011;76:211–6. doi: 10.1101/sqb.2011.76.010868. [DOI] [PubMed] [Google Scholar]
- 10.Okar DA, Lange AJ. Fructose-2,6-bisphosphate and control of carbohydrate metabolism in eukaryotes. Biofactors. 1999;10:1–14. doi: 10.1002/biof.5520100101. [DOI] [PubMed] [Google Scholar]
- 11.Rider MH, Bertrand L, Vertommen D, Michels PA, Rousseau GG, Hue L. 6-phosphofructo-2-kinase/fructose-2,6-bisphosphatase: head-to-head with a bifunctional enzyme that controls glycolysis. Biochem J. 2004;381:561–79. doi: 10.1042/BJ20040752. [DOI] [PMC free article] [PubMed] [Google Scholar]
- 12.Chesney J. 6-phosphofructo-2-kinase/fructose-2,6-bisphosphatase and tumor cell glycolysis. Curr Opin Clin Nutr Metab Care. 2006;9:535–9. doi: 10.1097/01.mco.0000241661.15514.fb. [DOI] [PubMed] [Google Scholar]
- 13.Kessler R, Bleichert F, Warnke JP, Eschrich K. 6-Phosphofructo-2-kinase/fructose-2,6-bisphosphatase (PFKFB3) is up-regulated in high-grade astrocytomas. J Neurooncol. 2008;86:257–64. doi: 10.1007/s11060-007-9471-7. [DOI] [PubMed] [Google Scholar]
- 14.Chesney J, Mitchell R, Benigni F, Bacher M, Spiegel L, Al-Abed Y, Han JH, Metz C, Bucala R. An inducible gene product for 6-phosphofructo-2-kinase with an AU-rich instability element: role in tumor cell glycolysis and the Warburg effect. Proc Natl Acad Sci U S A. 1999;96:3047–52. doi: 10.1073/pnas.96.6.3047. [DOI] [PMC free article] [PubMed] [Google Scholar]
- 15.Tudzarova S, Colombo SL, Stoeber K, Carcamo S, Williams GH, Moncada S. Two ubiquitin ligases, APC/C-Cdh1 and SKP1-CUL1-F (SCF)-beta-TrCP, sequentially regulate glycolysis during the cell cycle. Proc Natl Acad Sci U S A. 2011;108:5278–83. doi: 10.1073/pnas.1102247108. [DOI] [PMC free article] [PubMed] [Google Scholar]
- 16.Herrero-Mendez A, Almeida A, Fernández E, Maestre C, Moncada S, Bolaños JP. The bioenergetic and antioxidant status of neurons is controlled by continuous degradation of a key glycolytic enzyme by APC/C-Cdh1. Nat Cell Biol. 2009;11:747–52. doi: 10.1038/ncb1881. [DOI] [PubMed] [Google Scholar]
- 17.Filomeni G, Rotilio G, Ciriolo MR. Disulfide relays and phosphorylative cascades: partners in redox-mediated signaling pathways. Cell Death Differ. 2005;12:1555–63. doi: 10.1038/sj.cdd.4401754. [DOI] [PubMed] [Google Scholar]
- 18.Cargnello M, Roux PP. Activation and function of the MAPKs and their substrates, the MAPK-activated protein kinases. Microbiol Mol Biol Rev. 2011;75:50–83. doi: 10.1128/MMBR.00031-10. [DOI] [PMC free article] [PubMed] [Google Scholar]
- 19.Webber JL, Tooze SA. Coordinated regulation of autophagy by p38alpha MAPK through mAtg9 and p38IP. EMBO J. 2010;29:27–40. doi: 10.1038/emboj.2009.321. [DOI] [PMC free article] [PubMed] [Google Scholar]
- 20.Keil E, Höcker R, Schuster M, Essmann F, Ueffing N, Hoffman B, Liebermann DA, Pfeffer K, Schulze-Osthoff K, Schmitz I. Phosphorylation of Atg5 by the Gadd45β-MEKK4-p38 pathway inhibits autophagy. Cell Death Differ. 2013;20:321–32. doi: 10.1038/cdd.2012.129. [DOI] [PMC free article] [PubMed] [Google Scholar]
- 21.Xu P, Das M, Reilly J, Davis RJ. JNK regulates FoxO-dependent autophagy in neurons. Genes Dev. 2011;25:310–22. doi: 10.1101/gad.1984311. [DOI] [PMC free article] [PubMed] [Google Scholar]
- 22.Wei Y, Pattingre S, Sinha S, Bassik M, Levine B. JNK1-mediated phosphorylation of Bcl-2 regulates starvation-induced autophagy. Mol Cell. 2008;30:678–88. doi: 10.1016/j.molcel.2008.06.001. [DOI] [PMC free article] [PubMed] [Google Scholar]
- 23.Wang Y, Wang JW, Xiao X, Shan Y, Xue B, Jiang G, He Q, Chen J, Xu HG, Zhao RX, et al. Piperlongumine induces autophagy by targeting p38 signaling. Cell Death Dis. 2013;4:e824. doi: 10.1038/cddis.2013.358. [DOI] [PMC free article] [PubMed] [Google Scholar]
- 24.Webber JL, Tooze SA. Coordinated regulation of autophagy by p38alpha MAPK through mAtg9 and p38IP. EMBO J. 2010;29:27–40. doi: 10.1038/emboj.2009.321. [DOI] [PMC free article] [PubMed] [Google Scholar]
- 25.Mizushima N, Komatsu M. Autophagy: renovation of cells and tissues. Cell. 2011;147:728–41. doi: 10.1016/j.cell.2011.10.026. [DOI] [PubMed] [Google Scholar]
- 26.Choi AM, Ryter SW, Levine B. Autophagy in human health and disease. N Engl J Med. 2013;368:651–62. doi: 10.1056/NEJMra1205406. [DOI] [PubMed] [Google Scholar]
- 27.Filomeni G, Desideri E, Cardaci S, Rotilio G, Ciriolo MR. Under the ROS…thiol network is the principal suspect for autophagy commitment. Autophagy. 2010;6:999–1005. doi: 10.4161/auto.6.7.12754. [DOI] [PubMed] [Google Scholar]
- 28.Scherz-Shouval R, Shvets E, Fass E, Shorer H, Gil L, Elazar Z. Reactive oxygen species are essential for autophagy and specifically regulate the activity of Atg4. EMBO J. 2007;26:1749–60. doi: 10.1038/sj.emboj.7601623. [DOI] [PMC free article] [PubMed] [Google Scholar]
- 29.Corcoran A, Cotter TG. Redox regulation of protein kinases. FEBS J. 2013;280:1944–65. doi: 10.1111/febs.12224. [DOI] [PubMed] [Google Scholar]
- 30.Trachootham D, Lu W, Ogasawara MA, Nilsa RD, Huang P. Redox regulation of cell survival. Antioxid Redox Signal. 2008;10:1343–74. doi: 10.1089/ars.2007.1957. [DOI] [PMC free article] [PubMed] [Google Scholar]
- 31.Cuenda A, Rousseau S. p38 MAP-kinases pathway regulation, function and role in human diseases. Biochim Biophys Acta. 2007;1773:1358–75. doi: 10.1016/j.bbamcr.2007.03.010. [DOI] [PubMed] [Google Scholar]
- 32.Mizushima N, Yoshimori T. How to interpret LC3 immunoblotting. Autophagy. 2007;3:542–5. doi: 10.4161/auto.4600. [DOI] [PubMed] [Google Scholar]
- 33.Baehrecke EH. Autophagy: dual roles in life and death? Nat Rev Mol Cell Biol. 2005;6:505–10. doi: 10.1038/nrm1666. [DOI] [PubMed] [Google Scholar]
- 34.Burant CF, Bell GI. Mammalian facilitative glucose transporters: evidence for similar substrate recognition sites in functionally monomeric proteins. Biochemistry. 1992;31:10414–20. doi: 10.1021/bi00157a032. [DOI] [PubMed] [Google Scholar]
- 35.Hirota K, Semenza GL. Rac1 activity is required for the activation of hypoxia-inducible factor 1. J Biol Chem. 2001;276:21166–72. doi: 10.1074/jbc.M100677200. [DOI] [PubMed] [Google Scholar]
- 36.Colombo SL, Palacios-Callender M, Frakich N, Carcamo S, Kovacs I, Tudzarova S, Moncada S. Molecular basis for the differential use of glucose and glutamine in cell proliferation as revealed by synchronized HeLa cells. Proc Natl Acad Sci U S A. 2011;108:21069–74. doi: 10.1073/pnas.1117500108. [DOI] [PMC free article] [PubMed] [Google Scholar]
- 37.Dang CV. Links between metabolism and cancer. Genes Dev. 2012;26:877–90. doi: 10.1101/gad.189365.112. [DOI] [PMC free article] [PubMed] [Google Scholar]
- 38.Levine AJ, Puzio-Kuter AM. The control of the metabolic switch in cancers by oncogenes and tumor suppressor genes. Science. 2010;330:1340–4. doi: 10.1126/science.1193494. [DOI] [PubMed] [Google Scholar]
- 39.Caro-Maldonado A, Tait SW, Ramírez-Peinado S, Ricci JE, Fabregat I, Green DR, Muñoz-Pinedo C. Glucose deprivation induces an atypical form of apoptosis mediated by caspase-8 in Bax-, Bak-deficient cells. Cell Death Differ. 2010;17:1335–44. doi: 10.1038/cdd.2010.21. [DOI] [PubMed] [Google Scholar]
- 40.Qing G, Li B, Vu A, Skuli N, Walton ZE, Liu X, Mayes PA, Wise DR, Thompson CB, Maris JM, et al. ATF4 regulates MYC-mediated neuroblastoma cell death upon glutamine deprivation. Cancer Cell. 2012;22:631–44. doi: 10.1016/j.ccr.2012.09.021. [DOI] [PMC free article] [PubMed] [Google Scholar]
- 41.Tennant DA, Durán RV, Gottlieb E. Targeting metabolic transformation for cancer therapy. Nat Rev Cancer. 2010;10:267–77. doi: 10.1038/nrc2817. [DOI] [PubMed] [Google Scholar]
- 42.Cardaci S, Desideri E, Ciriolo MR. Targeting aerobic glycolysis: 3-bromopyruvate as a promising anticancer drug. J Bioenerg Biomembr. 2012;44:17–29. doi: 10.1007/s10863-012-9422-7. [DOI] [PubMed] [Google Scholar]
- 43.Simpson IA, Dwyer D, Malide D, Moley KH, Travis A, Vannucci SJ. The facilitative glucose transporter GLUT3: 20 years of distinction. Am J Physiol Endocrinol Metab. 2008;295:E242–53. doi: 10.1152/ajpendo.90388.2008. [DOI] [PMC free article] [PubMed] [Google Scholar]
- 44.Déry MA, Michaud MD, Richard DE. Hypoxia-inducible factor 1: regulation by hypoxic and non-hypoxic activators. Int J Biochem Cell Biol. 2005;37:535–40. doi: 10.1016/j.biocel.2004.08.012. [DOI] [PubMed] [Google Scholar]
- 45.Khurana A, Nakayama K, Williams S, Davis RJ, Mustelin T, Ronai Z. Regulation of the ring finger E3 ligase Siah2 by p38 MAPK. J Biol Chem. 2006;281:35316–26. doi: 10.1074/jbc.M606568200. [DOI] [PMC free article] [PubMed] [Google Scholar]
- 46.Nakayama K, Frew IJ, Hagensen M, Skals M, Habelhah H, Bhoumik A, Kadoya T, Erdjument-Bromage H, Tempst P, Frappell PB, et al. Siah2 regulates stability of prolyl-hydroxylases, controls HIF1alpha abundance, and modulates physiological responses to hypoxia. Cell. 2004;117:941–52. doi: 10.1016/j.cell.2004.06.001. [DOI] [PubMed] [Google Scholar]
- 47.Yalcin A, Clem BF, Simmons A, Lane A, Nelson K, Clem AL, Brock E, Siow D, Wattenberg B, Telang S, et al. Nuclear targeting of 6-phosphofructo-2-kinase (PFKFB3) increases proliferation via cyclin-dependent kinases. J Biol Chem. 2009;284:24223–32. doi: 10.1074/jbc.M109.016816. [DOI] [PMC free article] [PubMed] [Google Scholar]
- 48.Bensaad K, Cheung EC, Vousden KH. Modulation of intracellular ROS levels by TIGAR controls autophagy. EMBO J. 2009;28:3015–26. doi: 10.1038/emboj.2009.242. [DOI] [PMC free article] [PubMed] [Google Scholar]
- 49.Mannervik B. The enzymes of glutathione metabolism: an overview. Biochem Soc Trans. 1987;15:717–8. doi: 10.1042/bst0150717. [DOI] [PubMed] [Google Scholar]
- 50.Desideri E, Filomeni G, Ciriolo MR. Glutathione participates in the modulation of starvation-induced autophagy in carcinoma cells. Autophagy. 2012;8:1769–81. doi: 10.4161/auto.22037. [DOI] [PMC free article] [PubMed] [Google Scholar]
- 51.Paillas S, Causse A, Marzi L, de Medina P, Poirot M, Denis V, Vezzio-Vie N, Espert L, Arzouk H, Coquelle A, et al. MAPK14/p38α confers irinotecan resistance to TP53-defective cells by inducing survival autophagy. Autophagy. 2012;8:1098–112. doi: 10.4161/auto.20268. [DOI] [PMC free article] [PubMed] [Google Scholar]
- 52.de la Cruz-Morcillo MA, Valero ML, Callejas-Valera JL, Arias-González L, Melgar-Rojas P, Galán-Moya EM, García-Gil E, García-Cano J, Sánchez-Prieto R. P38MAPK is a major determinant of the balance between apoptosis and autophagy triggered by 5-fluorouracil: implication in resistance. Oncogene. 2012;31:1073–85. doi: 10.1038/onc.2011.321. [DOI] [PubMed] [Google Scholar]
- 53.Filomeni G, Cerchiaro G, Da Costa Ferreira AM, De Martino A, Pedersen JZ, Rotilio G, Ciriolo MR. Pro-apoptotic activity of novel Isatin-Schiff base copper(II) complexes depends on oxidative stress induction and organelle-selective damage. J Biol Chem. 2007;282:12010–21. doi: 10.1074/jbc.M610927200. [DOI] [PubMed] [Google Scholar]
- 54.Van Schaftingen E, Lederer B, Bartrons R, Hers HG. A kinetic study of pyrophosphate: fructose-6-phosphate phosphotransferase from potato tubers. Application to a microassay of fructose 2,6-bisphosphate. Eur J Biochem. 1982;129:191–5. doi: 10.1111/j.1432-1033.1982.tb07039.x. [DOI] [PubMed] [Google Scholar]
- 55.Mancuso A, Sharfstein ST, Tucker SN, Clark DS, Blanch HW. Examination of primary metabolic pathways in a murine hybridoma with carbon-13 nuclear magnetic resonance spectroscopy. Biotechnol Bioeng. 1994;44:563–85. doi: 10.1002/bit.260440504. [DOI] [PubMed] [Google Scholar]
- 56.Lowry OH, Rosebrough NJ, Farr AL, Randall RJ. Protein measurement with the Folin phenol reagent. J Biol Chem. 1951;193:265–75. [PubMed] [Google Scholar]
Associated Data
This section collects any data citations, data availability statements, or supplementary materials included in this article.