

SUMMARY
Obese individuals exhibit an increase in pancreatic β-cell mass; conversely, scarce nutrition during pregnancy has been linked to β-cell insufficiency in the offspring (reviewed in [1, 2]). These phenomena are thought to be mediated mainly through effects on β-cell proliferation, since a nutrient sensitive β-cell progenitor population in the pancreas has not been identified. Here, we employed the FUCCI (Fluorescent Ubiquitination-based Cell Cycle Indicator) system to investigate β-cell replication in real-time, and found that high nutrient concentrations induce rapid β-cell proliferation. Importantly, we found that high nutrient concentrations also stimulate β-cell differentiation from progenitors in the intrapancreatic duct (IPD). Using a new zebrafish line where β-cells are constitutively ablated, we further show that β-cell loss and high nutrient intake synergistically activate these progenitors. At the cellular level, this activation process causes ductal cell reorganization as it stimulates their proliferation and differentiation. Notably, we link the nutrient-dependent activation of these progenitors to a down-regulation of Notch signaling specifically within the IPD. Furthermore, we show that the nutrient sensor mechanistic Target Of Rapamycin (mTOR) is required for endocrine differentiation from the IPD under physiological conditions as well as in the diabetic state. This study thus reveals critical insights into how cells modulate their plasticity in response to metabolic cues and identifies nutrient sensitive progenitors in the mature pancreas.
RESULTS AND DISCUSSION
β-cell mass increases in response to increased feeding
There is a tight correlation between nutrient intake and β-cell mass in nondiabetic obese individuals (reviewed in [1, 3]) and experimental models of over-nutrition [4, 5]. Whether nutritional cues impinge on the renewal and differentiation of β-cell progenitors remains to be investigated. In mouse, β-cell progenitors are found in the embryonic pancreatic ducts [6-8]. Analogously, in zebrafish, β-cells arise from epithelial cells lining the IPD [9, 10]. A unique advantage of the zebrafish model is the ability to visualize these ductal progenitors in vivo [9, 11]. To explore nutritional control of β-cell progenitors, we analyzed β-cell mass dynamics during two major metabolic transitions. First, by 5 days postfertilization (dpf) (Figure 1A), larvae deplete nutrients stored in the yolk, and transition into a feeding state. Second, between 15 and 16dpf, larvae are switched to a high-calorie diet and grow rapidly until late juvenile stages (45dpf) (Figure 1B) [12]. To characterize β-cell mass responses during these transitions, we examined Tg(TP1:H2BmCherry);Tg(ins:GFP) animals. Tg(TP1:H2BmCherry) drives H2BmCherry expression in Notch responsive cells (NRCs) in the IPD [9]. Since H2BmCherry has a long half-life, this transgenic combination allows the in vivo monitoring of NRC to β-cell differentiation (Figure 1C). This differentiation forms secondary islets (SIs) along the IPD [9, 11]. Intriguingly, we observed a dramatic increase in SI number and principal islet (PI) size after switching to a high-calorie diet at 15dpf (Figures 1D-1G). The new SIs were vascularized and individual β-cells appeared to establish contact with blood vessels (Figures S1A and S1B), suggesting that they contribute to the functional β-cell mass.
Figure 1. β-cells transition from quiescence to proliferation in response to nutrients.
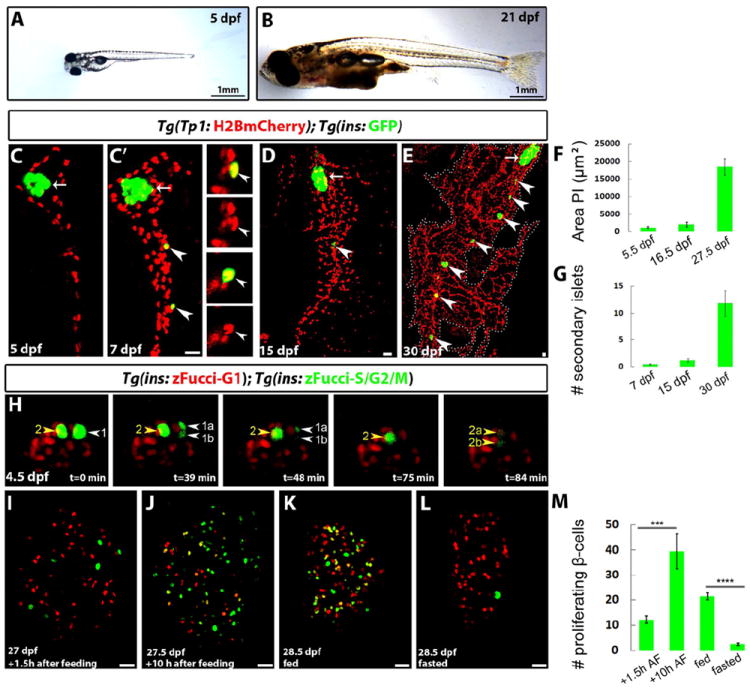
(A-B) Wild-type (WT) animals imaged at 5 (A) and 21 (B) dpf showing the dramatic growth that takes place in the feeding animal. (C-E) Tg(TP1:H2BmCherry);Tg(ins:GFP) larvae were examined using confocal imaging. Tg(TP1:H2BmCherry) drives expression of H2BmCherry in NRCs in the IPD and Tg(ins:GFP) labels β-cells. Arrows point to the principal islet (PI). Arrowheads point to secondary islets (SI). (C-C’) The larva was imaged live at 5 (C) and at 7 (C’) dpf. At 7dpf, two new β-cells (arrowheads) have formed posterior to the PI. These cells derived from NRCs as they are also Tg(Tp1bglob:H2BmCherry)+. The insets show single planes with separated channels. At 7dpf, 0.45 (±0.6, n=21 larvae) β-cell containing SIs per larva were present posterior to the PI. (D) At 15dpf, this number was 1.2 (±1.3, n=21 larvae). (E) At 30dpf, there was a dramatic increase in the number of β-cells, which clustered in multiple SIs (11.8±5.7 SI per animal, n=6 animals). The pancreas is outlined by a dashed line. (F) Quantification of the PI’s area at 5.5, 16.5 and 27.5dpf, showing a dramatic increase in its size between 16.5 and 27.5dpf (n=6 animals at 5.5 and 16.5dpf; 5 animals at 27.5dpf). (G) Quantification of the number of Tg(ins:GFP)+ SIs at 7, 15 and 30dpf, showing a dramatic increase between 15 and 30dpf (n=22 animals at 7 and 15dpf; 6 animals at 30dpf). (H) Live imaging of a Tg(ins:zFucci-G1);Tg(ins:zFucci-S/G2/M) larva at 4.5dpf. A projection of the stack is shown. Two Tg(ins:zFucci-S/G2/M)+ β-cells (arrowheads) were present in the PI at t=0 min. Both cells (1 and 2) divided during the course of the imaging, resulting in the downregulation, and subsequent loss of Tg(ins:zFucci-S/G2/M) expression in their daughter cells (1a,b and 2a,b). (I-L) Tg(ins:zFucci-G1);Tg(ins:zFucci-S/G2/M) animals were used to examine the effects of nutrients on β-cell proliferation; single confocal planes through the PI. (I-J) Animals from the same clutch were fixed at 1.5h (I) or 10h (J) after feeding (AF) starting at 27dpf. Several β-cells (12.2±4.3 β-cells, n=9 animals) were proliferating 1.5h AF. (J) The number of proliferating β-cells increased at 10h AF (39±23 β-cells, n=11 animals) (***p<0.005). (K) The animals were fed regularly and examined at 28.5dpf (12h after feeding). Numerous β-cells in the PI were proliferating (21±23 β-cells, n=7 animals). (L) Animals from the same clutch as in K were deprived of food for 28 h, and examined at 28.5dpf. The number of proliferating β-cells in the PI was dramatically reduced (2.5±2.2 β-cells, n=14 animals) (****p<0.0001). (M) Quantification of the average number of proliferating β-cells in the PI for the experiments shown in I-L. A,B and H are lateral views, anterior to the left, dorsal to the top. C and D are lateral views, anterior to the top, dorsal to the left. E, I-L are dorsal views, anterior to the top. Error bars = s.e.m. Scale bars, 20 μm. See also Figure S1.
β-cells transition from quiescence to proliferation in response to nutrients
This rapid β-cell mass increase after switching to a high-calorie diet suggests that increased nutrient intake stimulates β-cell proliferation and/or differentiation. To determine the role of proliferation, we developed transgenics using the FUCCI system for real-time quantification of proliferation [13, 14]. We placed (zFucci-G1) and (zFucci-S/G2/M) under the insulin promoter for β-cell specific expression (Figure S1C). At 4.5dpf, Tg(ins:zFucci-G1) expression labeled the majority of β-cells in the PI, whereas Tg(ins:zFucci-S/G2/M) expression labeled rare cells (Figures 1H and S1C). To assess this system’s dynamics, we performed live imaging at 4.5dpf. Tg(ins:zFucci-S/G2/M) labeling disappeared shortly after mitosis (Figure 1H), indicating precise labeling of proliferating β-cells. To validate this system further, we performed 5-ethynyl-2’-deoxyuridine (EdU) analyses at 30dpf. Strikingly, the vast majority of Tg(ins:zFucci-S/G2/M) single positive cells (90±12%, n=9 animals) were also EdU+ whereas a minor fraction of Tg(ins:zFucci-S/G2/M);Tg(ins:zFucci-G1) double positive cells had incorporated low levels of EdU (Figures S1D-S1F). These double positive cells are likely in a very early stage of S-phase. For precision, we only scored Tg(ins:zFucci-S/G2/M) single positive cells as proliferating β-cells. Notably, after the switch to a high-calorie diet at 15dpf, β-cell proliferation increased throughout the day, peaking 10-12h after the first feeding (Figures 1I-1J). Furthermore, β-cells in SIs also exhibited high proliferation (Figure S1G). To test whether this β-cell proliferation was stimulated by nutrients, we deprived animals of food for 28h. Fasting dramatically reduced the number of proliferating β-cells (2.5±2.16 cells per PI, n=11 islets) (Figures 1L and 1M) compared to controls (21.4±4 cells, n=7 islets) (Figures 1K and 1M). The effects of fasting were reversible, as β-cells re-entered the cell cycle upon re-feeding (data not shown). This nutrient-driven β-cell proliferation was also observed at earlier time points after switching to a high-calorie diet (Figures S1H and S1I). Thus, β-cell mass expansion is dynamically regulated by nutritional intake.
Nutrients enhance β-cell differentiation from the IPD
Proliferation alone does not explain the increase in the number of SIs, and thus nutrients may also induce β-cell differentiation. We first analyzed whether β-cells in an SI originate from the differentiation of a single, rare IPD cell, followed by clonal expansion, or whether they derive from multiple IPD cells. This question is important because in mouse, IPD cells appear to lose progenitor potential around birth [6-8]. A tamoxifen inducible Cre recombinase was placed under the control of the Notch responsive element (TP1) - Tg(TP1:CreERT2). Using the ubiquitous reporter, Tg(ubi:Switch) [15], and 2F11 immunofluorescence, which marks IPD cells [16], we observed that 4-Hydroxytamoxifen (4-OHT) treatment at 14dpf mosaically labeled IPD cells by 17dpf (Figures 2A, S2A, and S2B). Next, we used Tg(TP1:CreERT2) in combination with the Tg(insulin:Switch) reporter [17]. In this combination, β-cells that originate from IPD cells containing Tg(TP1:CreERT2) activity exhibit H2BGFP expression instead of mCherry. In a single progenitor scenario and under limiting 4-OHT treatments, each SI would be composed of H2BGFP+ or mCherry+ cells. In a multiple progenitor scenario, SIs would be mosaic, containing both H2BGFP+ and mCherry+ cells (Figure 2B). Thus, we treated larvae with 4-OHT at 16dpf and analyzed pancreata at 35-40dpf. The lineage traced cells contributed to mosaic SIs (Figure 2C) with up to 3 discrete H2BGFP+ cells per SI (Figure 2D), indicating that multiple IPD cells contribute to an individual SI. We did not detect H2BGFP+ cells in the SIs two days after the 4-OHT pulse (Figure S2C), indicating that H2BGFP+ cells originated from neogenesis rather than from preexisting β-cells that had retained CreERT2 activity. Moreover, adding 4-OHT before SIs form (2.5dpf), also led to mosaic SI labeling at 32dpf (Figure S2D), supporting the multiclonality of β-cells in SIs, consistent with the polyclonality of mouse [18-20] and human [21] islets. Within the PI, we observed groups of H2BGFP+ cells (8±3.4 cells per group, n=7 groups) (Figure 2E), suggesting that individual NRCs differentiated into β-cells and then underwent several amplification rounds. We also detected H2BGFP+ cells in proximity to SIs (Figure 2F). Subsequent analyses using Tg(TP1:H2BmCherry);Tg(ins:GFP) revealed newly differentiated β-cells approaching an SI via directed migration (Figure 2G). To directly test the involvement of nutrients in β-cell differentiation, we compared the number of SIs in animals that were switched to a high-calorie diet versus siblings maintained on a low-calorie diet between 15 to 20dpf, (Figures 2H and 2I). The restricted diet significantly reduced the formation of new SIs (Figure 2J), indicating that high nutrients induce β-cell differentiation.
Figure 2. Nutrients regulate β-cell differentiation.
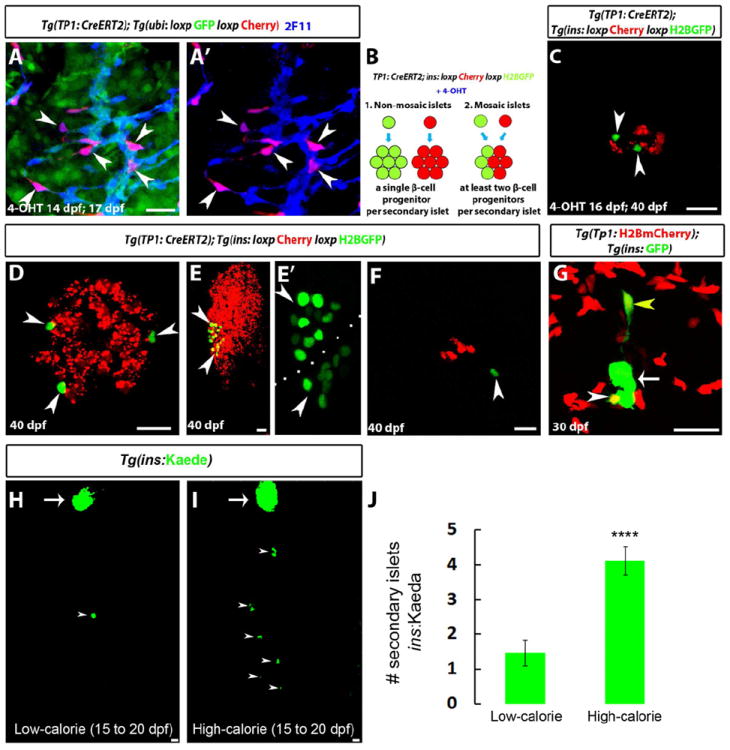
(A) Tg(TP1:CreERT2);Tg(ubi3C:loxp-GFP-loxp:mCherry) larvae were treated with 4-OHT at 14dpf for 16 h, fixed at 17dpf, and stained for 2F11 to mark IPD cells. 4-OHT treatment resulted in the mosaic labeling of individual IPD cells (mCherry+;GFP- cells) (arrowheads). (B) Experimental setup for the lineage tracing of β-cells from IPD cells. Tg(insulin:loxP:mCherry-STOP:loxP:H2BGFP)+ β-cells that originated from IPD cells with Tg(TP1:CreERT2) activity exhibit H2BGFP expression instead of mCherry. In a single progenitor scenario (1), each SI would be composed of H2BGFP+ or mCherry+ cells, whereas in a multiple progenitor scenario (2), SIs would be mosaic, containing both H2BGFP+ and mCherry+ cells. (C-F) Tg(TP1:CreERT2);Tg(insulin:loxP:mCherry-STOP:loxP:H2BGFP) larvae treated with limiting concentrations of 4-OHT at 16dpf for 16h and analyzed at 40dpf. (C) A mosaic SI composed of H2BGFP+ (arrowheads) and mCherry+ β-cells. (D) Three individual H2BGFP+ β-cells (arrowheads) located in the periphery of a SI suggesting that they have originated from three different IPD cells. (E) A PI showing two peripheral H2BGFP+ groups of β-cells (arrowheads), indicating several cell cycles after differentiation. (F) A single H2BGFP+ β-cell (arrowhead) in proximity to an SI. 15 of 20 animals treated with 4-OHT contained lineage traced cells, whereas no lineage traced cells were observed in vehicle-treated controls (n=7 animals, 80 SIs and 7 PIs). (G) Tg(TP1:H2BmCherry);Tg(ins:GFP) animals were examined at 30dpf. A projection of several planes shows an SI (arrow). The white arrowhead points to a single β-cell in the periphery of the SI. The yellow arrowhead points to a single β-cell outside the SI, extending a long cellular process towards it. Both of these β-cells exhibit higher levels of Tg(TP1:H2BmCherry) fluorescence compared to the rest of the β-cells in the SI, suggesting that they recently differentiated and did not undergo proliferation. (H-I) Tg(ins:Kaede) animals were maintained on a low-calorie diet until 20dpf (H) or switched to a high-calorie diet (I) from 15 to 20dpf (see Experimental Procedures). Whereas there is only a single Tg(ins:Kaede)+ SI (arrowhead) posterior to the PI (arrow) in H, multiple SIs (arrowheads) have formed in I. (J) Quantification of the number of SIs posterior to the PI (n=17 animals for each group). The high-calorie diet induced the formation of more SIs compared to the low-calorie diet (****p<0.0001). Error bars = s.e.m. Scale bars, 20 μm. See also Figure S2.
IPD cells exhibit a strong regenerative response to β-cell ablation under feeding
Whether IPD cells can increase their endocrine differentiation rate after a selective β-cell loss as well as the metabolic control of such a response, remain unknown. To address these questions, we employed a transgenic system in which β-cells express the cell-lethal Diptheria Toxin α-chain (DTA) [22] under the control of the insulin promoter, leading to complete ablation without a bystander effect (Hesselson et al., in preparation). Conditional β-cell ablation is achieved by Tg(ins:Cre) mediated excision of the BFP cassette from the floxed ins:loxp:BFPloxp:DTA transgene. In the absence of β-cells, the PI core was occupied by α-cells (Figures S3A and S3B).
We examined β-cell ablated animals under fasting metabolism (5 to 6dpf) [23] and during feeding (15 to 21dpf). At 5dpf, they are viable and exhibit a slight body length reduction compared to WT (WT=3.7±0.11mm; β-cell ablated animals=3.5±0.09mm, n=12 animals per group, p<0.0001). To monitor IPD endocrine lineage differentiation, we used Tg(TP1:H2BmCherry) in combination with the pan-endocrine marker Tg(neuroD:GFP). Quantification of the number of Tg(neuroD:GFP)+ SIs revealed no differences in endocrine differentiation in β-cell ablated animals by 6.5dpf (Figures 3A, 3B, and 3E).
Figure 3. β-cell ablation triggers a regenerative response in the IPD via Notch signaling.
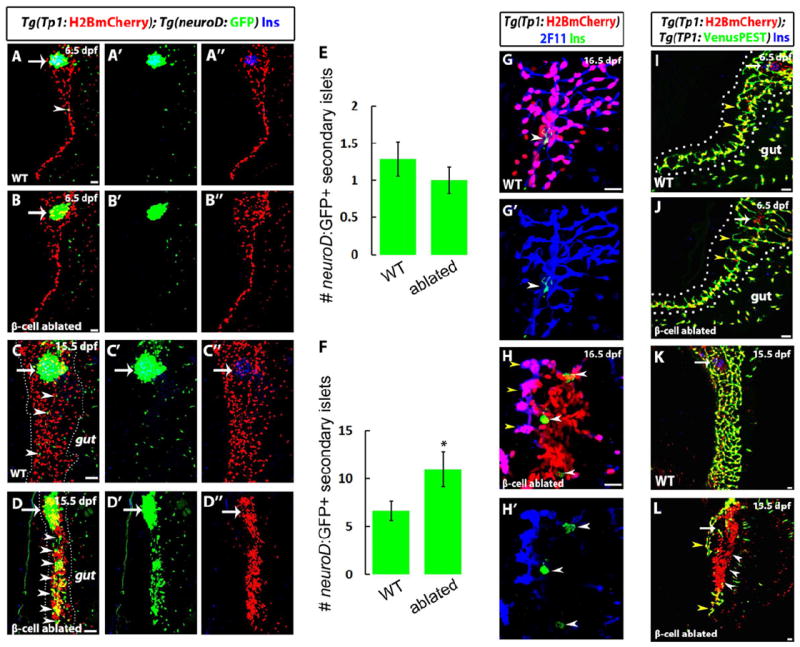
(A-D) Confocal micrographs of WT and β-cell ablated animals at the indicated stages. β-cells are marked by Insulin immunoreactivity (blue). Tg(TP1:H2BmCherry) expression labels pancreatic NRCs in the IPD and Tg(neuroD:GFP) expression marks endocrine cells and their direct precursors. Arrows point to the PI; arrowheads to SIs. (A-B) At 6.5dpf, and in the absence of external nutrition, the β-cell ablated animals (B) do not exhibit any visible phenotype in the IPD or in the differentiation of NRCs into endocrine cells compared to WT (A) (n = more than 30 animals each). (C-D) Confocal micrographs of WT and β-cell ablated animals at 15.5dpf, under external nutrition. At this stage, in WT (C), the pancreatic NRCs have expanded in numbers, and their nuclei are clearly separated. In contrast, β-cell ablated animals exhibit a dramatic clustering of the NRCs, as well as an increase in the number of SIs composed of Tg(neuroD:GFP)+ cells. (E) Quantification of the number of SIs for WT (n = 24) and β-cell ablated (n = 33) animals at 6.5dpf. (F) Quantification of the number of SIs for WT (n = 12) and β-cell ablated (n = 34) animals at 16.5dpf. Overall, β-cell ablated animals exhibit a significant increase in the number of SIs (*p=0.014) compared to WT. (G-H) Confocal micrographs of the pancreatic tails of WT (G) and β-cell ablated animals (H) at 16.5dpf. β-cells are marked by Insulin immunoreactivity (green). 2F11 immunoreactivity (blue) marks IPD cells. Whereas in WT, the vast majority of Tg(TP1:H2BmCherry)+ NRCs exhibit 2F11 immunoreactivity and form part of the ductal network, in β-cell ablated animals, a large proportion of the Tg(TP1:H2BmCherry)+ NRCs have lost 2F11 immunoreactivity as well as ductal organization. Some of these NRCs exhibit Insulin immunoreactivity (white arrowheads) indicating an attempted β-cell regeneration. Only a few of the Tg(TP1:H2BmCherry)+ cells maintain high 2F11 immunoreactivity (yellow arrowheads). (I-L) Tg(TP1:VenusPEST) which expresses a fluorescent protein with a short half-life under a Notch responsive element (TP1), was used to determine the levels of Notch signaling in WT and β-cell ablated animals at the indicated stages. Arrows point to the PI. (I-J) At 6.5dpf, in both WT (I) and β-cell ablated (J) animals, the IPD cells maintain active Notch signaling and are double positive for Tg(TP1:H2BmCherry) and Tg(TP1:VenusPEST) expression. Note that in both cases, the IPD cells exhibit branching morphogenesis (yellow arrowheads). (K-L) At 15.5dpf, in contrast to WT (K), where a majority of IPD cells maintain active Notch signaling, β-cell ablated animals (L) exhibit a strong reduction and even a loss of Notch signaling in the IPD, as indicated by the presence of numerous Tg(TP1:H2BmCherry)+ but Tg(TP1:VenusPEST)- cells (white arrowheads). Only some cells with active Notch signaling are present (yellow arrowheads). All panels show lateral views, anterior to the top, dorsal to the left. Error bars = s.e.m. Scale bars, 20 μm. See also Figure S3.
Under external nutrition (16.5dpf), β-cell ablated animals feed actively, as indicated by the presence of food in their intestinal tract (Figure S3C), and do not exhibit lethality (1 out of 20) compared to controls (2 out of 20). However, they exhibit a significant growth retardation (Figures S3C and S3D), suggesting that insulin stimulates growth in zebrafish, as it does in humans [24, 25]. In addition, β-cell ablated animals exhibited higher free glucose levels (9.85±2.2 pmol/μg, n=6 animals) compared to unablated siblings (3.64±0.31 pmol/μg, n=3 animals) (p<0.001). Strikingly, by 15.5 and 16.5dpf, β-cell ablated animals presented excessive numbers of ectopic Tg(neuroD:GFP)+ cells in the pancreatic tail (Figures 3C,3D,3F, and S3E-S3G). A majority of Tg(neuroD:GFP)+ cells also exhibited Tg(TP1:H2BmCherry) expression, indicating differentiation from pancreatic NRCs (Figure S3G). By 21dpf, the ectopic Tg(neuroD:GFP)+ cells gave rise to hormone-producing endocrine cells, including Glucagon+ cells (Figures S3H and S3I). In addition, at 16.5dpf, we observed discrete β-cells which had clearly differentiated from NRCs (Figures 3H and S3G). This enhanced endocrine differentiation was accompanied by cell clustering and reduced branching of the IPD (Figure 3H), as well as a loss of duct cell markers, including 2F11 immunofluorescence (Figures 3G and 3H). Using EdU analysis at 20.5dpf, we also found an increase in NRC replication from 8.8% in WT (±2.86, n=9 animals) to 22.9% (±5.45, n=9 animals) in β-cell ablated animals exhibiting IPD clustering (Figures S3J-S3L). To test whether feeding at earlier stages could stimulate endocrine differentiation, we counted SIs after feeding from 5 to 6.5dpf. This short feeding did not significantly increase the number of SIs in β-cell ablated animals (1.4±1.13 SIs, n=13 animals) compared to WT (1.28±1.05 SIs, n=21 animals) (p>0.5). Thus, only under sustained feeding does the lack of β-cells trigger a strong regenerative response in β-cell progenitors, stimulating their proliferation and endocrine lineage differentiation.
IPD cells lose Notch signaling in the absence of β-cells
The IPD phenotypes in β-cell ablated animals, including endocrine cell differentiation and increased proliferation, resemble those of animals with impaired Notch signaling during early larval stages [9]. Therefore, we examined Notch signaling levels using the previously validated Tg(TP1:H2BmCherry);Tg(TP1:VenusPEST) transgenic system [9]. Cells with active Notch signaling are double-positive for H2BmCherry and VenusPEST, whereas cells that recently lost Notch signaling lack VenusPEST because of its short half-life. At 6.5dpf, a majority of IPD cells in WT exhibit active Notch signaling (Figure 3I). Similarly, under fasting conditions at 6.5dpf, the IPD cells in β-cell ablated animals exhibit active Notch signaling (Figure 3J), consistent with a lack of response of NRCs to β-cell ablation in the absence of feeding. In contrast, at 15.5dpf, β-cell ablated, fed animals exhibited strong downregulation of Notch signaling in the IPD (Figures 3K and 3L). This downregulation was IPD-specific, as other tissues, including the intrahepatic duct and brain, did not downregulate Tg(TP1:VenusPEST) expression (Figures S3M, S3N, and data not shown). We further examined direct effects of Notch signaling downregulation on the IPD during feeding stages. Treating WT animals with the γ-secretase inhibitor (GSI) LY411575 [26] from 15 to 18dpf increased β-cell number along the IPD (Figures S3O-S3Q), showing that after Notch signaling downregulation, some IPD cells can differentiate into mature endocrine cells, even at these late stages. GSI-treatment also caused clustering of NRCs, as observed in β-cell ablated animals (Figures S3R and S3S). Together, these data suggest that in β-cell ablated animals, nutrient intake triggers Notch signaling downregulation in the IPD, leading to progenitor activation. Interestingly, Notch signaling levels were reduced in the IPD of WT animals switched to a high-calorie diet compared to those that were maintained on a low-calorie diet between 15 and 20dpf (data not shown), indicating that nutrients also modulate Notch signaling under physiological conditions.
Nutrients and TOR signaling are required for the regenerative response of the IPD
We classified the phenotypes of β-cell ablated animals based on the severity of IPD disorganization and extent of endocrine differentiation (Figures 4A-4E). At 16.5dpf, 10 out of 34 β-cell ablated animals (29%) exhibited excessive clustering of the IPD, while also having the highest numbers of ectopic endocrine cells (Figures 4D-4F), whereas at 21.5dpf, 10 out of 18 animals (56%) exhibited this severe phenotype, suggesting increased penetrance under sustained β-cell demand. At 16.5dpf, we detected rare and weakly Insulin+ cells in the PI; however their numbers did not correlate with the severity of the IPD phenotype. More intriguingly, animals exhibiting the most severe phenotypes were slightly but significantly larger (5.37±0.4 mm, n=10 animals) compared to the rest of the β-cell ablated animals (4.73±0.5 mm, n = 21 animals) (p<0.01). Assuming that growth reflects nutrient intake, these data suggest that higher nutrition in some animals exacerbated the effects of β-cell loss. In agreement, dietary restriction, achieved by a 24h feeding/fasting regimen from 6 to 16dpf, suppressed the IPD phenotypes of β-cell ablated animals (Figures 4G-4I).
Figure 4. High nutrient intake and TOR signaling are required to activate the regenerative response of IPD cells.
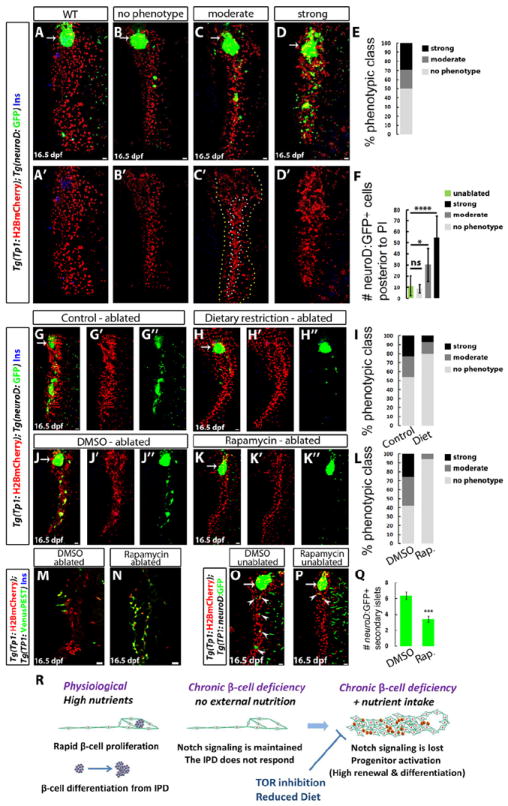
(A-D) WT (A) and β-cell ablated (B-D) animals at 16.5dpf. The phenotypes of β-cell ablated animals fall into several classes based on the degree of IPD disorganization and the extent of endocrine differentiation. (B) No phenotype; lack of IPD cell clustering and no increase in ectopic Tg(neuroD:GFP)+ cells posterior to the PI compared to WT (quantified in F). (C) Moderate phenotype; only some Tg(TP1:H2BmCherry)+ cells exhibit clustering (outlined by the white/inner dashed line in C’); whereas the rest (outlined by the yellow/outer dashed line in C’) appear unaffected. In these animals, the number of Tg(neuroD:GFP)+ cells posterior to the PI is significantly increased compared to WT (quantified in F). (D) Strong phenotype; complete clustering of the pancreatic NRCs and dramatic increase in Tg(neuroD:GFP)+ cells (quantified in F). (E) Distribution of phenotypic classes (no phenotype, 17 animals; moderate phenotype, 7 animals; strong phenotype, 10 animals). (F) Quantification of the number of Tg(neuroD:GFP)+ cells posterior to the PI for each phenotypic class (ns, not significant; *p<0.5; ****p<0.0001). (G-H) β-cell ablated animals reared under a normal feeding regimen (G) or a 24h feeding/fasting regimen (H) (6 to 16dpf). (I) Distribution of phenotypic classes for control (n=22) versus dietary restriction (n=15). The restricted diet suppressed the strong and moderate IPD phenotypes. (J-K) β-cell ablated animals treated with DMSO (J) or 50 nM Rapamycin (K) (8 to 16dpf). The DMSO-treated animals exhibit clustering of the pancreatic NRCs as well as numerous Tg(neuroD:GFP)+ cells in the pancreatic tail, whereas in Rapamycin-treated animals, the NRCs did not undergo clustering or endocrine differentiation. (L) Distribution of phenotypic classes for animals treated with DMSO (n=31) versus Rapamycin (n=16). Rapamycin-treatment strongly suppressed the phenotypes observed in β-cell ablated animals. (M-N) Tg(TP1:H2BmCherry); Tg(TP1:VenusPEST) β-cell ablated animals treated with DMSO (M) or 50 nM Rapamycin (N) (6 to 16dpf). 3 out of 10 DMSO-treated animals exhibited loss of Tg(TP1:VenusPEST) expression in the IPD, whereas in the Rapamycin-treated animals, Tg(TP1:VenusPEST) expression was maintained (n=15 animals). (O-P) WT animals treated with DMSO (O) or 50 nM Rapamycin (P) (6 to 16dpf). The DMSO-treated animal exhibits five Tg(neuroD:GFP)+ SIs (arrowheads) in its pancreatic tail, whereas the Rapamycin-treated one exhibits two SIs (arrowheads). (Q) Quantification of the number of SIs posterior to the PI for DMSO- and Rapamycin-treated WT animals (n=28 for DMSO; 27 for Rapamycin). Rapamycin reduced the formation of new SIs (***p<0.001). Error bars in F = s.d. Error bars in Q = s.e.m. All panels show lateral views, anterior to the top, dorsal to the left. Scale bars, 20 μm. (R) Under physiological conditions, high nutrient intake induces β-cell proliferation, as well as a progressive differentiation of new β-cells from the IPD. When the differentiated β-cells are ablated, the combination of β-cell deficiency and nutrient intake leads to Notch signaling downregulation in the IPD. The IPD cells undergo differentiation towards the endocrine lineages, as well as an increase in proliferation and loss of ductal characteristics. This process is nutrient dependent, as it requires high nutrient intake, and can be suppressed by a dietary restriction or TOR signaling downregulation. See also Figure S4.
Next, we aimed to identify pathways linking β-cell deficiency and nutrient dependent endocrine differentiation. We first tested whether increased glucose could stimulate endocrine differentiation. WT larvae were incubated in D-glucose from 3.5 to 7dpf, a treatment that increases glucose levels during larval stages [27]. D-glucose treatments increased NRC differentiation into endocrine cells, doubling the number of SIs (Figures S4A, S4B, and S4E). L–glucose, which cannot be utilized as a nutrient, had no effect on endocrine differentiation (n=28 animals). In addition, glucocorticoid-treatment, which increases glucose levels [23], mildly increased SI numbers (Figures S4C-S4E). These data further reveal progenitor sensitivity to nutritional cues, including glucose. We also analyzed the role of mTOR, a key intracellular sensor that couples nutrient abundance with cell growth and division across all eukaryotes [28]. To assess its role, β-cell ablated animals were treated from 8 to 16dpf with a low but effective dose of the mTOR inhibitor Rapamycin (50nM) [29]. Significantly, this treatment strongly suppressed the β-cell ablation phenotypes (Figures 4J-4L). Furthermore, it inhibited the loss of Notch signaling (Figures 4M and 4N), indicating that activation of IPD cell plasticity in response to nutrient catabolism requires mTOR activity. To analyze mTOR’s role in endocrine differentiation under physiological conditions, we counted SIs in WT animals treated with Rapamycin or DMSO. Rapamycin treatment significantly reduced the number of newly differentiated SIs, revealing the sensitivity of endocrine progenitors to mTOR activity (Figures 4O-4Q). In addition, PI size was reduced by 26% (2962±364 μm2) compared to controls (3985±730 μm2, n=10 animals per group, p<0.01), consistent with mTOR’s role in endocrine cell growth/proliferation [30, 31]. Importantly, phosphorylated RPS6 (p-RPS6) immunoreactivity, a readout of mTOR activity, was high in the pancreata of fed animals (Figures S4F and S4H) but low after fasting (Figures S4G and S4I), confirming that pancreatic mTOR signaling is responsive to nutrients.
TOR is required for expanding the progenitor pool in the IPD
To further assess pancreatic progenitor sensitivity to mTOR activity, we examined their development in a zebrafish mTOR mutant (mtorxu015Gt), which develops relatively normally until 7dpf but exhibits lethality by 10dpf [32]. In WT, the pancreatic NRCs proliferate between 2.5 and 5dpf and expand posteriorly to form the branched IPD (Figure S4J). In contrast, mtorxu015Gt homozygous mutants display a strong defect in NRC expansion leading to a reduced pool of NRCs and IPD branching defects by 5dpf (Figure S4K). These data reveal a critical requirement for mTOR in establishing the endocrine progenitor pool during development.
Concluding Remarks
Whereas the effects of glucose on β-cell proliferation have previously been described [33-36], we now identify nutrient-sensitive endocrine progenitors in the IPD. Furthermore, we show that β-cell deficiency and nutrients cooperate to enhance IPD plasticity and differentiation (Figure 4R). It is likely that in obesity, impaired β-cell function and higher nutrition synergistically regulate progenitor differentiation as well [37]. Indeed, mature pancreatic cell types in mouse, including duct cells [38], acinar cells [39], and α-cells [40] exhibit enhanced plasticity after pancreatic injury. We also show that enhancement of duct cell plasticity in response to β-cell loss requires the nutrient sensor mTOR, and that Notch signaling, a critical regulator of endocrine differentiation in the embryo [41], is under metabolic control in the mature pancreas. Notably, Notch signaling in human exocrine cells prevents their reprogramming [42]. Furthermore, Notch1 was implicated as a tumor suppressor in a mouse model of pancreatic ductal adenocarcinoma [43], and increased duct cell replication has been reported in Type 2 diabetics and obese patients [44], observations consistent with our data in zebrafish. It will be important to identify the metabolic effectors of duct cell plasticity as they could provide pharmacological means to enhance β-cell differentiation.
Supplementary Material
HIGHLIGHTS.
β-cells transition from quiescence to proliferation in response to nutrient intake.
Nutrient intake induces β-cell differentiation from progenitors in the pancreatic duct.
Constitutive β-cell ablation triggers a regenerative response in the pancreatic duct.
High nutrient intake and mTOR signaling are required to trigger this regenerative response.
Acknowledgments
We thank Ana Ayala and Milagritos Alva for expert assistance with the fish, Oliver Stone and Alethia Villasenor for critical reading of the manuscript, all members of the Stainier group and Amnon Schlegel for helpful discussions. We acknowledge the generosity of Christian Mosimann for providing Tg(ubi:Switch) and technical advice, Atsushi Miyawaki and Asako Sakaue-Sawano for providing cDNAs encoding zFucci-S/G2/M and zFucci-G1, and Xiaolei Xu for mtorxu015Gt. This work was supported by Post-Doctoral Fellowships from the Canadian Diabetes Association (N.N), Larry L. Hillblom Foundation (D.H.), and Juvenile Diabetes Research Foundation (D.H.) as well as grants from the NIH (R01 DK075032; U01 DK089541) and the Packard Foundation to D.Y.R.S.
Footnotes
Publisher's Disclaimer: This is a PDF file of an unedited manuscript that has been accepted for publication. As a service to our customers we are providing this early version of the manuscript. The manuscript will undergo copyediting, typesetting, and review of the resulting proof before it is published in its final citable form. Please note that during the production process errors may be discovered which could affect the content, and all legal disclaimers that apply to the journal pertain.
References
- 1.Bouwens L, Rooman I. Regulation of pancreatic beta-cell mass. Physiol Rev. 2005;85:1255–1270. doi: 10.1152/physrev.00025.2004. [DOI] [PubMed] [Google Scholar]
- 2.Le Clair C, Abbi T, Sandhu H, Tappia PS. Impact of maternal undernutrition on diabetes and cardiovascular disease risk in adult offspring. Canadian journal of physiology and pharmacology. 2009;87:161–179. doi: 10.1139/y09-006. [DOI] [PubMed] [Google Scholar]
- 3.Kloppel G, Lohr M, Habich K, Oberholzer M, Heitz PU. Islet pathology and the pathogenesis of type 1 and type 2 diabetes mellitus revisited. Survey and synthesis of pathology research. 1985;4:110–125. doi: 10.1159/000156969. [DOI] [PubMed] [Google Scholar]
- 4.Ahren J, Ahren B, Wierup N. Increased beta-cell volume in mice fed a high-fat diet: a dynamic study over 12 months. Islets. 2010;2:353–356. doi: 10.4161/isl.2.6.13619. [DOI] [PubMed] [Google Scholar]
- 5.Maddison LA, Chen W. Nutrient Excess Stimulates beta-Cell Neogenesis in Zebrafish. Diabetes. 2012;61:2517–2524. doi: 10.2337/db11-1841. [DOI] [PMC free article] [PubMed] [Google Scholar]
- 6.Kopinke D, Brailsford M, Shea JE, Leavitt R, Scaife CL, Murtaugh LC. Lineage tracing reveals the dynamic contribution of Hes1+ cells to the developing and adult pancreas. Development. 2011;138:431–441. doi: 10.1242/dev.053843. [DOI] [PMC free article] [PubMed] [Google Scholar]
- 7.Kopp JL, Dubois CL, Schaffer AE, Hao E, Shih HP, Seymour PA, Ma J, Sander M. Sox9+ ductal cells are multipotent progenitors throughout development but do not produce new endocrine cells in the normal or injured adult pancreas. Development. 2011;138:653–665. doi: 10.1242/dev.056499. [DOI] [PMC free article] [PubMed] [Google Scholar]
- 8.Solar M, Cardalda C, Houbracken I, Martin M, Maestro MA, De Medts N, Xu X, Grau V, Heimberg H, Bouwens L, et al. Pancreatic exocrine duct cells give rise to insulin-producing beta cells during embryogenesis but not after birth. Dev Cell. 2009;17:849–860. doi: 10.1016/j.devcel.2009.11.003. [DOI] [PubMed] [Google Scholar]
- 9.Ninov N, Borius M, Stainier DY. Different levels of Notch signaling regulate quiescence, renewal and differentiation in pancreatic endocrine progenitors. Development. 2012;139:1557–1567. doi: 10.1242/dev.076000. [DOI] [PMC free article] [PubMed] [Google Scholar]
- 10.Wang Y, Rovira M, Yusuff S, Parsons MJ. Genetic inducible fate mapping in larval zebrafish reveals origins of adult insulin-producing beta-cells. Development. 2011;138:609–617. doi: 10.1242/dev.059097. [DOI] [PMC free article] [PubMed] [Google Scholar]
- 11.Parsons MJ, Pisharath H, Yusuff S, Moore JC, Siekmann AF, Lawson N, Leach SD. Notch-responsive cells initiate the secondary transition in larval zebrafish pancreas. Mech Dev. 2009;126:898–912. doi: 10.1016/j.mod.2009.07.002. [DOI] [PMC free article] [PubMed] [Google Scholar]
- 12.Eaton RC, Farley RD. Growth and Reduction of Depensation of Zebrafish, Brachydanio-Rerio, Reared in Laboratory. Copeia. 1974:204–209. [Google Scholar]
- 13.Sugiyama M, Sakaue-Sawano A, Iimura T, Fukami K, Kitaguchi T, Kawakami K, Okamoto H, Higashijima S, Miyawaki A. Illuminating cell-cycle progression in the developing zebrafish embryo. Proc Natl Acad Sci U S A. 2009;106:20812–20817. doi: 10.1073/pnas.0906464106. [DOI] [PMC free article] [PubMed] [Google Scholar]
- 14.Sakaue-Sawano A, Kurokawa H, Morimura T, Hanyu A, Hama H, Osawa H, Kashiwagi S, Fukami K, Miyata T, Miyoshi H, et al. Visualizing spatiotemporal dynamics of multicellular cell-cycle progression. Cell. 2008;132:487–498. doi: 10.1016/j.cell.2007.12.033. [DOI] [PubMed] [Google Scholar]
- 15.Mosimann C, Kaufman CK, Li P, Pugach EK, Tamplin OJ, Zon LI. Ubiquitous transgene expression and Cre-based recombination driven by the ubiquitin promoter in zebrafish. Development. 2011;138:169–177. doi: 10.1242/dev.059345. [DOI] [PMC free article] [PubMed] [Google Scholar]
- 16.Dong PD, Munson CA, Norton W, Crosnier C, Pan X, Gong Z, Neumann CJ, Stainier DY. Fgf10 regulates hepatopancreatic ductal system patterning and differentiation. Nat Genet. 2007;39:397–402. doi: 10.1038/ng1961. [DOI] [PubMed] [Google Scholar]
- 17.Hesselson D, Anderson RM, Stainier DY. Suppression of Ptf1a activity induces acinar-to-endocrine conversion. Curr Biol. 2011;21:712–717. doi: 10.1016/j.cub.2011.03.041. [DOI] [PMC free article] [PubMed] [Google Scholar]
- 18.Desgraz R, Herrera PL. Pancreatic neurogenin 3-expressing cells are unipotent islet precursors. Development. 2009;136:3567–3574. doi: 10.1242/dev.039214. [DOI] [PMC free article] [PubMed] [Google Scholar]
- 19.Deltour L, Leduque P, Paldi A, Ripoche MA, Dubois P, Jami J. Polyclonal origin of pancreatic islets in aggregation mouse chimaeras. Development. 1991;112:1115–1121. doi: 10.1242/dev.112.4.1115. [DOI] [PubMed] [Google Scholar]
- 20.Swenson ES, Xanthopoulos J, Nottoli T, McGrath J, Theise ND, Krause DS. Chimeric mice reveal clonal development of pancreatic acini, but not islets. Biochemical and biophysical research communications. 2009;379:526–531. doi: 10.1016/j.bbrc.2008.12.104. [DOI] [PMC free article] [PubMed] [Google Scholar]
- 21.Scharfmann R, Xiao X, Heimberg H, Mallet J, Ravassard P. Beta cells within single human islets originate from multiple progenitors. PloS one. 2008;3:e3559. doi: 10.1371/journal.pone.0003559. [DOI] [PMC free article] [PubMed] [Google Scholar]
- 22.Herrera PL, Huarte J, Zufferey R, Nichols A, Mermillod B, Philippe J, Muniesa P, Sanvito F, Orci L, Vassalli JD. Ablation of islet endocrine cells by targeted expression of hormone-promoter-driven toxigenes. Proc Natl Acad Sci U S A. 1994;91:12999–13003. doi: 10.1073/pnas.91.26.12999. [DOI] [PMC free article] [PubMed] [Google Scholar]
- 23.Gut P, Baeza-Raja B, Andersson O, Hasenkamp L, Hsiao J, Hesselson D, Akassoglou K, Verdin E, Hirschey MD, Stainier DY. Whole-organism screening for gluconeogenesis identifies activators of fasting metabolism. Nature chemical biology. 2012;9:97–104. doi: 10.1038/nchembio.1136. [DOI] [PMC free article] [PubMed] [Google Scholar]
- 24.Garin I, Edghill EL, Akerman I, Rubio-Cabezas O, Rica I, Locke JM, Maestro MA, Alshaikh A, Bundak R, del Castillo G, et al. Recessive mutations in the INS gene result in neonatal diabetes through reduced insulin biosynthesis. Proc Natl Acad Sci U S A. 2010;107:3105–3110. doi: 10.1073/pnas.0910533107. [DOI] [PMC free article] [PubMed] [Google Scholar]
- 25.Wertheimer E, Lu SP, Backeljauw PF, Davenport ML, Taylor SI. Homozygous Deletion of the Human Insulin-Receptor Gene Results in Leprechaunism. Nat Genet. 1993;5:71–73. doi: 10.1038/ng0993-71. [DOI] [PubMed] [Google Scholar]
- 26.Fauq AH, Simpson K, Maharvi GM, Golde T, Das P. A multigram chemical synthesis of the gamma-secretase inhibitor LY411575 and its diastereoisomers. Bioorg Med Chem Lett. 2007;17:6392–6395. doi: 10.1016/j.bmcl.2007.07.062. [DOI] [PMC free article] [PubMed] [Google Scholar]
- 27.Powers JW, Mazilu JK, Lin S, McCabe ER. The effects of hyperglycemia on adrenal cortex function and steroidogenesis in the zebrafish. Molecular genetics and metabolism. 2010;101:421–422. doi: 10.1016/j.ymgme.2010.09.012. [DOI] [PubMed] [Google Scholar]
- 28.Zoncu R, Efeyan A, Sabatini DM. mTOR: from growth signal integration to cancer, diabetes and ageing. Nat Rev Mol Cell Biol. 2011;12:21–35. doi: 10.1038/nrm3025. [DOI] [PMC free article] [PubMed] [Google Scholar]
- 29.Goldsmith MI, Iovine MK, O’Reilly-Pol T, Johnson SL. A developmental transition in growth control during zebrafish caudal fin development. Dev Biol. 2006;296:450–457. doi: 10.1016/j.ydbio.2006.06.010. [DOI] [PubMed] [Google Scholar]
- 30.Rachdi L, Balcazar N, Osorio-Duque F, Elghazi L, Weiss A, Gould A, Chang-Chen KJ, Gambello MJ, Bernal-Mizrachi E. Disruption of Tsc2 in pancreatic beta cells induces beta cell mass expansion and improved glucose tolerance in a TORC1-dependent manner. Proc Natl Acad Sci U S A. 2008;105:9250–9255. doi: 10.1073/pnas.0803047105. [DOI] [PMC free article] [PubMed] [Google Scholar]
- 31.Balcazar N, Sathyamurthy A, Elghazi L, Gould A, Weiss A, Shiojima I, Walsh K, Bernal-Mizrachi E. mTORC1 activation regulates beta-cell mass and proliferation by modulation of cyclin D2 synthesis and stability. J Biol Chem. 2009;284:7832–7842. doi: 10.1074/jbc.M807458200. [DOI] [PMC free article] [PubMed] [Google Scholar]
- 32.Ding Y, Sun X, Huang W, Hoage T, Redfield M, Kushwaha S, Sivasubbu S, Lin X, Ekker S, Xu X. Haploinsufficiency of target of rapamycin attenuates cardiomyopathies in adult zebrafish. Circ Res. 2011;109:658–669. doi: 10.1161/CIRCRESAHA.111.248260. [DOI] [PMC free article] [PubMed] [Google Scholar]
- 33.Porat S, Weinberg-Corem N, Tornovsky-Babaey S, Schyr-Ben-Haroush R, Hija A, Stolovich-Rain M, Dadon D, Granot Z, Ben-Hur V, White P, et al. Control of pancreatic beta cell regeneration by glucose metabolism. Cell Metab. 2011;13:440–449. doi: 10.1016/j.cmet.2011.02.012. [DOI] [PMC free article] [PubMed] [Google Scholar]
- 34.Salpeter SJ, Klein AM, Huangfu D, Grimsby J, Dor Y. Glucose and aging control the quiescence period that follows pancreatic beta cell replication. Development. 2010;137:3205–3213. doi: 10.1242/dev.054304. [DOI] [PMC free article] [PubMed] [Google Scholar]
- 35.Salpeter SJ, Klochendler A, Weinberg-Corem N, Porat S, Granot Z, Shapiro AM, Magnuson MA, Eden A, Grimsby J, Glaser B, et al. Glucose regulates cyclin D2 expression in quiescent and replicating pancreatic beta-cells through glycolysis and calcium channels. Endocrinology. 2011;152:2589–2598. doi: 10.1210/en.2010-1372. [DOI] [PMC free article] [PubMed] [Google Scholar]
- 36.Dadon D, Tornovsky-Babaey S, Furth-Lavi J, Ben-Zvi D, Ziv O, Schyr-Ben-Haroush R, Stolovich-Rain M, Hija A, Porat S, Granot Z, et al. Glucose metabolism: key endogenous regulator of beta-cell replication and survival. Diabetes, obesity & metabolism. 2012;14(Suppl 3):101–108. doi: 10.1111/j.1463-1326.2012.01646.x. [DOI] [PubMed] [Google Scholar]
- 37.Bonner-Weir S, Toschi E, Inada A, Reitz P, Fonseca SY, Aye T, Sharma A. The pancreatic ductal epithelium serves as a potential pool of progenitor cells. Pediatr Diabetes. 2004;5(Suppl 2):16–22. doi: 10.1111/j.1399-543X.2004.00075.x. [DOI] [PubMed] [Google Scholar]
- 38.Xu X, D’Hoker J, Stange G, Bonne S, De Leu N, Xiao X, Van de Casteele M, Mellitzer G, Ling Z, Pipeleers D, et al. Beta cells can be generated from endogenous progenitors in injured adult mouse pancreas. Cell. 2008;132:197–207. doi: 10.1016/j.cell.2007.12.015. [DOI] [PubMed] [Google Scholar]
- 39.Pan FC, Bankaitis ED, Boyer D, Xu X, Van de Casteele M, Magnuson MA, Heimberg H, Wright CV. Spatiotemporal patterns of multipotentiality in Ptf1a-expressing cells during pancreas organogenesis and injury-induced facultative restoration. Development. 2013;140:751–764. doi: 10.1242/dev.090159. [DOI] [PMC free article] [PubMed] [Google Scholar]
- 40.Thorel F, Nepote V, Avril I, Kohno K, Desgraz R, Chera S, Herrera PL. Conversion of adult pancreatic alpha-cells to beta-cells after extreme beta-cell loss. Nature. 2010;464:1149–1154. doi: 10.1038/nature08894. [DOI] [PMC free article] [PubMed] [Google Scholar]
- 41.Apelqvist A, Li H, Sommer L, Beatus P, Anderson DJ, Honjo T, Hrabe de Angelis M, Lendahl U, Edlund H. Notch signalling controls pancreatic cell differentiation. Nature. 1999;400:877–881. doi: 10.1038/23716. [DOI] [PubMed] [Google Scholar]
- 42.Swales N, Martens GA, Bonne S, Heremans Y, Borup R, Van de Casteele M, Ling Z, Pipeleers D, Ravassard P, Nielsen F, et al. Plasticity of adult human pancreatic duct cells by neurogenin3-mediated reprogramming. PloS one. 2012;7:e37055. doi: 10.1371/journal.pone.0037055. [DOI] [PMC free article] [PubMed] [Google Scholar]
- 43.Hanlon L, Avila JL, Demarest RM, Troutman S, Allen M, Ratti F, Rustgi AK, Stanger BZ, Radtke F, Adsay V, et al. Notch1 functions as a tumor suppressor in a model of K-ras-induced pancreatic ductal adenocarcinoma. Cancer Res. 2010;70:4280–4286. doi: 10.1158/0008-5472.CAN-09-4645. [DOI] [PMC free article] [PubMed] [Google Scholar]
- 44.Butler AE, Galasso R, Matveyenko A, Rizza RA, Dry S, Butler PC. Pancreatic duct replication is increased with obesity and type 2 diabetes in humans. Diabetologia. 2010;53:21–26. doi: 10.1007/s00125-009-1556-8. [DOI] [PMC free article] [PubMed] [Google Scholar]
Associated Data
This section collects any data citations, data availability statements, or supplementary materials included in this article.