Abstract
Gout is a common inflammatory arthritis and is caused by accumulation of monosodium urate crystals in joints and soft tissues. Apart from joint damage, untreated gout is associated with cardiovascular and renal morbidity. Gout, whilst in principle considered to be well understood and simple to treat, often presents diagnostic and management challenges, with evidence to suggest that it is often inadequately treated and poor compliance is a major issue. Imaging tools can aid clinicians in establishing the correct diagnosis, when histological crystal diagnosis is unable to be established, and also assess the burden of inflammatory and structural disease. Imaging can also be used to monitor treatment response. The imaging techniques that currently have a role in the imaging of gout include conventional radiography, ultrasound, computed tomography, dual energy computed tomography, magnetic resonance imaging and nuclear medicine. Despite the lack of major technological advances in imaging of gout in recent years, scientific studies of existing imaging modalities have improved our understanding of the disease, and how to best utilize imaging techniques in the clinical setting.
Keywords: asymptomatic hyperuricemia, computed tomography, conventional radiography, dual energy computed tomography, erosions, magnetic resonance imaging, nuclear medicine, plane X-ray, tophus, ultrasound
Introduction
Gout is common, indeed the most common inflammatory arthritis in men [Richette and Bardin, 2010]. It is associated with mortality and significant morbidity. In addition to being a chronic deforming polyarthropathy, gout is associated with metabolic, cardiovascular and renal morbidity [Kim et al. 2003; Brook et al. 2006; Chen et al. 2007]. Gout is perhaps one of the best understood diseases in terms of aetiopathogenesis and effective treatments do exist. Despite this, the scientific evidence suggests that often patients and doctors do not understand the disease well [Pascual and Sivera, 2007]. Delays in establishing the diagnosis, commencing treatment, and targeting defined outcomes as well as poor compliance, contribute to suboptimal management of gout [Jackson et al. 2012; Riedel et al. 2004; Zhang et al. 2006b; Briesacher et al. 2008].
Gout results from the deposition of monosodium urate (MSU) crystals in joints and soft tissues when serum uric acid concentrations rise above the physiological saturation limit (approximately 380 µmol/liter or 6.4 mg/dl) [Choi et al. 2005]. The acute form of the arthritis is characterized by sudden onset, intense pain, swelling, warmth and erythema (the cardinal signs of inflammation). The great toe is characteristically affected, however almost all joints may be affected [Edwards, 2008]. The diagnosis is confirmed in acute gout by the presence of MSU crystals in the synovial fluid. Chronic tophaceous gout results from chronic hyperuricemia. Continued deposition of MSU crystals leads to increased frequency of acute attacks, progressive shortening of intercritical phase and development of tophi due to MSU deposition in soft tissues, bones and joints.
The gold standard for diagnosis of gout is demonstration of negatively birefringent, needle-shaped MSU crystals in tissue or synovial fluid by polarized microscopy [Wallace et al. 1977]. Obtaining a histological diagnosis is not always feasible, and whilst application of international consensus definitions may assist in the diagnosis of gout in the absence of a crystal diagnosis, at times a definitive clinical diagnosis can be difficult [Wallace et al. 1977; Zhang et al. 2006b].
The management of gout should be holistic, incorporating patient education, lifestyle advice, pharmacotherapy of acute gout, prophylaxis to prevent chronic tophaceous gout, identification and management of comorbidities such as metabolic syndrome and renal disease [Zhang et al. 2006a; Khanna et al. 2012]. International guidelines recommend that prior to treating gout, the diagnosis must be accurately established, and the burden of disease should also be assessed [Zhang et al. 2006a; Khanna et al. 2012]. Imaging may play a useful role in this, particularly when uric acid crystals are unable to be identified to confirm the diagnosis. Imaging can assist with assessing disease burden and structural damage. Imaging can also be useful to monitor disease progression or treatment response and to assess efficacy of treatment in clinical trials.
Imaging modalities that have clinical relevance in gout include conventional radiography (CR), ultrasonography (US), computed tomography (CT), dual energy computed tomography (DECT), magnetic resonance imaging (MRI) and nuclear medicine. Typically, imaging findings associated with joint inflammation are seen, as well as findings that are more specific to and even pathognomonic of gout. This manuscript aims to review imaging findings seen in gout, with a focus on recent developments. While there have been few recent technological imaging advances apart from DECT, application and understanding of the clinical utility of these imaging techniques in gout have been better understood, as has our understanding of the pathogenesis of gout.
Conventional radiography
CR has been the traditional imaging tool in the management of rheumatic disorders. During an acute attack of gout, soft tissue swelling and effusions may be seen by CR [Gentili, 2006], however these findings are nonspecific. The typical CR findings in chronic tophaceous gout, which differentiate it from other inflammatory arthritides, include well defined, ‘punched-out’ erosions with overhanging edges, soft tissue nodules (tophi), calcification of tophi and asymmetric involvement [Gentili, 2006] (Figure 1). The erosions are typically extra-articular, but may be intra-articular or para-articular [Gentili, 2006]. Tophi may be intraosseous or calcified. The joint space is usually preserved until late in the disease and there is lack of periarticular osteopenia. The most common site affected is the first metatarsophalangeal (MTP) joint, followed by the fifth MTP joint, midfoot and hand and wrist [Barthelemy et al. 1984]. These CR changes are relatively specific, with a diagnostic specificity of 93% using clinical diagnosis as the gold standard [Rettenbacher et al. 2008]. The diagnostic sensitivity is lower; 31% using clinical diagnosis as the gold standard [Rettenbacher et al. 2008]. This is particularly an issue in early disease, as radiographic changes may be delayed 10–15 years after the onset of gout [Barthelemy et al. 1984]. In the clinical setting, the low sensitivity of CR and the lag to developing radiographic changes means that CR has a limited role in the diagnosis or monitoring of this disease [Gentili, 2006].
Figure 1.
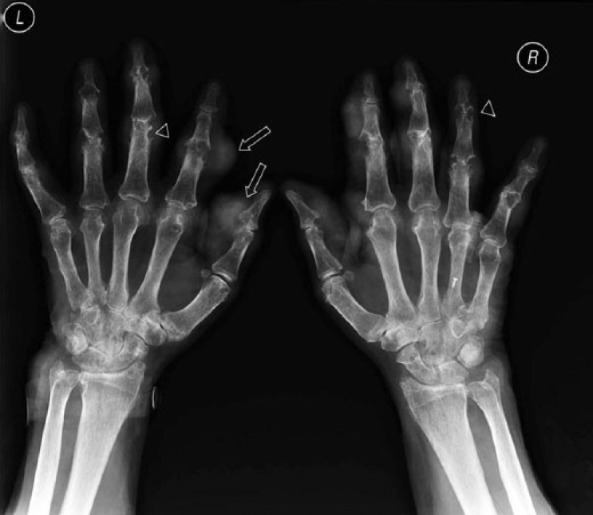
Conventional radiography of both hands showing multiple punched out erosions (arrowheads) and soft tissue densities (tophi; arrows) typical of gout.
In the trial setting, CR has been utilized as an outcome tool. A radiographic scoring system developed for rheumatoid arthritis (RA) clinical trials (Sharp/van der Heijde system) has been modified to apply to gout [Dalbeth et al. 2007b]. This measures joint space narrowing and erosions in the small joints of the hands and feet. In contrast to the system developed for RA, this tool scores the distal interphalangeal joints. Initial validation work has demonstrated this scoring system to have excellent reproducibility and feasibility [Dalbeth et al. 2007b]. Responsiveness of this scoring system has not been tested extensively, however a recent small exploratory study showed a significant improvement in the erosion subscore using the modified Sharp/van der Heijde system in people with tophaceous gout with intensive urate-lowering therapy using pegloticase over a 12-month period [Dalbeth et al. 2013a]. The study, although small, is pivotal as it demonstrates healing of erosions in response to aggressive urate lowering, and also supports the as yet scientifically unproven hypothesis that suppression of uric acid will prevent structural joint damage [Dalbeth et al. 2013a].
CR may be a useful outcome tool in clinical trials as it is widely accessible and inexpensive, and while this is an old and simple imaging technique, this recent study showing erosion healing demonstrates that CR modality can still add to our understanding of this disease and assessment of outcomes in gout.
Ultrasonography
US is being used increasingly in gout and can assist in both the diagnosis and monitoring of disease. Advantages of US over other imaging modalities include the ease of access, lack of ionizing radiation and relatively low cost. US however has limitations, being reliant upon a good acoustic window to visualize a joint, and is generally less sensitive than MRI in detecting joint inflammation and structural changes [Chowalloor and Keen, 2013b]. The major limitation is its operator-dependent nature.
Generic signs of joint inflammation and damage identifiable by US include synovitis and erosions. Synovitis on US is identified as synovial hypertrophy and effusion, with or without Doppler signal (suggestive of inflammation) [Wakefield et al. 2005]. Erosions are cortical breaks seen in two planes (as defined by Outcome Measures in Rheumatology Clinical Trials, OMERACT) [Wakefield et al. 2005]. More specific features of gout are also seen, such as the double contour sign (DC) and tophi [Thiele and Schlesinger, 2007; Filippucci et al. 2010a]. While recent decades have seen the validity and clinical utility of US in the setting of RA extensively explored [Terslev et al. 2012], there has been much less work specific to gout. Interpreting publications relating to US descriptions of gout are difficult due to a lack of internationally recognized descriptions and definitions of pathology seen in gout on US [Chowalloor and Keen, 2013b]. This is illustrated in the discussion of pathology in the paragraphs below. The OMERCT US group are working towards standardized definitions of pathology in gout, which should facilitate the development of this imaging modality as a clinical and outcome tool in gout in the future.
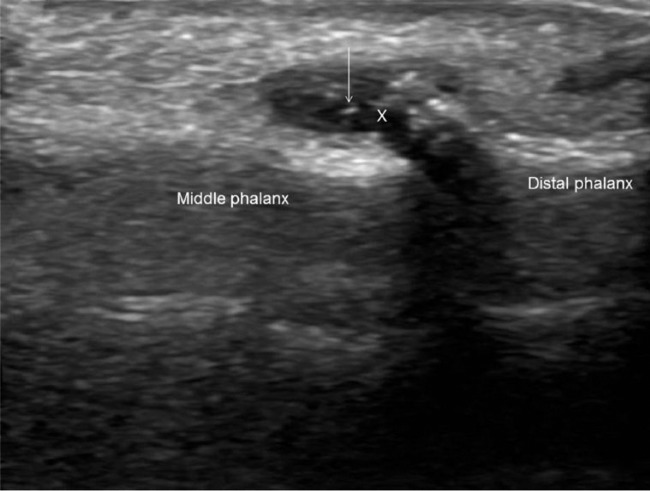
In RA, US has been demonstrated to be sensitive and specific to the presence of these generic features and able to detect subclinical disease [Naredo et al. 2013b]. In the setting of gout, the synovium may have an ultrasound appearance thought to be more suggestive of gout than other inflammatory arthritis. Reported descriptions include ‘bright stippled foci’ and ‘hyper-echoic spots’, ‘hyper-echoic cloudy areas’ and a ‘snow storm’ appearance, which is thought to be a result of MSU crystals in synovial fluid or tissue producing small bright echoes [Wright et al. 2007; Rettenbacher et al. 2008; De Miguel et al. 2012] (Figure 2). While these findings have generally been considered as specific to people with a diagnosis of gout and asymptomatic hyperuricemia (AH) [Rettenbacher et al. 2008], ‘very small intra-articular hyper-echoic’ spots and ‘intra-articular or intra-bursal hyper-echoic aggregates’ have been reported to be seen in other types of arthritis [Wright et al. 2007]. More recently, a case-controlled multicenter study found that these were more commonly seen in gout, but are not specific to gout [Naredo et al. 2013a]. Additionally the “snowstorm” of synovial fluid, thought to be mobile crystals within the fluid described in acute gout [Grassi et al. 2006] may not be specific to gout [Wakefield, 2007]. Recent exploratory studies in gout reports that synovitis is most commonly seen in the first MTP joint, knee, ankle, wrist and second metacarpophalangeal (MCP) joint [Chowalloor and Keen, 2013a]. Other recent, small studies on gout established the presence of subclinical synovitis in gout in both the acute and intercritical phase [Schueller-Weidekamm et al. 2007; Chowalloor and Keen, 2012]. Of interest, in the single US study assessing subclinical synovitis longitudinally, the number of clinically active joints decreased in the intercritical phase, but subclinical inflammation did not differ between the acute and intercritical phases [Chowalloor and Keen, 2013a]. This has potential implications in the assessment of disease activity and burden of disease in gout. It is worth noting that in this small study, the serum uric acid level was not adequately suppressed, and that the long-term relevance of subclinical inflammation with regards to structural joint damage or comorbidities is uncertain.
Figure 2.
Ultrasound of ring finger, dorsal distal interphalangeal joint longitudinal view, showing joint effusion (indicated with a cross) and hyper-echoic spots (arrow) suggestive of monosodium urate crystal deposition, the ‘snow-storm’ appearance.
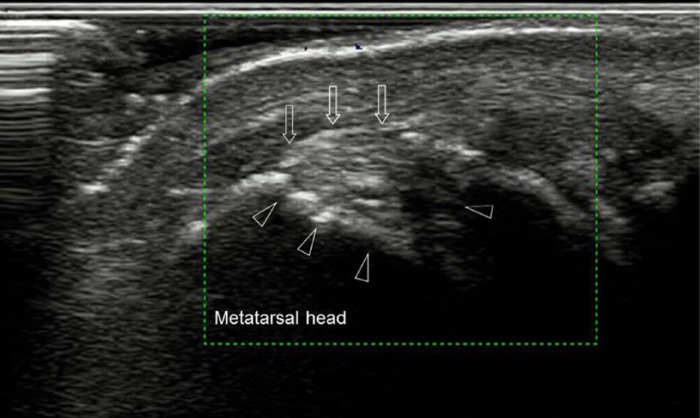
Ultrasound-detected erosions in the setting of gout are found most commonly in the first MTP joint (especially medial surface) and MCP joints [Thiele and Schlesinger, 2007; Wright et al. 2007; Filippucci et al. 2010a]. First MTP erosions are more characteristic of gout than other inflammatory arthritides [Wright et al. 2007]. Erosions may be found in previously asymptomatic MTP joints [Chowalloor and Keen, 2013b], they are commonly seen adjacent to tophi, and they may display Doppler signal [Wright et al. 2007] (Figure 3). In gout, US is more sensitive to erosions than CR, particularly smaller erosions [Wright et al. 2007].
Figure 3.
Ultrasound of left first metatarsophalangeal joint, longitudinal view, demonstrating intra-articular tophaceous material (arrows) and erosions (arrowheads).
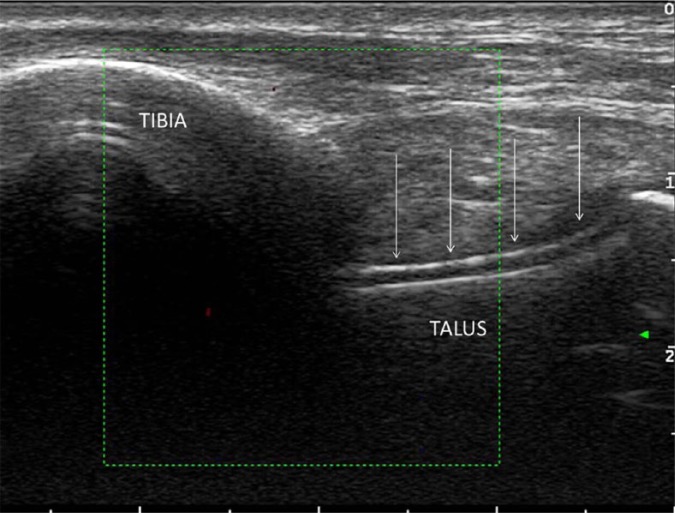
The DC sign is a hyper-echoic irregular band over the articular cartilage due to the deposition of MSU crystals, best seen on the dorsal side of the MTP joints [Filippucci et al. 2010b] and femoral condyles [Naredo et al. 2013a] (Figure 4). In most studies comparing subjects with gout or AH with controls (either patients with other inflammatory joint diseases or normouricemic individuals) the DC sign is reported to be specific (but not sensitive) to AH and gout [Filippucci et al. 2009; Pineda et al. 2011; De Miguel et al. 2012; Ottaviani et al. 2012]. In contrast, a recent study examining subjects with gout and controls found the DC sign was found in controls [Ottaviani et al. 2012]. The reported serum urate in the group ranged from 2.3 to 7.6 mg/dl, so some of the control cohort presumably had AH. Other explanations include differences in methodology, joints examined, the demographics of the population, or that US is a user-dependent technique, and that the cartilage interface may produce an artefact that may be mistaken for a DC. The validity of the DC sign in gout has not been compared with other imaging modalities [Chowalloor and Keen, 2013b], however in AH, the majority of joints with US-detected DC sign or hyper-echoic cloudy area demonstrated MSU crystals on joint aspirate [De Miguel et al. 2012].
Figure 4.
Ultrasound of ankle joint, longitudinal view, demonstrating the double contour sign, formed by monosodium urate crystal deposition across the top of the talar cartilage (arrows).
Tophi are typical clinical features of gout and have been variably described in US studies [Wright et al. 2007; Ottaviani et al. 2010; De Ávila Fernandes et al. 2011; Howard et al. 2011; Pineda et al. 2011; De Miguel et al. 2012]. Tophi can be seen in various locations, such as within the joint, burse, in relation to the tendons, ligaments and in other soft tissues (Figure 3). Various descriptions of tophi are referred to in the literature, including ‘hyper-echoic heterogeneous soft tissue deposit with or without post echoic shadowing’, ‘iso-echoic/hyper-echoic nodular deposits’, ‘bright spots’ and ‘hyper-echoic areas’ [Chowalloor and Keen, 2013b]. A recent study reported that common intra-articular sites for tophaceous deposits include the first MTP joint, radiocarpal joint, midcarpal joint and knees [Naredo et al. 2013a]. The most common tendinous locations for tophi were the patellar and triceps tendon, followed by the quadriceps and Achilles tendons [Naredo et al. 2013a].
Naredo and colleagues tested the diagnostic value of US by extensively systematically examining a large number of joints, including cartilage, bursae, ligaments and tendons in subjects with gout and controls [Naredo et al. 2013a]. The study focused on US signs relatively specific for gout, such as the DC sign and hyper-echoic aggregates, and aimed to determine the optimal combination of pathologies and locations to assist in the diagnosis of gout. The results demonstrate that imaging the radiocarpal joint and the patella and triceps tendon for evidence of hyper-echoic aggregates, and the first metatarsal, talar and second metacarpal or femoral cartilage for the DC signs produced a sensitivity of 84.6% and specificity of 83.3%. The specificity of individual lesions, such as the DC sign, was not as high in this study as reported in other studies; however, the presence of hyper-echoic aggregates in both the patella and triceps tendon was highly specific for gout in this study. In clinical practice, US does add to the diagnostic certainty, but should be considered an adjuvant to the history, examination and biochemical findings.
Figure 5.
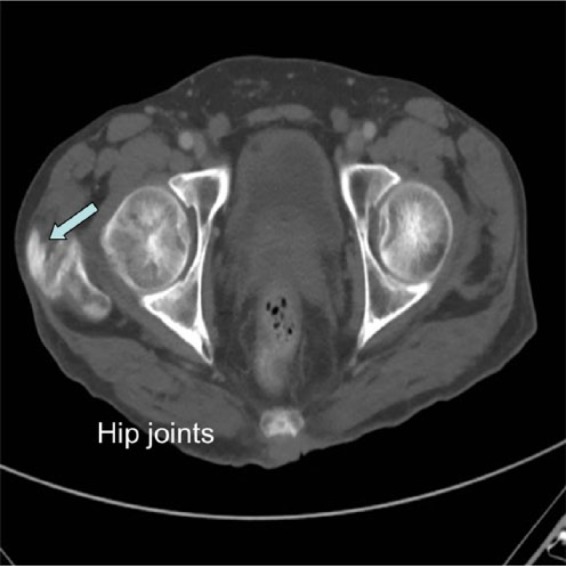
Computed tomography scan showing tophaceous calcification in the gluteal tendon and trochanteric bursa (arrows).
Ultrasound can be used to monitor response to therapy. The resolution of tophi and the DC sign have been demonstrated in response to urate-lowering therapy [Perez-Ruiz et al. 2007; Thiele and Schlesinger, 2010].
Computed tomography
CT is not commonly utilized in the clinical management of gout. It is associated with ionizing radiation, and until recently, conferred little added benefit over CR, US and MRI.
There has been some investigation into the utility of imaging tophi in gout, particularly with regards to differentiating tophus from other subcutaneous nodules noninvasively [Gerster et al. 1998; Gentili, 2006]. Tophus appears on CT as hyperdense lesions, with their specific density allowing differentiation from other hyperdense lesions [Gerster et al. 1996]. Soft tissue lesions have lower attenuation and calcifications have higher attenuation than that of tophus [Gentili, 2006]. CT can assess deep intra-articular and intraosseous tophi [Gerster et al. 1996], which may be undetectable by clinical or US examination. CT can also measure tophus volumes with excellent reproducibility [Dalbeth et al. 2007a], which has been used in clinical trials as an endpoint. However, the evidence suggests that if a tophus is able to be measured physically in the clinical setting with calipers, then this is an equivalent tool [Dalbeth et al. 2007a].
CT can identify gouty erosions. Dalbeth and colleagues recently demonstrated that CT erosions in gout are closely related to tophi, suggesting that tophus infiltration may have a pathogenic role in the development of erosions in gout [Dalbeth et al. 2009a]. The same group demonstrated a strong association between erosions and new bone formation (sclerosis, osteophytes and spurs), suggesting a relationship between bone resorption and new bone formation in gout [Dalbeth et al. 2012b].
A CT scoring method for quantifying bone erosions at the feet in gout has been developed and validated [Dalbeth et al. 2011]. Preliminary investigation has demonstrated sensitivity and reliability, and while responsiveness is yet to be established, this tool may assist in monitoring structural progression in gout in clinical studies.
Arguably, the most exciting imaging advance in gout in recent years is the advent of DECT, which is able to detect MSU burden noninvasively. In addition to identifying crystals, advantages include shorter scanning times, the ability to scan multiple joints simultaneously and have excellent reproducible visualization compared with US. This technology was developed to determine the chemical composition of renal stones and atherosclerotic coronary plaques, but has been recognized to have utility in the clinical setting of diagnosing and managing gout. This technique relies on acquiring two datasets simultaneously through the use of two separate X-ray tubes producing differing energy levels [Nicolaou et al. 2010]. Differences in attenuation are able to be identified and color coded, allowing material rich in calcium (high attenuation) to be differentiated from material rich in MSU crystals (low attenuation) [Nicolaou et al. 2010].
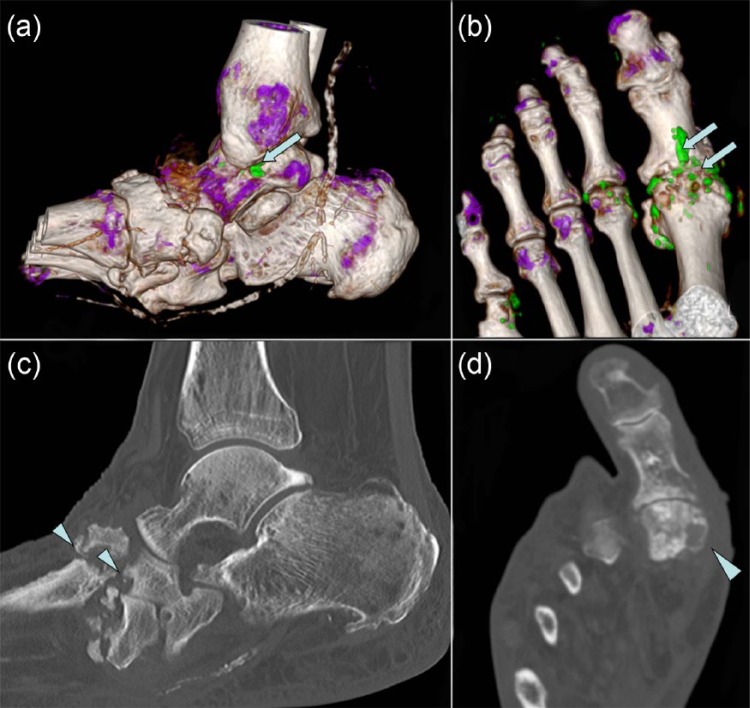
DECT imaging is useful in identifying subclinical urate burden. MSU deposition can also be seen in joints, tendons, ligaments and soft tissues (Figure 6). When tophi identified by DECT imaging was compared with that of physical examination [Choi et al. 2009], DECT was able to pick up four times the tophi picked up by physical examination. The most common sites involved on DECT are MTP joints (85%), knees (85%) and ankles (70%), followed by wrists (50%), MCP joints and elbows (40%) [Choi et al. 2009]. The most commonly involved tendon/ligament site is the Achilles, followed by peroneal tendons [Dalbeth et al. 2013b].
Figure 6.
Dual energy computed tomography images of ankle and foot (a, b) showing monosodium urate crystal deposition in green color (arrows) and corresponding computed tomography (c, d) shows erosions (arrowheads).
DECT has been shown to be highly sensitive and specific to the presence of MSU crystals, using aspirate of MSU crystals as the gold standard [Glazebrook et al. 2011]. Additionally, findings of MSU by DECT are able to differentiate between patients with well established gout and controls, with excellent sensitivity (78–84%) and specificity (93%) [Choi et al. 2012]. In studies with significant false negatives, the cohorts of patients are generally on urate-lowering therapies with serum urate concentrations below the physiological saturation threshold, which may affect the burden of MSU deposits in these patients. In addition to urate-lowering therapies, disease duration may also affect the sensitivity of DECT to detect gout, presumably related to the burden of deposited MSU crystals (the minimal detectable deposit size is 2 mm) [Glazebrook et al. 2012]. In addition to limitations in detecting small deposits, a recent case report illustrated that even large tophaceous deposits may be missed if they are not particularly dense [Melzer et al. 2014].
In assessing the utility of DECT compared with US, detection of MSU by DECT has been shown to have a similar sensitivity to the US detected DC sign [Gruber et al. 2014]. However, the sensitivity and specificity of DECT are dependent on the imaging protocol utilized. A recent study in assessing tophi compared DECT imaging with MRI scanning and found that results can vary depending on the software setting for DECT [McQueen et al. 2013]. When images were reconstructed with two different parameter ratios for DECT imaging, MRI only correlated with one DECT image and the other DECT image did not identify any tophi. Therefore it is important to standardize software settings to minimize these errors.
The diagnostic sensitivity of DECT is much less in the absence of chronic gout, that is, in new presentations. For example, in one small study of 14 subjects with acute, nontophaceous gout, DECT identified MSU deposits in 78% of subjects, but only 50% of subjects presenting with an inaugural attack [Manger et al. 2012]. Thus, a negative DECT in the setting of an acute initial presentation of presumed gout is unhelpful to the clinician, as this is the situation when a clinical adjuvant tool is perhaps most needed.
The reproducibility of DECT is very good [Glazebrook et al. 2011]. Excellent inter- and intra-observer reproducibility has been demonstrated [Choi et al. 2012] for tophus volume. DECT is more reproducible than physical methods (calipers or tape measurements) in assessing tophus size [Dalbeth et al. 2012a].
DECT may be responsive to change, with a reduction in the burden of MSU in response to treatment in multiple case reports [Desai et al. 2011; Bacani et al. 2012]. However, in the setting of longstanding stable gout treated with urate-lowering therapy, the measurable urate burden has been shown to be below the smallest detectable change, limiting the utility of DECT in monitoring therapeutic response [Rajan et al. 2013b].
Magnetic resonance imaging
This is an excellent imaging modality to image synovium, cartilage, soft tissue and bone, as it lacks radiation and has excellent contrast and resolution. However, limitations include high cost, availability, long scanning time, use of contrast, patient acceptability, and exclusion of those patients with aneurysm clips or pacemaker. MRI can demonstrate generic features of inflammatory arthritis, such as synovial thickening, effusion, bone erosions, and bone marrow edema (BME) in gout [Popp et al. 1996; Cimmino et al. 2011] (Figures 7 and 8). MRI can demonstrate subclinical inflammation in asymptomatic joints in gout [Carter et al. 2009]. MRI is better than US and CR in detecting erosions [Carter et al. 2009]. A clue to the diagnosis of gout in the setting of generic inflammatory changes is that BME is uncommon and if present is often mild [McQueen et al. 2013], the presence of extensive BME on MRI should raise the question of infection. A retrospective review of patients with gout showed that severe BME on the MRI was much more common in gout plus osteomyelitis than in uncomplicated gout [Poh et al. 2011].
Figure 7.
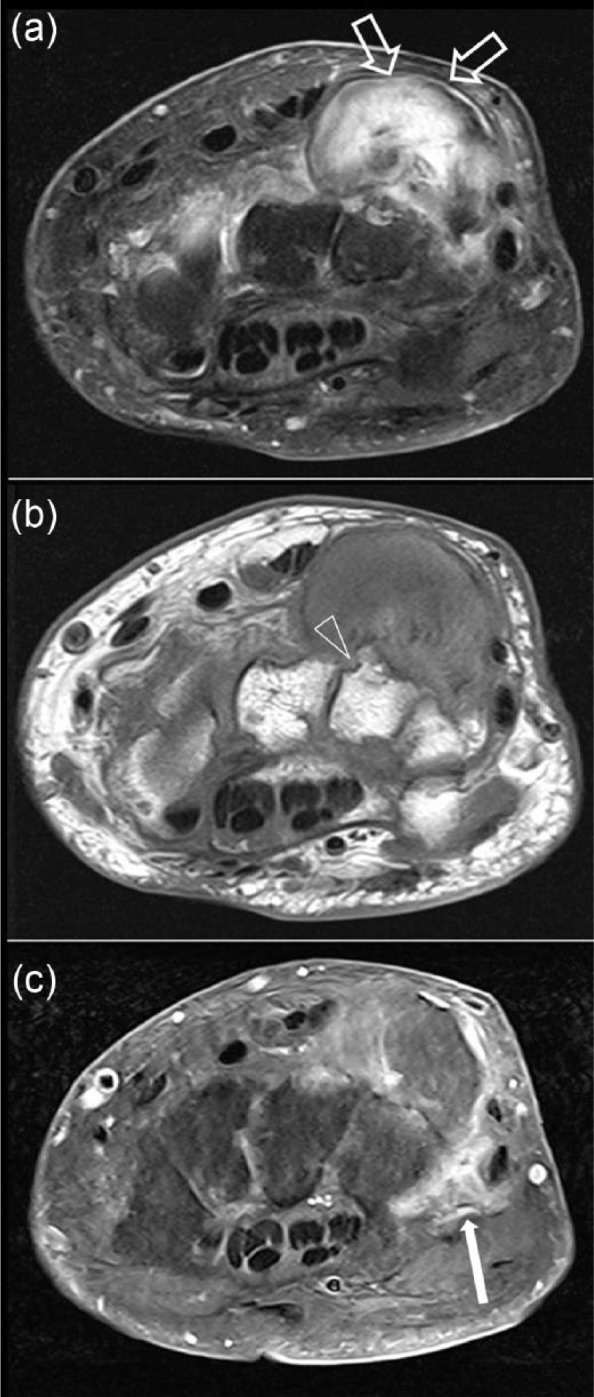
Magnetic resonance imaging scans of the wrist at the dorsal ulnar aspect: (a) T2 fat-saturated transverse; (b) T1 transverse; and (c) T1 fat-saturated with gadolinium. The scans show a well circumscribed mixed soft tissue calcified mass (open arrow) which represents calcification of tophus with some gadolinium enhancement of soft tissue surrounding the lesion (filled arrow) and periarticular erosions (arrowheads) suggestive of gouty tophus.
Figure 8.
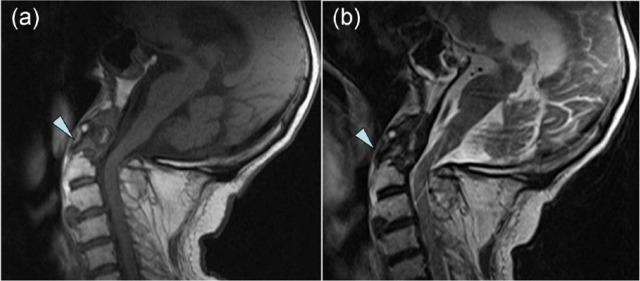
Magnetic resonance imaging scans of the cervical spine: (a) T1 weighted; (b) T2 weighted. The scans demonstrate calcification and erosion of the odontoid peg (arrowhead).
Tophi can have various appearances on MRI [Dhanda et al. 2011]. T1-weighted images characteristically show homogeneous, low to intermediate signal intensity, and variable signal intensity is shown on T2-weighted images depending on the degree of hydration of the tophus and its calcium concentration. Heterogeneous, intermediate to low signal is the most common pattern on T2-weighted images. Tophi show intense gadolinium enhancement due to hypervascular soft tissue and granulation tissue that surround tophi (Figure 7). MRI has been compared with DECT scanning for tophus detection [McQueen et al. 2013]. Compared with DECT, MRI had high specificity and moderate sensitivity for detecting tophi [Schumacher et al. 2006].
A recent study assessing the reproducibility of MRI scoring for assessment of erosion, tophus size, synovitis and bone edema [McQueen et al. 2013] found inter-observer reproducibility was high for scoring erosions and tophus size, and was moderate for assessment of synovitis and bone edema. Intra-observer reliability was very high for bone erosion, bone edema, synovitis and tophus size. The sensitivity to change with treatment has not been published for any of the features on MRI in gout. Assessment of tophus size with MRI correlates well with that of US [Perez-Ruiz et al. 2007]. Therefore one can assume that like US, MRI will be able to detect change in tophus size. Overall, MRI has a limited role in disease monitoring due to the high expense and limited availability.
While MRI is not a new imaging technique, recent investigations into MRI in gout have altered our understanding of the disease and how the pathogenesis differs from other inflammatory arthritides. For example, a recent study demonstrated that, in contrast to RA, gout erosion was predicted by the presence of tophi, but not synovitis or BME [McQueen et al. 2014].
Nuclear medicine
Few systematic publications exist with regards to nuclear imaging in gout. While bone scan has high sensitivity in detecting osseous abnormality, the scintigraphic findings in gout are often nonspecific (Figure 9). The current scientific literature has not shown white cell imaging to be useful in differentiating between infection and the acute inflammatory phase of gout [Palestro et al. 1990; Appelboom et al. 2003]. Case reports of positron emission tomography (PET) combined with CT (PET/CT) in gout showed articular and periarticular fluorodeoxyglucose (FDG) uptake [Steiner and Vijayakumar, 2009; Ito et al. 2012]. Soft tissue FDG uptake corresponding to tophi has also been reported [Popovich et al. 2006]. These findings are not specific for gout. Like with MRI, this may be useful when gout presents in unusual body locations, such as axial skeleton.
Figure 9.
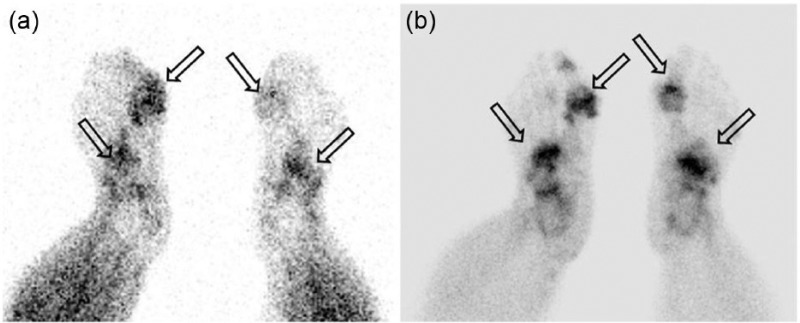
Bone scan: (a) blood pool; and (b) delayed bone images. Delayed phase imaging shows increased activity in both the first MTP region and in the mid feet.
Conclusion
In summary, different imaging modalities are available to assist clinicians with making an accurate diagnosis. Some of the imaging features can aid diagnostically in differentiating gout from other inflammatory arthritis conditions, but generally, these are less useful in early disease when the need is usually greater. CR, US and DECT have the ability to assist in monitoring response to treatment. While others, like CT and MRI, have been demonstrated to aid our understanding of this disease recently, and are likely to continue to be useful in proof-of-concept studies. Recent studies of imaging techniques have improved our understanding of gout and their clinical application.
Acknowledgments
We are grateful to Dr Brendan Adler, Envision Medical Imaging for providing dual energy computed tomography images.
Footnotes
Funding: This research received no specific grant from any funding agency in the public, commercial, or not-for-profit sectors.
Conflict of interest statement: The authors declare no conflict of interest in preparing this article.
Contributor Information
Priya Varghese Chowalloor, School of Medicine and Pharmacology, The University of Western Australia, 35 Stirling Highway, Crawley, Perth, Western Australia 6009, Australia.
Teck K. Siew, Diagnostic and Interventional Radiology, Royal Perth Hospital, Perth, WA, Australia
Helen Isobel Keen, School of Medicine and Pharmacology, University of Western Australia, Crawley, WA, Australia.
References
- Appelboom T., Emery P., Tant L., Dumarey N., Schoutens A. (2003) Evaluation of technetium-99m-ciprofloxacin (Infecton) for detecting sites of inflammation in arthritis. Rheumatology 42: 1179–1182 [DOI] [PubMed] [Google Scholar]
- Bacani A., McCollough C., Glazebrook K., Bond J., Michet C., Milks J., et al. (2012) Dual energy computed tomography for quantification of tissue urate deposits in tophaceous gout: help from modern physics in the management of an ancient disease. Rheumatol Int 32: 235–239 [DOI] [PubMed] [Google Scholar]
- Barthelemy C., Nakayama D., Carrera G., Lightfoot R., Jr, Wortmann R. (1984) Gouty arthritis: a prospective radiographic evaluation of sixty patients. Skeletal Radiol 11: 1–8 [DOI] [PubMed] [Google Scholar]
- Briesacher B., Andrade S., Fouayzi H., Chan K. (2008) Comparison of drug adherence rates among patients with seven different medical conditions. Pharmacotherapy 28: 437–443 [DOI] [PMC free article] [PubMed] [Google Scholar]
- Brook R., Kleinman N., Patel P., Melkonian A., Brizee T., Smeeding J., et al. (2006) The economic burden of gout on an employed population. Curr Med Res Opin 22: 1381–1389 [DOI] [PubMed] [Google Scholar]
- Carter J., Kedar R., Anderson S., Osorio A., Albritton N., Gnanashanmugam S., et al. (2009) An analysis of MRI and ultrasound imaging in patients with gout who have normal plain radiographs. Rheumatology 48: 1442–1446 [DOI] [PubMed] [Google Scholar]
- Chen S., Chen C., Shen M. (2007) Manifestations of metabolic syndrome associated with male gout in different age strata. Clin Rheumatol 26: 1453–1457 [DOI] [PubMed] [Google Scholar]
- Choi H., Al-Arfaj A., Eftekhari A., Munk P., Shojania K., Reid G., et al. (2009) Dual energy computed tomography in tophaceous gout. Ann Rheum Dis 68: 1609–1612 [DOI] [PubMed] [Google Scholar]
- Choi H., Burns L., Shojania K., Koenig N., Reid G., Abufayyah M., et al. (2012) Dual energy CT in gout: a prospective validation study. Ann Rheum Dis 71: 1466–1471 [DOI] [PubMed] [Google Scholar]
- Choi H., Mount D., Reginato A. (2005) Pathogenesis of gout. Ann Intern Med 143: 499–516 [DOI] [PubMed] [Google Scholar]
- Chowalloor P., Keen H. (2012) Subclinical synovial inflammation in gout. Intern Med J 42: 3023035679 [Google Scholar]
- Chowalloor P., Keen H. (2013a) Prevalence and distribution of subclinical synovitis in gout. Intern Med J 43: 22 [Google Scholar]
- Chowalloor P., Keen H. (2013b) A systematic review of ultrasonography in gout and asymptomatic hyperuricaemia. Ann Rheum Dis 72: 638–645 [DOI] [PubMed] [Google Scholar]
- Cimmino M., Zampogna G., Parodi M., Andracco R., Barbieri F., Paparo F., et al. (2011) MRI synovitis and bone lesions are common in acute gouty arthritis of the wrist even during the first attack. Ann Rheum Dis 70: 2238–2239 [DOI] [PubMed] [Google Scholar]
- Dalbeth N., Aati O., Gao A., House M., Liu Q., Horne A., et al. (2012a) Assessment of tophus size: a comparison between physical measurement methods and dual-energy computed tomography scanning. J Clin Rheumatol 18: 23–27 [DOI] [PubMed] [Google Scholar]
- Dalbeth N., Clark B., Gregory K., Gamble G., Doyle A., McQueen F. (2007a) Computed tomography measurement of tophus volume: comparison with physical measurement. Arthritis Care Res (Hoboken) 57: 461–465 [DOI] [PubMed] [Google Scholar]
- Dalbeth N., Clark B., Gregory K., Gamble G., Sheehan T., Doyle A., et al. (2009) Mechanisms of bone erosion in gout: a quantitative analysis using plain radiography and computed tomography. Ann Rheum Dis 68: 1290–1295 [DOI] [PubMed] [Google Scholar]
- Dalbeth N., Clark B., McQueen F., Doyle A., Taylor W. (2007b) Validation of a radiographic damage index in chronic gout. Arthritis Care Res (Hoboken) 57: 1067–1073 [DOI] [PubMed] [Google Scholar]
- Dalbeth N., Doyle A., Boyer L., Rome K., Survepalli D., Sanders A., et al. (2011) Development of a computed tomography method of scoring bone erosion in patients with gout: validation and clinical implications. Rheumatology 50: 410–416 [DOI] [PubMed] [Google Scholar]
- Dalbeth N., Doyle A., McQueen F., Sundy J., Baraf H. (2013a) Exploratory study of radiographic change in patients with tophaceous gout treated with intensive urate-lowering therapy. Arthritis Care Res (Hoboken) 66: 82–85 [DOI] [PubMed] [Google Scholar]
- Dalbeth N., Kalluru R., Aati O., Horne A., Doyle A., McQueen F. (2013b) Tendon involvement in the feet of patients with gout: a dual-energy CT study. Ann Rheum Dis 72: 1545-1548 [DOI] [PubMed] [Google Scholar]
- Dalbeth N., Milligan A., Doyle A., Clark B., McQueen F. (2012b) Characterisation of new bone formation in gout: a quantitative site-by-site analysis using plain radiography and computed tomography. Arthritis Res Ther 14: R165. [DOI] [PMC free article] [PubMed] [Google Scholar]
- De Ávila Fernandes E., Kubota E., Sandim G., Mitraud S., Ferrari A., Fernandes A. (2011) Ultrasound features of tophi in chronic tophaceous gout. Skeletal Radiol 40: 309–315 [DOI] [PubMed] [Google Scholar]
- De Miguel E., Puig J., Castillo C., Peiteado D., Torres R., Martín-Mola E. (2012) Diagnosis of gout in patients with asymptomatic hyperuricaemia: a pilot ultrasound study. Ann Rheum Dis 71: 157–158 [DOI] [PubMed] [Google Scholar]
- Desai M., Peterson J., Garner H., Kransdorf M. (2011) Clinical utility of dual-energy CT for evaluation of tophaceous gout. Radiographics 31: 1365–1375 [DOI] [PubMed] [Google Scholar]
- Dhanda S., Jagmohan P., Tian Q. (2011) A re-look at an old disease: a multimodality review on gout. Clin Radiol 66: 984–992 [DOI] [PubMed] [Google Scholar]
- Filippucci E., Gutierrez M., Georgescu D., Salaffi F., Grassi W. (2009) Hyaline cartilage involvement in patients with gout and calcium pyrophosphate deposition disease. An ultrasound study. Osteoarthritis and Cartilage 17: 178–181 [DOI] [PubMed] [Google Scholar]
- Filippucci E., Meenagh G., Delle Sedie A., Sakellariou G., Iagnocco A., Riente L., et al. (2010a) Ultrasound imaging for the rheumatologist XXXVI. Sonographic assessment of the foot in gout patients. Clin Exp Rheumatol 29: 901–905 [PubMed] [Google Scholar]
- Filippucci E., Scirè C., Delle Sedie A., Iagnocco A., Riente L., Meenagh G., et al. (2010b) Ultrasound imaging for the rheumatologist. Xxv. Sonographic assessment of the knee in patients with gout and calcium pyrophosphate deposition disease. Clin Exp Rheumatol 28: 2. [PubMed] [Google Scholar]
- Gentili A. (2006) The advanced imaging of gouty tophi. Curr Rheumatol Rep 8: 231–235 [DOI] [PubMed] [Google Scholar]
- Gerster J., Landry M., Duvoisin B., Rappoport G. (1996) Computed tomography of the knee joint as an indicator of intraarticular tophi in gout. Arthritis Rheum 39: 1406–1409 [DOI] [PubMed] [Google Scholar]
- Gerster J., Landry M., Rivier G. (1998) Computed tomographic imaging of subcutaneous gouty tophi. Clin Rheumatol 17: 62–64 [DOI] [PubMed] [Google Scholar]
- Glazebrook K., Guimarães L., Murthy N., Black D., Bongartz T., Manek N., et al. (2011) Identification of intraarticular and periarticular uric acid crystals with dual-energy CT: initial evaluation. Radiology 261: 516–524 [DOI] [PubMed] [Google Scholar]
- Glazebrook K., Kakar S., Ida C., Laurini J., Moder K., Leng S. (2012) False-negative dual-energy computed tomography in a patient with acute gout. J Clin Rheumatol 18: 138–141 [DOI] [PubMed] [Google Scholar]
- Grassi W., Meenagh G., Pascual E., Filippucci E. (2006) “Crystal Clear”—sonographic assessment of gout and calcium pyrophosphate deposition disease. Semin Arthritis Rheum 36: 197–202 [DOI] [PubMed] [Google Scholar]
- Gruber M., Bodner G., Rath E., Supp G., Weber M., Schueller-Weidekamm C. (2014) Dual-energy computed tomography compared with ultrasound in the diagnosis of gout. Rheumatology 53: 173-179 [DOI] [PubMed] [Google Scholar]
- Edwards NL. (2008) Gout: clinical and laboratory features. In: Klippel J., Stone J., Crofford L., White P. (eds), Primer on the Rheumatic Diseases, 13 ed. Atlanta, GA: Arthritis Foundation, pp 241–249 [Google Scholar]
- Howard R., Pillinger M., Gyftopoulos S., Thiele R., Swearingen C., Samuels J. (2011) Reproducibility of musculoskeletal ultrasound for determining monosodium urate deposition: concordance between readers. Arthritis Care Res (Hoboken) 63: 1456–1462 [DOI] [PMC free article] [PubMed] [Google Scholar]
- Ito K., Minamimoto R., Morooka M., Kubota K. (2012) A case of gouty arthritis to tophi on 18F-FDG PET/CT imaging. Clin Nucl Med 37: 614–617 [DOI] [PubMed] [Google Scholar]
- Jackson G., Wright C., Thornley S., Taylor W., Te Karu L., Gow P., et al. (2012) Potential unmet need for gout diagnosis and treatment: capture–recapture analysis of a national administrative dataset. Rheumatology 51: 1820–1824 [DOI] [PubMed] [Google Scholar]
- Khanna D., Fitzgerald J., Khanna P., Bae S., Singh M., Neogi T., et al. (2012) 2012 American College of Rheumatology guidelines for management of gout. Part 1: systematic nonpharmacologic and pharmacologic therapeutic approaches to hyperuricemia. Arthritis Care Res (Hoboken) 64: 1431–1446 [DOI] [PMC free article] [PubMed] [Google Scholar]
- Kim K., Ralph Schumacher H., Hunsche E., Wertheimer A., Kong S. (2003) A literature review of the epidemiology and treatment of acute gout. Clin Ther 25: 1593–1617 [DOI] [PubMed] [Google Scholar]
- Manger B., Lell M., Wacker J., Schett G., Rech J. (2012) Detection of periarticular urate deposits with dual energy CT in patients with acute gouty arthritis. Ann Rheum Dis 71: 470–472 [DOI] [PubMed] [Google Scholar]
- McQueen F., Doyle A., Reeves Q., Gamble G., Dalbeth N. (2013) DECT urate deposits: now you see them, now you don’t. Ann Rheum Dis 72: 458–459 [DOI] [PubMed] [Google Scholar]
- McQueen F., Doyle A., Reeves Q., Gao A., Tsai A., Gamble G., et al. (2014) Bone erosions in patients with chronic gouty arthropathy are associated with tophi but not bone oedema or synovitis: new insights from a 3 T MRI study. Rheumatology (Oxford) 53: 95-103 [DOI] [PubMed] [Google Scholar]
- Melzer R., Pauli C., Treumann T., Krauss B. (2014) Gout tophus detection—a comparison of dual-energy CT (DECT) and histology. Semin Arthritis Rheum 43: 662-665 [DOI] [PubMed] [Google Scholar]
- Naredo E., Uson J., Jiménez-Palop M., Martínez A., Vicente E., Brito E., et al. (2013a) Ultrasound-detected musculoskeletal urate crystal deposition: which joints and what findings should be assessed for diagnosing gout? Ann Rheum Dis 24 May (Epub ahead of print). [DOI] [PubMed] [Google Scholar]
- Naredo E., Valor L., De La Torre I., Martínez-Barrio J., Hinojosa M., Aramburu F., et al. (2013b) Ultrasound joint inflammation in rheumatoid arthritis in clinical remission: how many and which joints should be assessed? Arthritis Care Res (Hoboken) 65: 512–517 [DOI] [PubMed] [Google Scholar]
- Nicolaou S., Yong-Hing C., Galea-Soler S., Hou D., Louis L., Munk P. (2010) Dual-energy CT as a potential new diagnostic tool in the management of gout in the acute setting. Am J Roentgenol 194: 1072–1078 [DOI] [PubMed] [Google Scholar]
- Ottaviani S., Allard A., Bardin T., Richette P. (2010) An exploratory ultrasound study of early gout. Clin Exp Rheumatol 29: 816–821 [PubMed] [Google Scholar]
- Ottaviani S., Richette P., Allard A., Ora J., Bardin T. (2012) Ultrasonography in gout: a case-control study. Clin Exp Rheumatol 30: 499-504 [PubMed] [Google Scholar]
- Palestro C., Vega A., Kim C., Swyer A., Goldsmith S. (1990) Appearance of acute gouty arthritis on indium-111-labeled leukocyte scintigraphy. J Nucl Med 31: 682–684 [PubMed] [Google Scholar]
- Pascual E., Sivera F. (2007) Why is gout so poorly managed? Ann Rheum Dis 66: 1269–1270 [DOI] [PMC free article] [PubMed] [Google Scholar]
- Perez-Ruiz F., Martin I., Canteli B. (2007) Ultrasonographic measurement of tophi as an outcome measure for chronic gout. J Rheumatol 34: 1888–1893 [PubMed] [Google Scholar]
- Pineda C., Amezcua-Guerra L., Solano C., Rodriguez-Henríquez P., Hernández-Díaz C., Vargas A., et al. (2011) Joint and tendon subclinical involvement suggestive of gouty arthritis in asymptomatic hyperuricemia: an ultrasound controlled study. Arthritis Res Ther 13: R4. [DOI] [PMC free article] [PubMed] [Google Scholar]
- Poh Y., Dalbeth N., Doyle A., McQueen F. (2011) Magnetic resonance imaging bone edema is not a major feature of gout unless there is concomitant osteomyelitis: 10-year findings from a high-prevalence population. J Rheumatol 38: 2475–2481 [DOI] [PubMed] [Google Scholar]
- Popovich T., Carpenter J., Rai A., Carson L., Williams H., Marano G. (2006) Spinal cord compression by tophaceous gout with fluorodeoxyglucose–positron-emission tomographic/MR fusion imaging. Am J Neuroradiol 27: 1201–1203 [PMC free article] [PubMed] [Google Scholar]
- Popp J., Bidgood D., Jr, Lawrence Edwards N. (1996) Magnetic resonance imaging of tophaceous gout in the hands and wrists. Semin Arthritis Rheum 25: 282-289 [DOI] [PubMed] [Google Scholar]
- Rajan A., Aati O., Kalluru R., Gamble G., Horne A., Doyle A., et al. (2013) Lack of change in urate deposition by dual-energy computed tomography among clinically stable patients with long-standing tophaceous gout: a prospective longitudinal study. Arthritis Res Ther 15: R160. [DOI] [PMC free article] [PubMed] [Google Scholar]
- Rettenbacher T., Ennemoser S., Weirich H., Ulmer H., Hartig F., Klotz W., et al. (2008) Diagnostic imaging of gout: comparison of high-resolution US versus conventional X-ray. Eur Radiol 18: 621–630 [DOI] [PubMed] [Google Scholar]
- Richette P., Bardin T. (2010) Gout. Lancet 375: 318–328 [DOI] [PubMed] [Google Scholar]
- Riedel A., Nelson M., Joseph-Ridge N., Wallace K., MacDonald P., Becker M. (2004) Compliance with allopurinol therapy among managed care enrollees with gout: a retrospective analysis of administrative claims. J Rheumatol 31: 1575–1581 [PubMed] [Google Scholar]
- Schueller-Weidekamm C., Schueller G., Aringer M., Weber M., Kainberger F. (2007) Impact of sonography in gouty arthritis: comparison with conventional radiography, clinical examination, and laboratory findings. Eur J Radiol 62: 437–443 [DOI] [PubMed] [Google Scholar]
- Schumacher H., Becker M., Edwards N., Palmer W., MacDonald P., Palo W., et al. (2006) Magnetic resonance imaging in the quantitative assessment of gouty tophi. Int J Clin Pract 60: 408–414 [DOI] [PubMed] [Google Scholar]
- Steiner M., Vijayakumar V. (2009) Widespread tophaceous gout demonstrating Avidf-18 fluorodeoxyglucose uptake. Clin Nucl Med 34: 433–434 [DOI] [PubMed] [Google Scholar]
- Terslev L., Ellegaard K., Christensen R., Szkudlarek M., Schmidt W., Jensen P., et al. (2012) Head-to-head comparison of quantitative and semi-quantitative ultrasound scoring systems for rheumatoid arthritis: reliability, agreement and construct validity. Rheumatology 51: 2034–2038 [DOI] [PubMed] [Google Scholar]
- Thiele R., Schlesinger N. (2007) Diagnosis of gout by ultrasound. Rheumatology 46: 1116–1121 [DOI] [PubMed] [Google Scholar]
- Thiele R., Schlesinger N. (2010) Ultrasonography shows disappearance of monosodium urate crystal deposition on hyaline cartilage after sustained normouricemia is achieved. Rheumatol Int 30: 495–503 [DOI] [PubMed] [Google Scholar]
- Wakefield R. (2007) All that glimmers is not gold. Semin Arthritis Rheum 37: 133–134 [DOI] [PubMed] [Google Scholar]
- Wakefield R., Balint P., Szkudlarek M., Filippucci E., Backhaus M., D’Agostino M., et al. (2005) Musculoskeletal ultrasound including definitions for ultrasonographic pathology. J Rheumatol 32: 2485–2487 [PubMed] [Google Scholar]
- Wallace S., Robinson H., Masi A., Decker J., McCarty D. (1977) Preliminary criteria for the classification of the acute arthritis of primary gout. Arthritis Rheum 20: 895–900 [DOI] [PubMed] [Google Scholar]
- Wright S., Filippucci E., McVeigh C., Grey A., McCarron M., Grassi W., et al. (2007) High-resolution ultrasonography of the first metatarsal phalangeal joint in gout: a controlled study. Ann Rheum Dis 66: 859–864 [DOI] [PMC free article] [PubMed] [Google Scholar]
- Zhang W., Doherty M., Bardin T., Pascual E., Barskova V., Conaghan P., et al. (2006a) EULAR evidence based recommendations for gout. Part II: Management. Report of a Task Force of the EULAR Standing Committee for International Clinical Studies Including Therapeutics (ESCISIT). Ann Rheum Dis 65: 1312–1324 [DOI] [PMC free article] [PubMed] [Google Scholar]
- Zhang W., Doherty M., Pascual E., Bardin T., Barskova V., Conaghan P., et al. (2006b) EULAR evidence based recommendations for gout. Part I: Diagnosis. Report of a Task Force of the Standing Committee for International Clinical Studies Including Therapeutics (ESCISIT). Ann Rheum Dis 65: 1301–1311 [DOI] [PMC free article] [PubMed] [Google Scholar]


