Abstract
Background
Percutaneous cryoballoon ablation is a commonly used procedure to treat atrial fibrillation. One of the major limitations of the procedure is the inability to directly visualize tissue damage and functional gaps between the lesions. We seek to develop an approach that will enable real-time visualization of tissue necrosis during cryo- or radiofrequency ablation procedures.
Methods and Results
Cryoablation of either blood-perfused or saline-perfused hearts was associated with a marked decrease in NADH fluorescence leading to a 60-70% loss of signal intensity at the lesion site. The total lesion area observed on the NADH channel exhibited a strong correlation with the area identified by triphenyl tetrazolium staining (r=0.89, p<0.001). At physiological temperatures, loss of NADH became visually apparent within 26±8 sec after detachment of the cryoprobe from the epicardial surface and plateaued within minutes after which the boundaries of the lesions remained stable for several hours. The loss of electrical activity within the cryoablation site exhibited a close spatial correlation with the loss of NADH (r=0.84±0.06, p<0.001). Cryoablation led to a decrease in diffuse reflectance across the entire visible spectrum which was in stark contrast to radiofrequency ablation that markedly increased the intensity of reflected light at the lesion sites.
Conclusions
We confirmed the feasibility of using endogenous NADH fluorescence for the real-time visualization of cryoablation lesions in blood-perfused cardiac muscle preparations and revealed similarities and differences between imaging cryo- and radiofrequency ablation lesions when using ultraviolet and visible light illumination.
Keywords: atrial fibrillation arrhythmia, ablation, fluorescent imaging
Introduction
Paroxysmal atrial fibrillation (AF) is believed to be triggered by focal electrical activity originating mainly within muscle sleeves that extend into the pulmonary veins1. These focal triggers cause atrial tachycardia, driven by reentrant electrical activity and rotors, which may then fragment into a multitude of electrical wavelets that are characteristic of AF. Prolonged AF can cause functional alterations in membrane channel expression that further perpetuate AF, a phenomenon known as “AF begets AF”2. The most common treatment of AF consists of placing ablation lesions in a circular fashion around the ostia of the pulmonary veins to isolate ectopic sources from the rest of the atria1,3,4. More recently, advanced mapping techniques have allowed the targeting of specific localizations of AF ectopic sources and rotors with some degree of success5. Whether the surgeon's goal is complete pulmonary vein isolation with no interlesional gaps or site-targeted ablation, it is critical to know the extent of tissue damage at the site of the ablation. The latter is not a simple function of applied energy – it depends on many factors including: contact between the catheter tip and the tissue, thickness of the myocardium, degree of blood flow around the catheter tip, and presence of fatty tissue and collagen as well as many other factors. Therefore, it is critical to develop new methods to collect real-time information of the functional state of cardiac tissue whenever an ablation is being performed.
We have previously reported that a loss of endogenous fluorescence of nicotinamide adenine dinucleotide (fNADH) can serve as an immediate marker of myocardial damage caused by radiofrequency ablation (RFA)6. Cryoablation has recently become an increasingly popular alternative option for ablating abnormal AF sources7. The main hypothesis of this study is that one can use endogenous NADH fluorescence as a functional marker that allows the direct visualization of cryoablation lesions in cardiac muscle preparations. We examined the validity of this approach for the real-time visualization of cryoinjury and compared it to fNADH-based visualization of RFA lesions.
Methods
Animal procedures and general protocols
All animal experiments were conducted in accordance with the guidelines of the Institutional Animal Care and Use Committee at the George Washington University. Adult Sprague-Dawley rats (200-400 g) of mixed sex were injected with sodium heparin (i.p., 500 U/kg) and anesthetized with sodium pentobarbital (i.p., 45 mg/kg). For ex vivo studies, the heart was rapidly excised, the aorta cannulated, and the heart Langendorff-perfused with Tyrode's solution (Sigma T2145). Alternatively, for in vivo studies, the heart was ablated and imaged while still in the chest. Both types of studies included the following steps: 1) Expose epicardial surface, 2) Position illumination sources to evenly illuminate the surface and record pre-ablation image, 3) Perform either cryo- or RF- ablation, 4) Record fNADH post-ablation images for a specified period of time, 5) Switch to room light illumination to record post-ablation image, 6) Perfuse heart with 2,3,5-Triphenyl-2H-tetrazolium chloride (TTC, details below) and take surface and cross-sectional images of the lesions. For selected experiments, steps 2-5 were repeated on the other side of the heart to create additional lesions.
Ablation protocol
Cryoablation was performed using either a metal cryoprobe dipped in liquid nitrogen or by using a clinical Freezor cryoablation catheter controlled by a CryoConsole (Medtronic, MN). Cryoablation durations varied from 5 to 30 seconds (see supplementary table for details). When used, the cryoablation catheter was placed perpendicular to the epicardial surface. Radiofrequency energy was delivered using a non-cooled blazer catheter with a 4-mm tip (EP Technologies, Boston Scientific). The RFA catheter was placed perpendicular to the epicardial surface. Tip temperatures ranged between 50 to 70°C and ablation durations varied from 5 to 30 seconds with a maximum power of 8 watts (see supplementary table for details). This led to consistent RFA lesions without charring or steam pops8.
NADH fluorescence imaging
Since NADH is an endogenous fluorophore, no additional dye is required to visualize its presence in cardiac tissue. To record fNADH, the epicardial surface was illuminated using an LED spotlight with a peak wavelength of 365 nm (PLS-0365-030-S, Mightex Systems) unless specified otherwise. The emitted fNADH was bandpass filtered at 475 nm (Chroma HQ475/50) and imaged using a CCD camera at 1024x1024 resolution (Andor iKon-M DU934N-BV) fitted with a low magnification lens (Nikon Nikkor 50mm F/1.4). To illustrate that presence of blood between tissue and detector interferes with fNADH visualization, the excised heart with ablation lesion was immersed into a blood-filled beaker. Images were taken before and after blood was displaced from the heart surface using a transparent film of polyvinylidiene chloride. To obtain the percentage decrease in fNADH intensity across the lesion, values from three random pairs of regions of interest from ablated and nearby control tissue were averaged.
Dual NADH and potentiometric dye recordings
A dual imaging approach was used to colocalize changes in the amplitude of epicardial action potentials and ablation-induced loss of endogenous NADH fluorescence. Optical mapping was performed using the potentiometric dye RH237 ((N-(4-Sulfobutyl)-4-(6-(4-(Dibutylamino)phenyl) hexatrienyl) Pyridinium, Molecular Probes). A 50 μg aliquot of RH237 was resuspended in 0.1 mL of DMSO, vigorously vortexed for 10 minutes, and combined with 3 mL of Tyrode's solution. The latter was injected into a port at the base of the aortic block that contained an additional two milliliters of perfusate yielding a 20 μM RH237 concentration. To reduce motion artifacts, the motion uncoupler BDM (2,3-butanedione monoxime) was added to the perfusate at a final concentration of 20 mM. A dual optical mapping system comprising of two high frame rate cameras (Andor iXon DV860s) fitted with a dual-port adapter (Andor CSU Adapter Dual Cam) and a dichroic mirror (610 nm) was used to image the epicardial fluorescence of RH237 and NADH in the same field of view. fNADH fluorescence was recorded using filter settings described above. To record optical action potentials, the epicardial surface was illuminated using two light-emitting diodes (LumiLEDs, 530/35 nm). The resulting RH237 fluorescence was longpass filtered at 680 nm. RH237 fluorescence signals were smoothed using a median temporal filter (3 sample width) and the average amplitude of optical action potentials at each pixel was computed to reveal spatial changes in the amount of electrically active tissue.
Reflectance spectroscopy recordings
The epicardial surface of the heart was illuminated using a fiber optic guide connected to a spectrofluorometer (HORIBA Jobin Yvon FluoroMax-3). The illumination wavelength was gradually increased from 400 to 700 nm using a 5 nm slit width. The epicardial surface was continuously imaged throughout the experiment using an Andor iKon-M (DU934N-BV) camera without any filter in the optical path. The full image sequence was then imported into Andor Solis to extract the intensity values from specific regions of interest. Mean values were then normalized to the intensity of the illuminating light by placing a white reflectance standard (Thorn Labs, Spectralon SRS-99-010) within a field of view.
Effects of filter settings on fNADH-based image visualization
Both RFA and cryoablation lesions were placed next to each other on the epicardial surface of an excised, saline-perfused heart. Illumination through a fiber optic light guide connected to a spectrofluorometer (HORIBA Jobin Yvon FluoroMax-3) was tuned to either 365nm or 375nm using 20nm slit settings. The images were acquired using an Andor iKon-M (DU934N-BV) camera using either a 475/50nm or 450/70nm bandpass filters. Three illumination/bandpass filter combinations were then tested: 375/475, 375/450 and 365/475 nm. The spectral profiles of the bandpass filters were provided by the manufacturers. The spectral profiles of the illuminating light was obtained by directing the light guide toward a white standard and recording the reflected light spectrum using the spectrofluorometer.
TTC staining
2,3,5-Triphenyl-2H-tetrazolium chloride (TTC) staining is a standard procedure for assessing necrosis. It relies on the ability of dehydrogenase enzymes and NADH to react with tetrazolium salts to form a formazan pigment. Immediately after the imaging protocol, the tissue was Langendorff-perfused with Tyrode's solution containing 40 mM TTC. Afterward, the heart was submerged in the TTC solution for an additional 8 min. Metabolically active tissue appeared crimson, while necrotic tissue appeared white. The total surface area of the lesion was measured using ImageJ software package by an independent observer who took three independent area measurements for each lesion.
Statistical analysis
In total, 42 cryolesions and 12 RFA lesions in 22 rat hearts were analyzed to derive the quantitative and qualitative conclusions detailed in this article. The supplementary table lists the details and the total number of each experiments from which qualitative conclusions and/or quantitative results were drawn. Values are presented as mean +/- SD, except noted otherwise. The Wilcoxon signed rank test was used to compare the differences in mean values from ablated and control regions in the same animal. Spearman's correlation coefficient was used to evaluate the strength of relationship between two variables. Differences in reflected light values as function of wavelength were tested by a linear mixed model with repeated measures using SAS version 9.3.
Results
Appearance of cryoablation lesions in saline- and blood-perfused rat hearts
In both saline-perfused hearts and blood-perfused hearts, cryolesions were barely visible under incandescent illumination with only a small drop in signal intensity across the lesion (14 ± 4% in saline vs 16 ± 5% in blood). However, by using ultraviolet illumination (350-370nm) and collecting the emitted fluorescence within 450-500 nm range, we observed distinctly demarcated lesions in both blood-free and blood-perfused hearts - including in vivo beating hearts (Fig.1A & B, see right panels). The magnitude of the drop in fNADH signal intensity in blood-perfused preparations and blood-free preparations was the same (65±7% in blood perfused, vs 67±8% in saline perfused). Thus, the presence of the blood within the tissue did not interfere with visualization of cryolesions on the fNADH channel. This assumes, of course, that optically dense blood is displaced from the path between the camera and the heart surface (Fig.1C).
Figure 1.
Visualization of cryolesions in blood-free and blood-perfused preparations. A. Saline-perfused excised rat heart under incandescent room light and under 365nm illumination/475nm acquisition settings. Intensity profiles across dotted while lines for both images are shown in the right. Scale bar 2 mm. B. Color snapshot of cryoablated epicardial surface as seen in an open-chest animal under incandescent illumination. The same heart under 365/475nm settings showing two lesions: one ventral and one apical. Dot plot on the right compares % change in signal intensity under the two acquisition settings (n=7, p<0.05, scale bar 2 mm) C. When the ablated heart was immersed into a blood-filled beaker, the blood blocked the fNADH signal. However, displacement of blood using a transparent film enabled fNADH-based lesion visualization, pointing to the need for a transparent inflatable balloon to be included in future designs of fNADH imaging catheter.
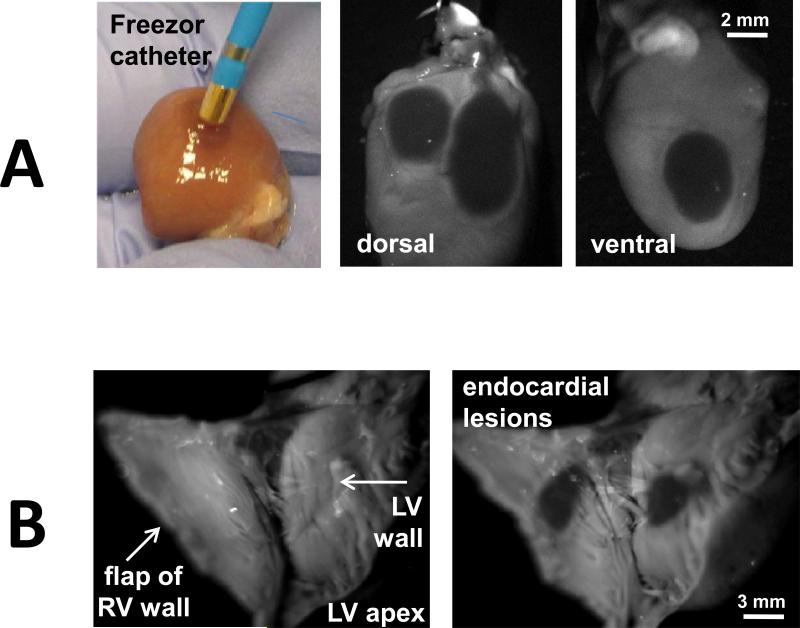
To show the clinical applicability of fNADH-based cryolesion visualization, we confirmed our findings using a Medtronic Freezor catheter (Fig.2A) to place cryoablation lesions on the endocardial surface of the heart (Fig.2B). In both cases, cryolesions were readily distinguishable on the fNADH channel with the loss of ~70% signal intensity at the lesion sites (69±2% and 71±3% respectively).
Figure 2.
Visualization of cryolesions made with a clinical catheter and on the endocardial surface. A. Left panel. Color snapshot of Freezor cryoablation catheter controlled by CryoConsole (Medtronic, MN) next to the cryoablated surface of a saline-perfused excised rat heart (incandescent room light). Right panel: The cryolesions as they seem on both sides of epicardial surface using fNADH imaging settings. Scale bar 2 mm. B. fNADH-based visualization of cryolesions on endocardial surfaces of saline-perfused excised rat ventricle. Scale bar 3 mm.
Time course of lesion formation
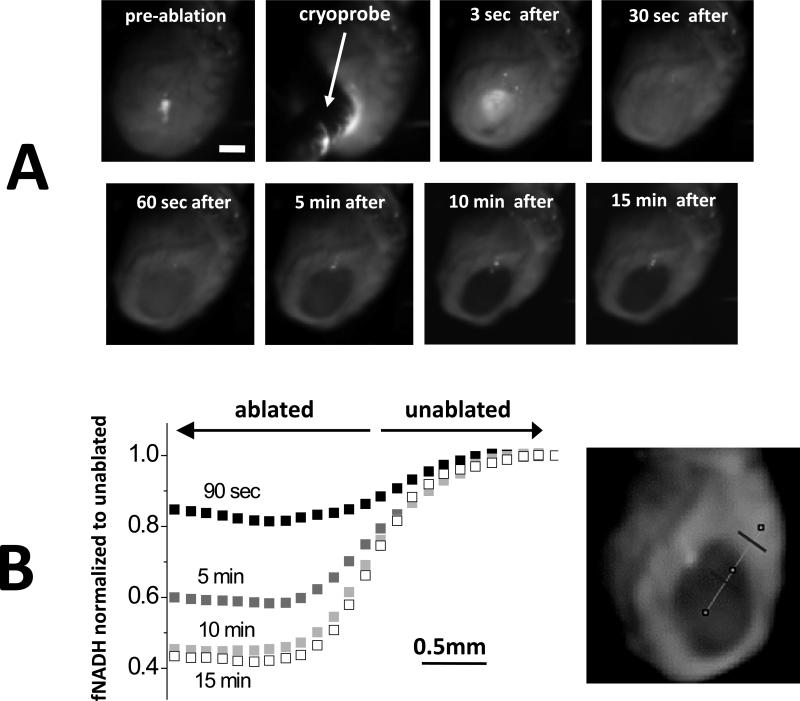
At the cryoinjury site, there was an immediate increase in signal intensity as tissue reflectance increased dramatically due to formation of ice crystals. As the tissue thawed, the reflectance fell below pre-ablation levels and a gradual loss of fNADH took place. Once the lesion was fully developed, it remained stable throughout the duration of the experiment. This is illustrated in Figures 3 and 4. Figure 3 shows individual snapshots at different points in time and fNADH traces across the lesion boundary during and immediately after cryoablation. Note again the initial whitening of the lesion, followed by a progressive decline in fNADH intensity. As a result, the difference in fNADH intensity values across the border of the lesion became more and more pronounced, yet the border location stayed static (Fig.3B). Figure 4 compares the time course of cryoablation lesion appearance to that of the RFA lesion. During the RFA, the signal started to decline during the ablation itself. In contrast, the site of cryolesion exhibited the abovementioned increase in signal intensity followed by a rapid loss of fNADH. Notably, when the perfusate is maintained at physiological temperatures, cryolesions became visually apparent on fNADH channel within 26±8 sec, making fNADH-based visualization applicable to real-time surgical monitoring of ablation efficacy.
Figure 3.
Spatiotemporal aspects of cryolesion formation on fNADH channel. A. Snapshots taken before, during, and after the cryoablation procedure as it was performed in excised rat heart perfused with 37°C Tyrode's solution. Scale bar 2 mm. B. fNADH intensity versus the distance from center of the lesion. The line of interest is shown on the right. Traces from 4 post-cryoablation time points are shown (90 sec, 5 min, 10 min, 15 min). Throughout the development of the lesion, the border region remains stable.
Figure 4.
Development of the lesion on the fNADH channel: cryoablation vs. RFA lesions. An illustrative experiment in which both types of lesions were placed on the epicardial surface of an excised rat heart perfused with 37°C Tyrode's solution. The snapshots show the epicardial surface at three time points (3 sec, 20 sec and 5 min) after detachment of the cryoprobe. Scale bar 2 mm. On either side of the cryolesion are RFA lesions that were placed on the surface of the rat heart shortly before cryoablation. See also Supplemental Movie 1. Normalized loss of fNADH was calculated as [f(x) – f(0min)]/[f(plateau) – f(0min)], where x stands for time and f is pixel intensity value.
Correlation of fNADH loss with necrotic tissue identified using TTC staining
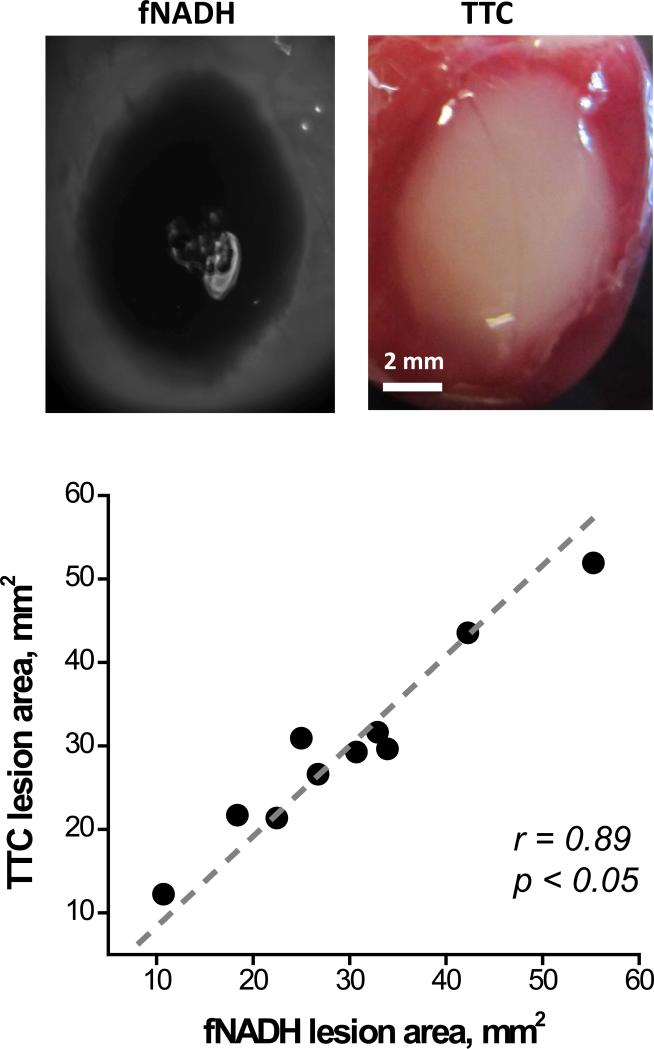
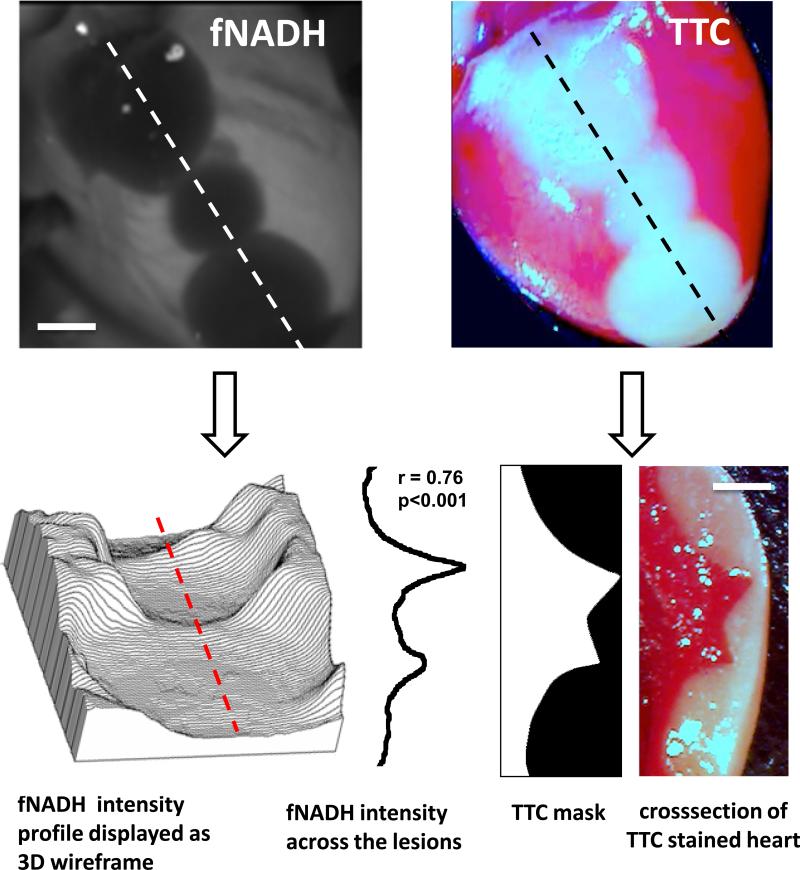
After completion of imaging experiments, the cryoablated hearts were perfused with the vital dye TTC (Fig.5). The latter is a standard staining technique used to distinguish between live and necrotic tissue. The surface area of the TTC-negative tissue directly correlated with the cryolesion surface area as seen on the fNADH channel (r=0.89, p<0.05). Moreover, when the cryoablated heart was TTC-stained and sliced transmurally, the cross-sectional profile of the lesion exhibited strong correlation with the depth profile derived from the epicardial fNADH image (r = 0.76, p<0.001). Indeed, although visually the lesions appear to be a uniform grey, when the fNADH intensity values are displayed as a 3D wireframe it enables direct visualization of lesion depth (Fig. 6).
Figure 5.
Quantitative comparison between the fNADH and the respective TTC staining in cryoablation lesions. Representative pair of fNADH and TTC images and correlation analysis for the total lesion area (n=10).
Figure 6.
Loss of epicardial fNADH correlates to cryolesion depth. fNADH and TTC images of the same heart with three cryolesions. Scale bar 2 mm. The topography graph on lower left represents the same fNADH image but as a 3D wire surface. The latter enables a better appreciation of ability of epicardial fNADH intensity to reveal lesion depth. Next to it is fNADH intensity profile measured along red dotted line. It closely correlates with the transmural TTC profile of the lesion.
Loss of electrical activity at the cryoablation lesion site
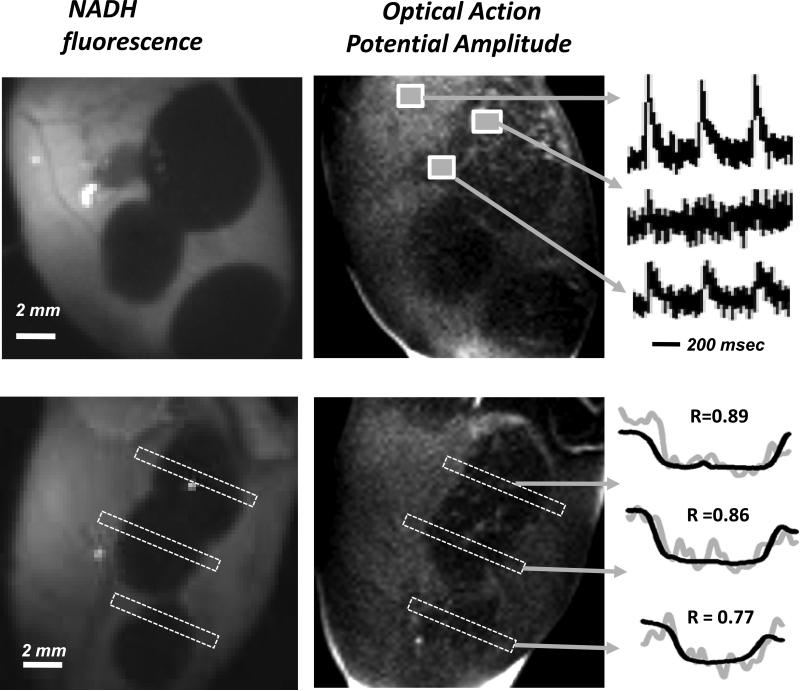
The primary reason to ablate viable tissue is to prevent the propagation of electrical activity. We used the voltage sensitive dye RH237 to reveal how much electrically active tissue remains at the ablated site and how this correlates with the loss of endogenous NADH. Figure 7 shows two examples of hearts with multiple cryolesions for which dual recordings of fNADH and transmembrane voltage were performed. A change in the RH237 signal intensity corresponds to a change in the transmembrane voltage yielding optical action potential (OAP) amplitude image. Representative OAPs from regions of interests corresponding to unablated tissue, lesion sites, and interlesional gaps are shown on the left. Statistical comparison of the spatial profiles of fNADH loss across the lesions to the amplitude of OAP revealed a close correlation between the two (p<0.001, Spearman's correlation coefficient for each lesion is shown above the two profiles). The decrease in OAP amplitude is an indication of less viable tissue contributing to the changes in RH237 intensity. Similarly to fNADH loss, it can serve as an indirect measure of lesion depth.
Figure 7.
Spatial correlation between bulk electrical activity and fNADH. Epicardial images of fNADH values and OAP amplitudes obtained from RH237 traces. The unablated tissue has both the highest fNADH and OAP amplitude values, whereas areas within the lesion are revealed by a flat depression on the fNADH channel and a loss of OAP amplitude. The representative OAP traces are shown in the right. The graphs on the lower right illustrate the degree spatial correlation between the two profiles for each lesion (note: OAP signal is much noisier due to the dynamic nature of these measurements).
Changes in tissue reflectance at the RFA and cryoablation lesion sites
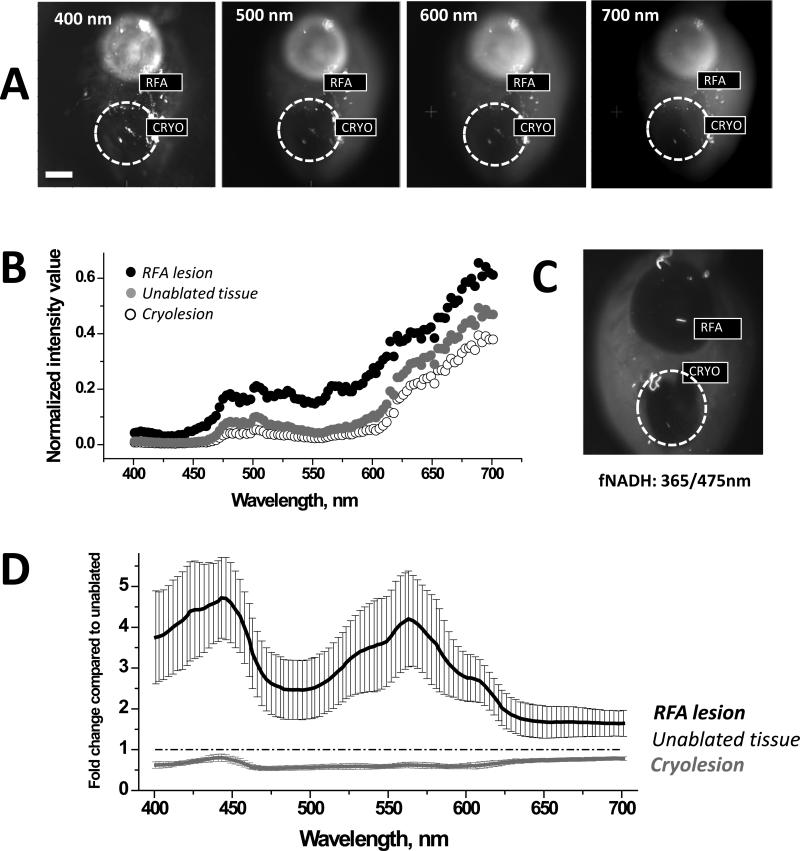
To quantify wavelength-specific changes in photon absorption and scattering, the entire surface of the heart with both types of lesions was illuminated using increasing wavelengths of light and the images were acquired without any filter in the optical path. The amount of reflected light from cryoablation sites was significantly lower, while from the RFA sites it was significantly higher for each tested wavelength within 400-700nm range of visible light (n=5, p<0.05). This is shown in Figure 8A&B using representative images and traces from an individual experiment. Figure 8D displays an average fold change in intensity values collected from ablated and unablated tissue. The latter enables a better appreciation of wavelength-specific changes in tissue reflectance across visible spectra.
Figure 8.
Comparison of reflectance traces from unablated tissue, RFA, and cryoablation lesions. A. Surface of a heart with both types of ablation lesions illuminated at different wavelengths. Images were acquired without any additional filters in the optical path. B. Intensity values collected from the heart shown in A. C. Corresponding fNADH image. D. Fold-change in reflected light intensity as compared to unablated tissue (mean +/− SEM, n=5)
Effect of filter settings on fNADH-based visualization of RFA and cryoablation lesions
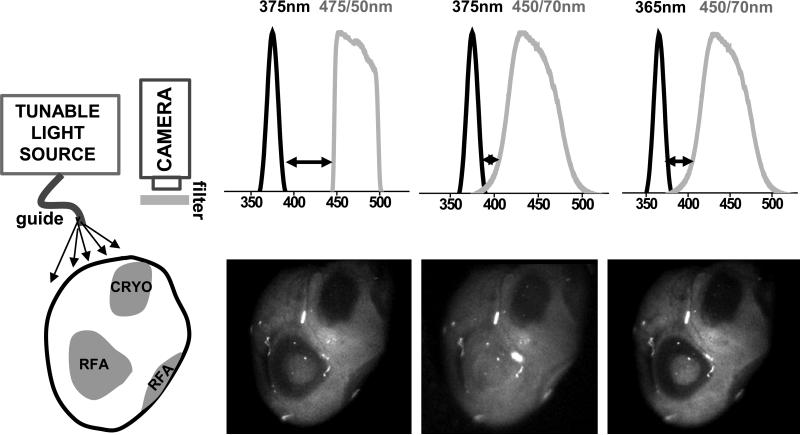
For RFA lesions visualization, the dramatic increase in tissue reflectance may obscure the loss of NADH fluorescence. This can happen when there is an overlap between the wavelengths of the excitation light and the light passing through the emission filter. This is less of a concern for cryolesions, since the amount of both types of photons – fluoresced and scattered – decreases. To illustrate this effect we conducted an experiment in which we used three different combinations of illumination and acquisition settings to record images from the same heart that had both types of lesions on its epicardial surface (Fig.9). The RFA lesion “disappeared” (4±7% drop in signal intensity, insignificant from surrounding unablated tissue) when imaged using the filter set that allowed for a small spectral overlap between the illuminating and collected light. In contrast, at the site of the cryoablation lesion, the decrease in fNADH remained substantial under all three illumination/filter combinations (69±5%, 55±9% and 71±5% drop in signal intensity at 375/475, 375/450 and 365/475nm settings respectively). The above information can be useful for implementation of fNADH-based lesion visualization in designs of future imaging catheters.
Figure 9.
Impact of altered reflectance on fNADH-based visualization of RFA and cryoablation lesions. Cartoon on the left shows the surface of a heart with both types of ablation lesions. The images illustrate the cryo- and RFA lesions appearance when different illumination/acquisition settings are used. Arrows point to different degrees of wavelength separation between illuminating light and bandpass filter in front of the camera. fNADH-based visualization of RFA lesions is more sensitive to crosstalk between the two due to a dramatic increase in tissue reflectance caused by protein denaturation. Bandpass emission filters used included a 475/50 (Chroma Technology Corp) and a 450/70 (Newport Corp).
Discussion
Pulmonary vein isolation with catheter ablation is an effective treatment in patients with symptomatic atrial fibrillation refractory or intolerant to antiarrhythmic medications9. Cryoballoon catheters have been approved for isolating pulmonary veins in patients with paroxysmal atrial fibrillation10. After thawing, cryoablation causes necrosis without drastic alterations in tissue structure11. When compared to RFA, it takes less time to accomplish a cryoballoon ablation procedure, and the lesions created are more homogenous with lower incidence of destruction of the surrounding vasculature12. Cryoablation is also known to be less thrombogenic and lead to more complete fibrosis of the lesion with better demarcated boundaries12,13.
The most common site of failed cryoballoon ablation is the inferior area of the veins where the atrial muscle sleeves extend into the pulmonary vein14. If occlusion of the vein by the balloon is not complete, a small blood leak around the balloon can lead to a gap in the ablation line. The latter is formed at the site of the contact between the cryoballoon and the orifice of the vein. Interlesional gaps can then lead to atrial fibrillation recurrence due to pulmonary vein reconnections15–17. Therefore, the ability to visually inspect the integrity of the ablation lesion border and to address remaining gaps while performing the ablation procedure would be highly beneficial.
The main goal of this paper was to demonstrate the feasibility of fNADH imaging to reveal gaps between the cryolesions. The second goal was to compare and contrast fNADH-based visualization of cryolesions to that of RFA lesions. Such information can be useful for designing future surgical catheters that incorporate fNADH-based monitoring of cardiac tissue viability.
The similarities between cryo- and RFA lesions included a high degree of correlation between the shape of the lesion observed on the fNADH-channel versus the actual necrotic area. The latter was identified using TTC, a standard marker of tissue necrosis which turns viable tissue crimson red and leaves the necrotic area white. Notably, a close correlation between the area as seen on the fNADH channel and after TTC staining was observed for both surface and transmural measurements of the lesions (Figs.5&6). Another similarity was stability of the lesion border as a function of time (Fig.3). Lastly, there was a direct correlation between the immediate loss of electrical activity and the fall in the fNADH intensity (Fig.7) – similar to what we observed for RFA lesions6.
Yet, there were two important differences. The first was the difference in the initial timeline of fNADH changes (Fig. 4). At the RFA site, fluorescence decreased during the ablation itself. In contrast, at the cryoinjury site, there was a transitory increase in signal intensity as diffuse reflectance dramatically rose due to the formation of ice crystals. This was followed by thawing and then fNADH loss at the cryoinjury site. The second major difference between the two types of ablation lesions is changes in tissue optical properties (Fig.8). RFA leads to a dramatic increase in tissue scattering. In contrast, across the entire visible spectrum, the overall amount of light reflected from the cryolesion site is lower than from surrounding unablated tissue, making cryolesions almost invisible to the naked eye, particularly in blood-perfused preparations. Therefore, the use of ultraviolet illumination to reveal otherwise ‘invisible’ cryolesions is particularly appealing.
After defrosting, the sites of cryolesions always looked slightly darker in both blood-perfused and blood-free hearts. The later observation is important because most of the darkening seen during cancer cryoresection is ascribed to hemorrhage. But because in our studies darkening was observed in both blood- and saline-perfused hearts, hemorrhage is an unlikely explanation. The main factor is a loss of highly organized myocyte fibrils resulting from freeze/thaw process. The latter has been shown to significantly decrease the scattering coefficient of cardiac muscle 18. Additionally, changes in hue can be ascribed to changes in myoglobin absorption spectra. Myoglobin is one of the major myocardial chromophores within the visible range and its absorption spectra and extinction coefficient depends on whether it is in its oxy-, met- or carboxymyoglobin form19,20. In live cells, metmyoglobin reductase converts metmyoglobin (using NADH as one of the co-factor) to myoglobin21. Upon cell necrosis this process is disrupted leading to a net accumulation of metmyoglobin that gives tissue a more brown hue. Finally, the tissue pH can also impact myoglobin's extinction coefficient and the pH within necrotic tissue is likely to be rapidly changing.
What are the advantages of fNADH imaging as compared to other methods? Indeed imaging modalities such as MRI22,23, C-arm CT24, and contrast echocardiography25 are excellent tools in detecting parameters resulting from thermally-induced physical changes. However, they all require contrast agents and have relatively poor resolution for the purpose of identifying lesions. Secondly, while a drop in fNADH occurs within seconds, MRI and C-arm CT could take up to 30 min to visualize cell necrosis. Echocardiography is faster but it suffers from low spatial resolution and a limited field of view. In addition, MRI, C-arm CT, and contrast echocardiography also require significant data processing. Recently, direct visualization of endocardial lesions has become possible. Newer catheters from CardioFocus26 and Voyage Medical27 displace blood using an inflatable balloon and catheter shroud respectively, and both use high intensity white light illumination to collect reflected and scattered light from the tissue. But because the endocardial surface of the atrium in humans has a significant collagen layer and is white in appearance, the contrast between the cryoablated and unablated tissue is expected to be minimal when direct white light illumination is used. In comparison, use of endogenous tissue fluorescence may provide greater contrast between unablated and ablated tissue.
Limitations
Applicability to large animals
Our preliminary data from placing cryoablation lesions on the endocardial surface of canine and porcine atria suggest that fNADH can enable visualization of cryolesions in fresh atrial tissue. More systematic studies, beyond the scope of this manuscript, need to be performed to fully determine the applicability of this approach in large animals and humans.
Lesion depth
The loss of the intensity on fNADH images exhibit strong correlation with cryolesion depth – up to 2 mm of tissue thickness based on our preliminary estimates. Since the reported thickness of human atria is about 1.5-2.5 mm28, fNADH imaging should provide useful information about lesion depth, although it might not be able to confirm lesion transmurality at all the sites.
Summary
We present the similarities and differences of fNADH-based visualization of cryoablation and radiofrequency ablation lesions. NADH is an endogenous molecule predominantly present in mitochondria that fluoresces when illuminated with UVA light. Due to the abundance of mitochondria in cardiac muscle, NADH loss provides sufficient contrast to delineate the lesion and provides functional information about the ablation site. The main goal of this technique is to enable real-time identification of ablation gaps to eliminate them during the ablation procedure. This should enhance procedural success and lead to lower AF recurrence rates. Integration of this imaging approach into a percutaneous catheter can allow in-surgery monitoring of the endocardial surface of the pulmonary vein area, reveal interlesional gaps, estimate the depth of lesions, and provide information about the functional state of the ablation lesions based on endogenous NADH fluorescence.
Supplementary Material
Acknowledgments
These studies were supported in part by the National Institutes of Health, the National Science Foundation and LuxCath, LLC (NIH/HL095828, NSF/CBET1231549, LuxCath-GWU Research Agreement). Dr. Sam Simmens and Maya Shimony are gratefully acknowledged for their advice on statistical methods.
This study was supported, in part, by the Sponsored Research Agreement between LuxCath, LLC and the George Washington University.
Footnotes
Conflict of Interest Disclosures: Disclosures for Drs. Kay, Mercader, and Sarvazyan include provisional patents (#61/537,798, #61/904,018) and stock options in LuxCath, LLC.
References
- 1.Haïssaguerre M, Shah DC, Jaïs P, Hocini M, Yamane T, Deisenhofer I, Chauvin M, Garrigue S, Clémenty J. Electrophysiological breakthroughs from the left atrium to the pulmonary veins. Circulation. 2000;102:2463–2465. doi: 10.1161/01.cir.102.20.2463. [DOI] [PubMed] [Google Scholar]
- 2.Wijffels MC, Kirchhof CJ, Dorland R, Allessie MA. Atrial fibrillation begets atrial fibrillation. A study in awake chronically instrumented goats. Circulation. 1995;92:1954–1968. doi: 10.1161/01.cir.92.7.1954. [DOI] [PubMed] [Google Scholar]
- 3.Brooks AG, Stiles MK, Laborderie J, Lau DH, Kuklik P, Shipp NJ, Hsu L-F, Sanders P. Outcomes of long-standing persistent atrial fibrillation ablation: a systematic review. Heart Rhythm. 2010;7:835–846. doi: 10.1016/j.hrthm.2010.01.017. [DOI] [PubMed] [Google Scholar]
- 4.Pappone C, Rosanio S, Oreto G, Tocchi M, Gugliotta F, Vicedomini G, Salvati A, Dicandia C, Mazzone P, Santinelli V, Gulletta S, Chierchia S. Circumferential radiofrequency ablation of pulmonary vein ostia: A new anatomic approach for curing atrial fibrillation. Circulation. 2000;102:2619–2628. doi: 10.1161/01.cir.102.21.2619. [DOI] [PubMed] [Google Scholar]
- 5.Baykaner T, Clopton P, Lalani GG, Schricker AA, Krummen DE, Narayan SM. Targeted ablation at stable atrial fibrillation sources improves success over conventional ablation in high-risk patients: a substudy of the CONFIRM Trial. Can J Cardiol. 2013;29:1218–1226. doi: 10.1016/j.cjca.2013.07.672. [DOI] [PMC free article] [PubMed] [Google Scholar]
- 6.Mercader M, Swift L, Sood S, Asfour H, Kay M, Sarvazyan N. Use of endogenous NADH fluorescence for real-time in situ visualization of epicardial radiofrequency ablation lesions and gaps. Am J Physiol Heart Circ Physiol. 2012;302:H2131–H2138. doi: 10.1152/ajpheart.01141.2011. [DOI] [PMC free article] [PubMed] [Google Scholar]
- 7.Defaye P, Kane A, Chaib A, Jacon P. Efficacy and safety of pulmonary veins isolation by cryoablation for the treatment of paroxysmal and persistent atrial fibrillation. Europace. 2011;13:789–795. doi: 10.1093/europace/eur036. [DOI] [PubMed] [Google Scholar]
- 8.Wittkampf FHM, Nakagawa H. RF catheter ablation: Lessons on lesions. Pacing Clin Electrophysiol. 2006;29:1285–1297. doi: 10.1111/j.1540-8159.2006.00533.x. [DOI] [PubMed] [Google Scholar]
- 9.Fuster V, Rydén LE, Cannom DS, Crijns HJ, Curtis AB, Ellenbogen KA, Halperin JL, Le Heuzey J-Y, Kay GN, Lowe JE, Olsson SB, Prystowsky EN, Tamargo JL, Wann S, Smith SC, Jacobs AK, Adams CD, Anderson JL, Antman EM, Hunt SA, Nishimura R, Ornato JP, Page RL, Riegel B, Priori SG, Blanc J-J, Budaj A, Camm AJ, Dean V, Deckers JW, Despres C, Dickstein K, Lekakis J, McGregor K, Metra M, Morais J, Osterspey A, Zamorano JL. ACC/AHA/ESC 2006 Guidelines for the Management of Patients with Atrial Fibrillation: a report of the American College of Cardiology/American Heart Association Task Force on Practice Guidelines and the European Society of Cardiology Committee for Practice. Circulation. 2006;114:e257–354. doi: 10.1161/CIRCULATIONAHA.106.177292. [DOI] [PubMed] [Google Scholar]
- 10.Packer DL, Kowal RC, Wheelan KR, Irwin JM, Champagne J, Guerra PG, Dubuc M, Reddy V, Nelson L, Holcomb RG, Lehmann JW, Ruskin JN. Cryoballoon ablation of pulmonary veins for paroxysmal atrial fibrillation: first results of the North American Arctic Front (STOP AF) pivotal trial. J Am Coll Cardiol. 2013;61:1713–1723. doi: 10.1016/j.jacc.2012.11.064. [DOI] [PubMed] [Google Scholar]
- 11.Whittaker DK. Mechanisms of tissue destruction following cryosurgery. Ann R Coll Surg Engl. 1984;66:313–318. [PMC free article] [PubMed] [Google Scholar]
- 12.Khairy P, Chauvet P, Lehmann J, Lambert J, Macle L, Tanguay J-F, Sirois MG, Santoianni D, Dubuc M. Lower incidence of thrombus formation with cryoenergy versus radiofrequency catheter ablation. Circulation. 2003;107:2045–2050. doi: 10.1161/01.CIR.0000058706.82623.A1. [DOI] [PubMed] [Google Scholar]
- 13.Wilber DJ, Pappone C, Neuzil P, De Paola A, Marchlinski F, Natale A, Macle L, Daoud EG, Calkins H, Hall B, Reddy V, Augello G, Reynolds MR, Vinekar C, Liu CY, Berry SM, Berry DA. Comparison of antiarrhythmic drug therapy and radiofrequency catheter ablation in patients with paroxysmal atrial fibrillation: a randomized controlled trial. JAMA. 2010;303:333–340. doi: 10.1001/jama.2009.2029. [DOI] [PubMed] [Google Scholar]
- 14.Fürnkranz A, Chun KRJ, Metzner A, Nuyens D, Schmidt B, Burchard A, Tilz R, Ouyang F, Kuck KH. Esophageal endoscopy results after pulmonary vein isolation using the single big cryoballoon technique. J Cardiovasc Electrophysiol. 2010;21:869–874. doi: 10.1111/j.1540-8167.2010.01739.x. [DOI] [PubMed] [Google Scholar]
- 15.Arentz T, Weber R, Bürkle G, Herrera C, Blum T, Stockinger J, Minners J, Neumann FJ, Kalusche D. Small or large isolation areas around the pulmonary veins for the treatment of atrial fibrillation? Results from a prospective randomized study. Circulation. 2007;115:3057–3063. doi: 10.1161/CIRCULATIONAHA.107.690578. [DOI] [PubMed] [Google Scholar]
- 16.Nanthakumar K, Plumb VJ, Epstein AE, Veenhuyzen GD, Link D, Kay GN. Resumption of electrical conduction in previously isolated pulmonary veins: rationale for a different strategy? Circulation. 2004;109:1226–1229. doi: 10.1161/01.CIR.0000121423.78120.49. [DOI] [PubMed] [Google Scholar]
- 17.Gerstenfeld EP, Callans DJ, Dixit S, Zado E, Marchlinski FE. Incidence and location of focal atrial fibrillation triggers in patients undergoing repeat pulmonary vein isolation: implications for ablation strategies. J Cardiovasc Electrophysiol. 2003;14:685–690. doi: 10.1046/j.1540-8167.2003.03013.x. [DOI] [PubMed] [Google Scholar]
- 18.Mesradi M, Genoux A, Cuplov V, Abi Haidar D, Jan S, Buvat I, Pain F. Experimental and analytical comparative study of optical coefficient of fresh and frozen rat tissues. J Biomed Opt. 2013;18:117010. doi: 10.1117/1.JBO.18.11.117010. [DOI] [PubMed] [Google Scholar]
- 19.Arakaki LSL, Burns DH, Kushmerick MJ. Accurate myoglobin oxygen saturation by optical spectroscopy measured in blood-perfused rat muscle. Appl Spectrosc. 2007;61:978–985. doi: 10.1366/000370207781745928. [DOI] [PubMed] [Google Scholar]
- 20.Swartling J, Pålsson S, Platonov P, Olsson SB, Andersson-Engels S. Changes in tissue optical properties due to radio-frequency ablation of myocardium. Med Biol Eng Comput. 2003;41:403–409. doi: 10.1007/BF02348082. [DOI] [PubMed] [Google Scholar]
- 21.Hagler L, Coppes RI, Herman RH. Metmyoglobin reductase. Identification and purification of a reduced nicotinamide adenine dinucleotide-dependent enzyme from bovine heart which reduces metmyoglobin. J Biol Chem. 1979;254:6505–6514. [PubMed] [Google Scholar]
- 22.Lardo AC, McVeigh ER, Jumrussirikul P, Berger RD, Calkins H, Lima J, Halperin HR. Visualization and temporal/spatial characterization of cardiac radiofrequency ablation lesions using magnetic resonance imaging. Circulation. 2000;102:698–705. doi: 10.1161/01.cir.102.6.698. [DOI] [PubMed] [Google Scholar]
- 23.Dickfeld T, Kato R, Zviman M, Lai S, Meininger G, Lardo AC, Roguin A, Blumke D, Berger R, Calkins H, Halperin H. Characterization of radiofrequency ablation lesions with gadolinium-enhanced cardiovascular magnetic resonance imaging. J Am Coll Cardiol. 2006;47:370–378. doi: 10.1016/j.jacc.2005.07.070. [DOI] [PMC free article] [PubMed] [Google Scholar]
- 24.Girard EE, Al-Ahmad A, Rosenberg J, Luong R, Moore T, Lauritsch G, Boese J, Fahrig R. Contrast-enhanced C-arm CT evaluation of radiofrequency ablation lesions in the left ventricle. JACC Cardiovasc Imaging. 2011;4:259–268. doi: 10.1016/j.jcmg.2010.11.019. [DOI] [PMC free article] [PubMed] [Google Scholar]
- 25.Khoury DS, Rao L, Ding C, Sun H, Youker KA, Panescu D, Nagueh SF. Localizing and quantifying ablation lesions in the left ventricle by myocardial contrast echocardiography. J Cardiovasc Electrophysiol. 2004;15:1078–1087. doi: 10.1046/j.1540-8167.2004.04087.x. [DOI] [PubMed] [Google Scholar]
- 26.Schade A, Krug J, Szöllösi A-G, El Tarahony M, Deneke T. Pulmonary vein isolation with a novel endoscopic ablation system using laser energy. Expert Rev Cardiovasc Ther. 2012;10:995–1000. doi: 10.1586/erc.12.86. [DOI] [PubMed] [Google Scholar]
- 27.Sacher F, Derval N, Jadidi A, Scherr D, Hocini M, Haissaguerre M, Dos Santos P, Jais P. Comparison of ventricular radiofrequency lesions in sheep using standard irrigated tip catheter versus catheter ablation enabling direct visualization. J Cardiovasc Electrophysiol. 2012;23:869–873. doi: 10.1111/j.1540-8167.2012.02338.x. [DOI] [PubMed] [Google Scholar]
- 28.Beinart R, Abbara S, Blum A, Ferencik M, Heist K, Ruskin J, Mansour M. Left atrial wall thickness variability measured by CT scans in patients undergoing pulmonary vein isolation. J Cardiovasc Electrophysiol. 2011;22:1232–1236. doi: 10.1111/j.1540-8167.2011.02100.x. [DOI] [PubMed] [Google Scholar]
Associated Data
This section collects any data citations, data availability statements, or supplementary materials included in this article.


