

Abstract
Individuals with alcohol and/or drug use disorders often fail to receive care, or evidence-based care, yet the literature shows health economic benefits. Comparative effectiveness research is emerging that examines approved approaches in terms of real, total healthcare cost/utilization. Comprehensive retrospective insurance claims analyses are few but tend to be nationally distributed and large. The emerging pattern is that, while treatment in general is cost effective, specific therapeutics can yield different health economic outcomes. Cost/utilization data consistently show greater savings with pharmacotherapies (despite their costs) versus psychosocial treatment alone. All FDA-approved addiction pharmacotherapies (oral naltrexone, extended-release naltrexone, acamprosate, disulfiram, buprenorphine, buprenorphine/naloxone, and methadone) are intended for use in conjunction with psychosocial management, not as stand-alone therapeutics; hence, pharmacotherapy costs must offer benefits in addition to abstinence alone or psychological therapy. Patient persistence is problematic, and (despite its cost) extended-release pharmacotherapy may be associated with lower or no greater total healthcare cost, mostly due to reduced hospitalization. The reviewed studies use rigorous case-mix adjustment to balance treatment cohorts but lack the randomization that clinical trials use to protect against confounding. Unlike trials, however, these studies can offer generalizability to diverse populations, providers, and payment models—and are of particular salience to payers.
Keywords: substance abuse, cost effectiveness, comparative effectiveness research, medication, agonist, antagonist, pharmaceutical industry
Introduction
The burden of alcohol and opioid dependence and the opportunity for better treatment
In worldwide burden of disease, alcohol use and drug use rank 5th and 19th, respectively, among the top 25 leading risk factors, and both burdens have only increased over the past two decades.1 The cost of excessive drinking was $223.5 billion in the United States in 2006 when it was last officially calculated, with most of this due to productivity losses, and 20% from healthcare and criminal justice costs.2 The cost of drug abuse was estimated in 2007 to be only slightly less, at $193 billion.3 Over 23 million Americans—9% of the U.S. population—suffer from alcohol and drug use disorders.4 Despite established psychosocial and pharmacological therapies, over 19 million go untreated each year.5
These disorders amplify the morbidity and costs of chronic conditions as far ranging as diabetes, depression, osteoporotic bone fracture, arthritis, headache, and lower back pain.6–9 When New York State documented more than $800 million in potentially preventable hospital readmissions (PPRs) in one year, patients with substance abuse had a PPR rate of 10.3 admissions per patient—more than double the 4.8 rate among patients without behavioral conditions.10 In studies, treatment consistently reduces the use of hospitals and emergency departments (ED).11–15 However, alcohol-dependence treatment ranks lowest in evidence-based practice among 25 health and behavioral health conditions.16
Beyond the crisis in the adoption of evidence-based treatment in general, even more scarce is the adoption of pharmacologic therapeutics.17–19 This shortcoming flies in the face of persistent U.S. government recommendations of pharmacotherapy as the standard of care in alcohol and opioid dependence.20,21 Underutilization persists with all of the medications approved by the U.S. Food and Drug Administration (FDA). There are four agents for treating alcohol dependence: acamprosate, disulfiram, oral naltrexone (NTX-PO), and extended-release naltrexone (XR-NTX; VIVITROL®). There are also four agents for treating opioid dependence: the μ-opioid agonist, methadone; the partial agonist, buprenorphine (including the buprenorphine–naloxone combination); and two opioid antagonists, NTX-PO and XR-NTX.
In a nationally representative survey supported by the National Institute on Drug Abuse (NIDA) of 345 privately funded addiction treatment centers, only one in four reported using pharmacotherapy for alcohol dependence and only one in three reported use of pharmacotherapy for opioid dependence.22 Similarly, among the 154 programs in the NIDA Clinical Trials Network, less than 20% of the programs used any of the alcohol-dependence agents and only 10% of patients with opioid dependence received any medication.23 Multiple obstacles have been identified that underlie these findings, including problems in funding, medical staffing, logistical support, education, attitudes,24,25 and patients’ poor adherence to oral agents.26–31 Poor adherence (usually covert) is a critical obstacle because it leads providers to conclude that the agent doesn't work. Less than half of alcohol-dependent patients obtain a refill beyond their initial NTX-PO prescription, and only 14% are adherent over a 6-month period;32,33 persistence with acamprosate and disulfiram is similar to NTX-PO.34,35 All currently approved agents are oral formulations intended for daily self-administration, except XR-NTX, which is a once-monthly intramuscular injection.36
Review of the literature
Health economic study paradigms
There is a growing literature on the health economics of addiction therapeutics. Multiple approaches exist, starting with cost estimation, which optimally includes all relevant expenses, such as counseling, detoxification and rehabilitation services, medications, laboratory tests, and other interventions.37 From the perspective of payers, real-world cost estimation is important. Cost estimation is a starting point for health economic analysis; however, actual costs are better, and decision making requires considering not only costs but also outcomes.
Health economists employ four categories of microeconomic analyses: cost-minimization analysis, cost-effectiveness analysis, cost–benefit analysis and cost–utility analysis. Cost-minimization analysis is useful when treatments are equivalent in efficacy and evaluators are simply interested in which is cheaper; health benefits are not converted into economic terms. Cost-effectiveness analysis examines the cost of a treatment in relation to a unit of health outcome (e.g., dollars per nonheavy drinking day) or per patient who achieves a composite of good clinical outcomes. Treatments can be compared with this approach, which can calculate the incremental cost-effectiveness ratio (ICER), which is the cost difference between two treatments divided by their difference in health improvement. There is no standard threshold for ICERs as yet, and the tool is even controversial in U.S. policy owing to concerns that it may be used for rationing health care.38 Cost–benefit analysis converts both expenditures and health outcomes into monetary values, enabling a direct comparison of the costs of the program with its incremental consequences in commensurate units of measurement. Cost–utility analysis is a related technique that is the health improvement variable in nonmonetary terms, such as quality-adjusted life years (QALYs) or disability-adjusted life years gained. The validity and sensitivity of these utility models to diseases such as addiction, which have complex social effects beyond health itself, are still evolving.39,40
Health economics often considers results from clinical trials because economists can compare different treatments in terms of both estimated cost and effectiveness in research endpoints, often with a high degree of precision. Clinical trial cost effectiveness, however, may not translate into cost savings in the real world, because real-world care is crucially different from research—with much poorer treatment adherence, more diverse sample characteristics (e.g., patients willing to undergo randomization may be more motivated), and far less intensive patient management (such as research assistant monitoring and subject incentive payments)—all of which substantially affect outcomes. Instead, from the perspective of payers, analyses of health insurance claims are often most relevant. Claims from administrative databases lack disease behavior data such as substance use but include comprehensive utilization data. This is advantageous in at least two ways. First, the use of administrative data, unlike trial data, avoids healthcare utilization data obtained via patient recall, which have been found to introduce significant discrepancies.41,42 Second, clinical trial endpoints focus on reduced use or abstinence from single-drug categories (e.g., opioids), which may miss substitution of the drug of choice with other substances of abuse,43 whereas insurance data would incorporate the net utilization burden even from unrecognized drug transitions.
Insurance claims analyses examine the real outcomes of community-based treatments and are used to generate either the actual mean cost of health care, cost savings, cost–benefit or cost offset. Other meaningful outcomes, such as the broader societal impacts of crime reduction, may not be sufficiently compelling to payers to foster reimbursement.44 Real, total healthcare cost subsequent to initiation of a therapeutic is probably of greatest interest from the perspective of a payer stakeholder, when that stakeholder has the burden of paying for a policyholder's total health care.45
Economic benefits in earlier studies
Studies of alcohol- and opioid-dependence treatment in general have consistently demonstrated cost benefit and effectiveness. Psychosocial treatments for alcohol disorders have shown cost effectiveness in a large, randomized study of different treatments in the United Kingdom.46 Studies have demonstrated that substance abuse treatment can reduce ED utilization and hospital admissions.47,48 Well-controlled trials have found decreases in total healthcare utilization and substantial economic benefits for most treatment approaches that have been studied.49,50 Methadone, for example, has shown cost–benefit ratios of 1:4 (i.e., $4 in benefit for each $1 spent on the treatment), and calculations have ranged as high as 1:18.51,52 The ICER for methadone maintenance has been calculated at $5915–11,000 per QALY, which is comparable to many well-accepted treatments for other diseases.53,54 In terms of cost-effectiveness analyses in general medicine, this indicates a good return on societal investment.55
The number of studies is limited, however. Many reports have been based on estimates rather than actual costs, clinical trials rather than real-world outcomes, non-U.S. data, short-term durations, and comparisons of a single agent versus placebo, rather than across the full range of approved agents. Some studies—for example, a large Veterans Administration (VA) system-wide study—failed to find net healthcare cost reductions.56 A 2011 systematic review across all published studies in alcohol-dependence treatment found only seven studies of behavioral therapies and two studies of acamprosate, both from outside of the United States.57 These nine studies found that the individual treatment approaches were associated with benefit-to-cost ratios of 1.89–39.00. Brief intervention approaches showed the greatest cost benefit, but these focus on patients with fewer severe conditions (i.e., abuse or hazardous use). Another systematic review in 2012 reported a total of seven studies reporting economic evaluations of individual alcohol-dependence pharmacotherapies or their combinations, all of which showed marked benefit or cost savings; however, there were important gaps in these comparisons that warranted substantial further research.40
While available studies have examined treatment in general or specific single-treatment approaches, there have been only a limited number of comprehensive, comparative pharmacoeconomic analyses.57 In alcohol dependence, the National Institute on Alcoholism and Alcohol Abuse (NIAAA) sponsored COMBINE, a large (n = 1383), nine-celled, prospective, cost-effectiveness study.58 This comparison examined combined counseling and medication approaches: medical management (MM; a brief, primary care-oriented model) or MM plus combined behavioral intervention (CBI; a moderately intensive specialty treatment incorporating motivational interviewing with 12-step facilitation and cognitive behavioral therapy), in combination with either daily oral placebo or placebo-controlled NTX-PO, acamprosate, or the combination of both agents. In a microcosting analysis of all treatment expenses (labor, medication, laboratory, and real estate), the study reported the incremental cost per percentage point increase in drinking behaviors and per good clinical outcome. NTX-PO plus MM and CBI showed the best efficacy, compared to seven other treatment combinations, and the best combinations of cost and efficacy were NTX-PO plus MM and the combination of NTX-PO, acamprosate, and MM.58 The study, however, did not calculate economic savings. A subsequent analysis found that, when patient financial outlays and time expenditures were added, MM and NTX-PO showed the best combination of efficacy and cost.59
Since these reviews and the COMBINE study, comprehensive health–economic comparative studies have emerged. Such studies are of considerable interest to payers and policymakers, and they may be important to providers, too, because economic outcomes may provide insights beyond what is available from clinical outcomes. In the era of healthcare reform, substance abuse and mental health treatment parity, and health information technology, the health economics of addiction therapeutics becomes increasingly feasible to study and critical to society's dual objectives of improved quality of care and resource management. Comprehensive health–economic studies comparing all FDA-approved agents are now available for both alcohol dependence and opioid dependence.
Comprehensive comparison across alcohol dependence therapeutics
Three pharmacoeconomic studies of the treatment of alcohol dependence have examined the full range of approaches and agents that are currently approved and available in the United States. Prospective, randomized trials are not available; however, naturalistic experiments (i.e., retrospective insurance claims analyses that compare total healthcare utilization and costs across therapeutics using insurance claims) have been published.
Study 1
Mark et al.60 studied adults who were diagnosed with alcohol dependence and whose health-utilization data were stored in the multistate MarketScan® commercial insurance claims database (Thomson Reuters Inc., Chicago, Illinois). In this analysis, sponsored by Alkermes, Inc. (Waltham, Massachusetts), patients were not prospectively randomized, but rather chose or were prescribed their respective treatments naturalistically. The investigators therefore sought to balance group differences that could potentially bias the outcomes. The study performed an a priori case-mix adjustment between the groups (n = 12,480) beginning 6 months before the index treatment. This case-mix adjustment consisted of propensity score–based matching and inverse probability weighting using 13 different demographic, socioeconomic, insurance coverage, diagnostic, comorbidity, and chronicity variables. The outcomes examined all healthcare service utilization, with a focus on the most expensive ones (i.e., inpatient admissions). In the 6 months following the beginning of the index treatment, the 2977 patients who had received an FDA-approved medication (compared to 2977 nonmedicated patients) had significantly and substantially fewer inpatient detoxification days (706 vs. 1163 days per 1000 patients; P < 0.001), fewer alcoholism-related inpatient days (650 vs. 1086; P < 0.001) and fewer alcoholism-related ED visits (127 vs. 171; P = 0.005; see Fig.1).
Figure 1.
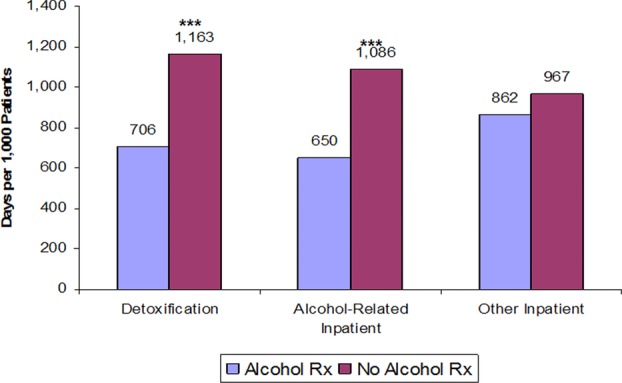
Six-month inpatient utilization with and without alcohol-dependence medication.60 Alcohol Rx and no alcohol Rx: Patients who either filled a prescription for an FDA-approved alcohol treatment medication or did not fill any such prescriptions. ***P < 0.01.
The group that received one of the four FDA-approved pharmacologic agents was then divided into patients who received NTX-PO (n = 2064), oral disulfiram (n = 2076), oral acamprosate (n = 5068), or XR-NTX (n = 295). The investigators employed the same case-mix adjustment methods and a statistical approach designed to cope with the cohort size differences. Over the next 6 months, 224 inpatient detoxification days were paid for per 1000 patients for XR-NTX, 552 days with NTX-PO (P = 0.001 vs. XR-NTX), 403 days with disulfiram (P = 0.049), and 525 days with acamprosate (P < 0.001).
Alcoholism-related inpatient hospitalizations (e.g., for alcoholic pancreatitis or cirrhosis) over 6 months were estimated at $1,818,292 per 1000 patients treated with an alcoholism medication versus $3,037,374 without medication (P < 0.001). Among the four agents, the group receiving XR-NTX had the fewest inpatient days over the next 6 months (137 days per 1000 patients) versus NTX-PO (229 days; P = NS), and significantly fewer than patients receiving disulfiram (372 days; P = 0.004) or acamprosate (435 days; P < 0.001). No significant differences were found in nonalcoholism-related hospitalizations or ED visits.
On average, when inpatient detoxification days were converted to estimated hospital charges, XR-NTX was associated with significantly lower detoxification costs ($600,000 per 1000 patients over 6 months) versus NTX-PO ($1,480,000; P < 0.01), disulfiram ($1,080,000; P = 0.05), or acamprosate ($1,400,000; P < 0.01). Meanwhile, in contrast to the inpatient utilization patterns, more patients in the XR-NTX group had outpatient substance abuse visits versus those in the groups treated with oral agents. While the study was retrospective (i.e., group differences may not entirely have been controlled for and relationships may not necessarily be causal) and the sample was limited to commercial insureds, with costs being estimated (from actual utilization), the conclusion was that patients who received an alcoholism medication had overall lower healthcare utilization versus untreated patients, and XR-NTX was associated with lower healthcare utilization and costs versus approved oral medications.60
This study also revealed an inverse utilization pattern among the four medication groups between inpatient and outpatient services. During the 6-month postindex period, compared to patients on oral agents, XR-NTX patients had significantly less inpatient utilization, but significantly more had at least one outpatient substance abuse visit—a desirable trade-off, both clinically and economically. In contrast, nonmedicated patients utilized more outpatient care than medicated patients but failed to show the inverse relationship between increased outpatient and decreased inpatient care. This paradox fits with the hypothesis that engagement in outpatient care should yield inpatient use reduction, but perhaps only if the outpatient treatment comprehensively addresses both the psychosocial and biologic aspects of alcohol dependence. This is consistent with the guidelines of the NIAAA that psychosocial and medication approaches address “different aspects of alcohol dependence: neurobiological, psychological, and social” in a complementary fashion.61
Study 2
Bryson et al. subsequently conducted a similar 6-month, multistate, retrospective commercial claims study in alcohol dependence (n = 11,515).62 This study, sponsored by Aetna Behavioral Health, had several advantages: it examined longitudinal treatment persistence, real (vs. estimated) costs (for all utilization except addiction medications), and oral medications or psychosocial therapy within a single regression analysis; it compared real utilization and costs within each subject during the 6 months before treatment versus postindex claim periods; and it was conducted independently of any pharmaceutical company, in partnership with a U.S. national healthcare insurer, Aetna. Patients had initiated pharmacotherapy with either psychosocial therapy only (n = 6374), disulfiram (n = 1043), NTX-PO (n = 1408), acamprosate (n = 2479), or XR-NTX (n = 211). Again, the statistical model was designed to manage such sample size differences. Compared to patients who received only psychosocial therapy, alcohol use disorder medications were prescribed to patients who were older and sicker. Patients receiving XR-NTX started with more comorbid diagnoses and more costly pretreatment expenditures. Baseline group differences were controlled for using demographics and pretreatment physical health, mental health and drug abuse comorbidities in the repeated-measures analysis, which compared outcomes within-subjects during the pretreatment versus postindex claim 6-month periods.
Figure2 shows the longitudinal persistence results among the four approved agents. Patients treated with acamprosate or disulfiram were more likely to discontinue those agents than patients taking NTX-PO (P < 0.05), and these were more likely to discontinue than XR-NTX-treated patients (P < 0.05). Comparing the 6-month periods from pretreatment to postindex claim, nonpharmacy healthcare spending actually increased for the group that received only psychosocial therapy. Compared with psychosocial therapy only, spending in the XR-NTX group decreased nearly $2700 per patient (P < 0.01). Calculating the difference in differences (i.e., difference across therapeutics in terms of their respective pre- vs. posttreatment changes), the XR-NTX group showed the lowest utilization of hospital days versus psychosocial treatment alone and versus the oral pharmacotherapies, and significantly so versus psychosocial treatment alone (P < 0.05) and disulfiram (P < 0.05). Consequently, nonpharmacy healthcare costs decreased most in the XR-NTX group. Compared with utilization levels before the index treatment, one inpatient admission (with 5 days average length of stay) was prevented in the postindex treatment phase: for every two patients on XR-NTX, for every five on oral medication, and for every 13 patients receiving only psychosocial treatment. While this study was also limited by the lack of direct clinical outcome measures, retrospective design and the possibility that the repeated measures method could have suffered from regression to the mean, the consistency of the findings and the similarity to those of Mark et al.60 are notable.
Figure 2.
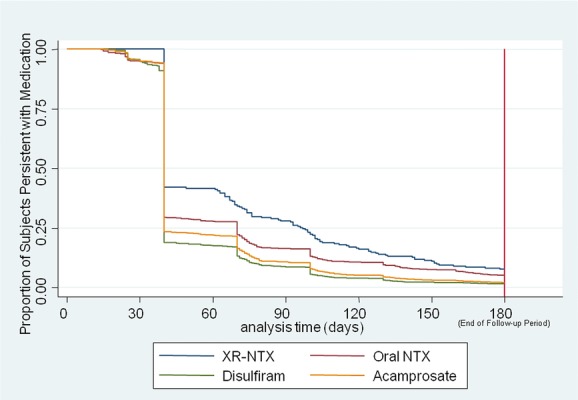
Survival plots: persistence on FDA-approved agents for alcohol dependence.62 NTX, oral naltrexone; XR-NTX, extended-release naltrexone. Kaplan–Meier survival curve, adjusted for covariates. Groups were case-mix adjusted for demographics (sex, age, region, beneficiary status, plan type); pretreatment-phase physical health comorbidities over 6 months (Charlson score); pretreatment drug abuse comorbidities; and pretreatment mental health comorbidities (schizophrenia, bipolar, major depression, and anxiety).
Study 3
This largest cost study to date (n = 25,878), assessing the cost of treating alcohol dependence across all approved therapeutics, was conducted by Baser et al. and sponsored by Alkermes, Inc.63 This also examined a large, multistate, commercial health insurance plan, combined with the IMS PharMetrics Integrated Database. This study had the strength of including all medical and pharmacy claims, including the actual costs of the medications themselves. The case-mix adjustment examined baseline age, sex, region, comorbidity scores, socioeconomic status, baseline period healthcare utilization, and costs. This analysis used logistic regression to estimate propensity scores, and while several interaction variables were constructed, they were not determined to be significant. The study performed two analyses, one with 20,752 adults, of whom half received an FDA-approved medication for alcohol dependence and half received only psychosocial care, and a parallel comparison with patients who received one of the four FDA-approved agents: acamprosate (n = 8958), disulfiram (n = 3492), NTX-PO (n = 2391), or XR-NTX (n = 661).
Compared to nonpharmacologic treatment, medication was associated with fewer admissions of all types. Over the next 6 months, nonmedicated patients used more days in detoxification facilities (3497 vs. 483 days per 1000 patients; P < 0.0001); had more psychiatric diagnoses postindex (3.19 vs. 3.07; P < 0.0001); and had more admissions for alcohol-related (660 vs. 202; P < 0.0001) and nonalcohol-related (407 vs. 257; P < 0.0001) hospitalizations per 1000 patients. As a result of these disparities in intensive healthcare utilization, despite the cost of the medications themselves, total healthcare costs, including inpatient, outpatient, and pharmacy costs, were 30% lower for patients who received a medication versus nonmedicated patients (P < 0.0001; Fig.3).
Figure 3.
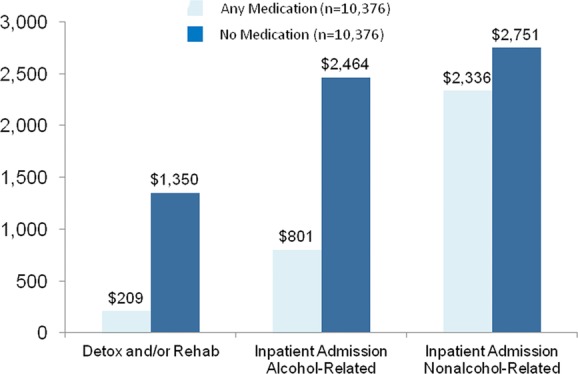
Six-month inpatient costs with and without alcohol-dependence medication.63 Medications include oral naltrexone (NTX-PO), disulfiram, acamprosate, and extended-release naltrexone (XR-NTX).
Comparing across the four medication groups, baseline raw data showed the XR-NTX group to be intermediate in health indices, comorbidity, utilization, and health costs; differences across the groups were subsequently controlled using propensity-score matching, which also manages differences in cohort sizes. Among the four medications, the greatest persistence with refills, fewest hospitalizations, and lowest hospital costs occurred with XR-NTX. An inverse relationship emerged between refill persistence and hospitalization, which has not previously been demonstrated. Patients persisted with acamprosate for a mean of 42.6 days, with disulfiram for 45.8 days, with NTX-PO for 49.8 days, and with XR-NTX for 61.6 days (Fig.4A). The sequence of days in detoxification per 1000 patients, however, fell in the opposite direction: acamprosate 741 days, disulfiram 429 days, NTX-PO 361 days, and XR-NTX 227 days (Fig.4B).
Figure 4.
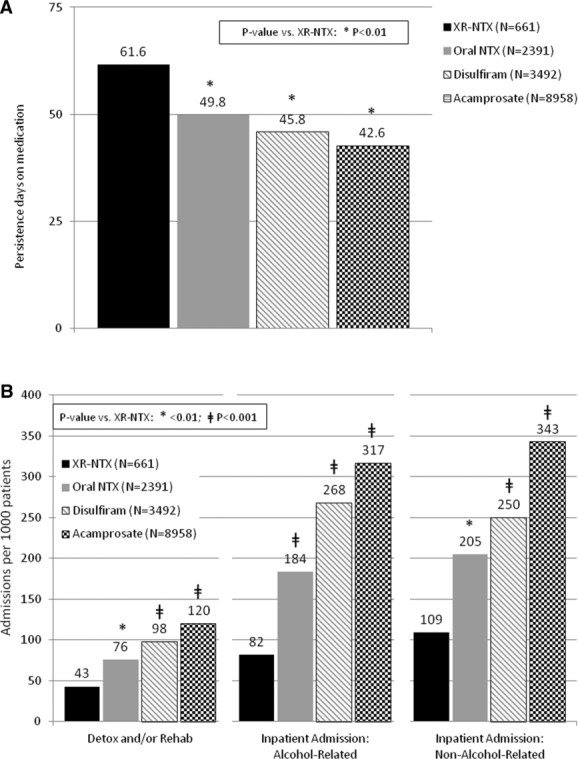
Six-month persistence with alcohol-dependence agents and detoxification use.63 (A) Persistence across all approved agents. (B) Days in detox per 1000 patients.
As a result of this utilization pattern, inpatient costs over the next 6 months per patient for detoxification and rehabilitation were $288 for acamprosate, $203 for disulfiram, $192 for NTX-PO, and $105 for XR-NTX (P < 0.01 for all vs. XR-NTX); for alcohol-related hospitalizations: $1,166 for acamprosate, $874 for disulfiram, $618 for NTX-PO, and $474 for XR-NTX (P < 0.0001 for all vs. XR-NTX); and for nonalcohol-related admissions: $3885 for acamprosate, $1498 for disulfiram, $1,091 for NTX-PO, and $730 for XR-NTX (P < 0.0001 for all vs. XR-NTX). Interestingly, this inverse relationship between refill persistence and hospitalization closely follows the burden of medication administration: acamprosate requires two pills three times per day, disulfiram requires one pill per day, NTX-PO requires one pill per day or two pills every other day, and XR-NTX involves one injection per 30 days.
This study also had the limitations of being retrospective, limited to commercial insureds, and focused on utilization rather than direct measures of clinical outcomes or adverse events. Nevertheless, the impacts of both clinical benefits on abstinence and adverse events are presumably captured in utilization and cost outcomes, and the study did include the full costs of health care including the alcohol-dependence therapeutics. Despite the variation in medication costs, total healthcare costs were not significantly different between NTX-PO, disulfiram, or XR-NTX, and XR-NTX patients’ total costs were 34% lower than those with acamprosate (P < 0.001).
Comprehensive comparison across opioid-dependence therapeutics
Opioid-dependence therapeutics have also been studied as a group in retrospective health–economic analyses. The costs of treatment administration can be higher for methadone than for other approaches, because of U.S. federal regulation requirements of licensed methadone maintenance clinics, as opposed to the office-based prescribing of buprenorphine, which was authorized by the Drug Abuse Treatment Act of 2000.64 Rosenheck and Kosten modeled the potential costs of buprenorphine treatment in 2001, and estimated that the office-based distribution of buprenorphine would therefore make its cost lower than methadone, despite the lower cost of generic methadone itself.65
This prediction was found to be true in a VA-funded study of methadone (n = 8191) versus buprenorphine (n = 606) treatment in the VA during 2005.66 Substance use disorder treatment costs for buprenorphine amounted to $5535 per patient over 6 months versus $5908 for methadone (P = NS). The mean cost of healthcare for the 6 months after treatment initiation for buprenorphine was $11,597 versus $14,921 for methadone (P < 0.001). Methadone costs might be lower, however, if it was permitted in an office-based setting, rather than in the currently regulated clinic-based environment.67
A larger Robert Wood Johnson Foundation–funded study of opioid-dependent Massachusetts Medicaid beneficiaries treated over a 5-year period (n = 33,923) examined the costs of drug relapses and mortality with buprenorphine, methadone, drug-free treatment, or no treatment.68 This intent-to-treat analysis adjusted for case-mix pretreatment differences using demographics, coverage type, comorbidity, overall illness burden, and prior treatment history. The odds of a hospitalization, ED visit, or detoxification admission compared to the reference treatment, buprenorphine, were three times higher with nontreatment, 25% higher with nonmedicated treatment, and 28% lower with methadone (P < 0.0001 for all comparisons). The annual cost per opioid-dependent patient, however, was $1330 lower with buprenorphine versus methadone. The cost advantage of buprenorphine versus methadone was essentially unchanged regardless of whether short-term buprenorphine treatment cases were included or not. The difference was largely due to longer hospitalizations for methadone patients, even after case-mix adjustment. Mortality rates were similar between buprenorphine and methadone, but 75% greater with drug-free treatment, and more than double among untreated individuals, versus buprenorphine. Importantly, this study also found that patients tended to not transition between these treatments, suggesting that, regardless of health economic findings, patient (and/or provider) preference is a strong factor that may impede randomized trials and must be taken into account in policy planning.
A comprehensive study of nonmedication approaches and all four FDA-approved agents69 included the same large, multistate, commercial insurer database as in the preceding alcohol dependence study by Baser et al.,63 combined with data from the IMS PharMetrics national commercial pharmacy database (n = 17,171). This study, supported by Alkermes, Inc., compared the records of 6658 patients who received services without an opioid-dependence pharmacotherapy versus an equal number who filled a claim for an FDA-approved agent. Again, the treatment groups were case-mix adjusted before performing the outcome analysis. The investigators used propensity scores based on the 6-month period before treatment with a logistic regression model predicting which patients should belong to each group, using covariates that included age, gender, geographic region, socioeconomic-status variables, comorbidities, healthcare utilization, and costs. On the basis of each patient's propensity score, a nearest neighbor 1:1 match was performed, followed by a baseline analysis to determine whether balanced cohorts were generated. This method has shown the ability to eliminate up to 85% of the bias from unbalanced cohort distributions.35
Medication was associated with less inpatient detoxification and residential rehabilitation use and fewer general hospitalizations. Compared with patients who did not fill medication prescriptions, the medicated group had significantly fewer inpatient detoxification days (4758 vs. 447 per 1000 patients), opioid-related (111 vs. 677) and nonopioid-related (292 vs. 731) admissions (all P values < 0.0001). Lower rates of hospitalizations translated into lower 6-month hospitalization costs per patient for the medication group (vs. nonmedicated): for detoxification and/or rehabilitation ($205 vs. $2083) and for opioid-related ($381 vs. $1823) and nonopioid-related ($2928 vs. $4184) hospitalizations (all P values < 0.0001). Despite the costs of the medications themselves, which were included in the analysis, the 6-month sum of all healthcare costs was 29% ($4161) lower per medicated patient ($10,192) versus those treated without medication ($14,353; P < 0.0001).
The comparison across the four opioid-dependence medications included 1916 methadone patients, 7596 treated with a buprenorphine preparation, 845 with oral NTX, and 156 with XR-NTX. Upon examining baseline differences, there was a higher proportion of older patients among the methadone group; male, eastern United States, higher socioeconomic status residents among the XR-NTX group; and psychiatrically and medically comorbid patients among all groups relative to buprenorphine patients. During the 6-month preindex period, methadone patients had higher total healthcare costs versus buprenorphine patients, while the oral NTX and XR-NTX groups were intermediate. The average XR-NTX patient had more pre-index detoxification admissions (a common approach to initiating antagonist therapy) but admissions for other hospitalizations were not significantly different from methadone patients. These baseline differences required the use of instrumental variable analysis for case-mix adjustment, in part because the data were obtained before XR-NTX became FDA approved. Instrumental variable analysis, unlike propensity-score matching or multivariate regression, can be used to control for sources of bias that are both observed (e.g., SES) and unobserved (in this case, motivation or preference, as reflected in prescribing patterns in which some physicians and patients almost exclusively preferred agonist maintenance agents while others were willing to expend the effort to secure reimbursement authorization for a not-yet-approved extended antagonist).
Results showed that mean refill persistence among the four groups ranged from 55.0 to 68.9 days, with no significant differences. There was a highly significant difference, however, with NTX-PO versus XR-NTX in terms of percent of patients who maintained a prescription for at least 80% of the study days (8% vs. 21%; P < 0.0001). The real difference in adherence was most likely greater, since patients in possession of an NTX-PO prescription may not necessarily have taken it, whereas once the XR-NTX injection has been given, the medication remains in the body for approximately 30 days. Whereas NTX-PO has generally not been found to be more effective than placebo, owing to poor adherence,70 XR-NTX patients in this study showed significantly less hospital utilization. NTX-PO admissions for opioid-related hospitalizations were 145 versus 93 with XR-NTX (P < 0.005); for nonopioid-related hospitalizations, the difference was 387 versus 284 (P < 0.03) per 1000 patients over 6 months. Thus, this study found the same inverse relationship in the different naltrexone formulations between persistence and outcome in opioid dependence as was found with alcohol dependence.62,63
The percentage of patients who possessed their medication for at least 80% of the 6-month study duration was 34% with buprenorphine, significantly greater versus XR-NTX (21%; P = 0.01), and there was a trend for methadone to be greater, 29% versus XR-NTX (21%; P = 0.10). This may reflect patient satisfaction, treatment effectiveness, and/or the fact that both agonist agents maintain opioid physical dependence and result in symptoms of withdrawal upon cessation.71
Figure5A shows the mean number of inpatient detoxification/rehabilitation admissions per 1000 patients. The four groups did not differ significantly (methadone 101; buprenorphine 79; oral NTX 84; XR-NTX 69).69 Significant differences were found, however, in opioid-related admissions per 1000 patients (e.g., for heroin injection complications such as cellulitis or endocarditis): methadone 198, buprenorphine 249, NTX-PO 145 and XR-NTX 93 (P < 0.05 for all vs. XR-NTX). Similar differences were found in admissions per 1000 patients for hospitalizations that did not receive an opioid-related diagnostic code (although these may have included undiagnosed opioid dependence and must therefore also be considered): methadone 561, buprenorphine 397, NTX-PO 387, and XR-NTX 234 (P < 0.05 for all vs. XR-NTX).
Figure 5.
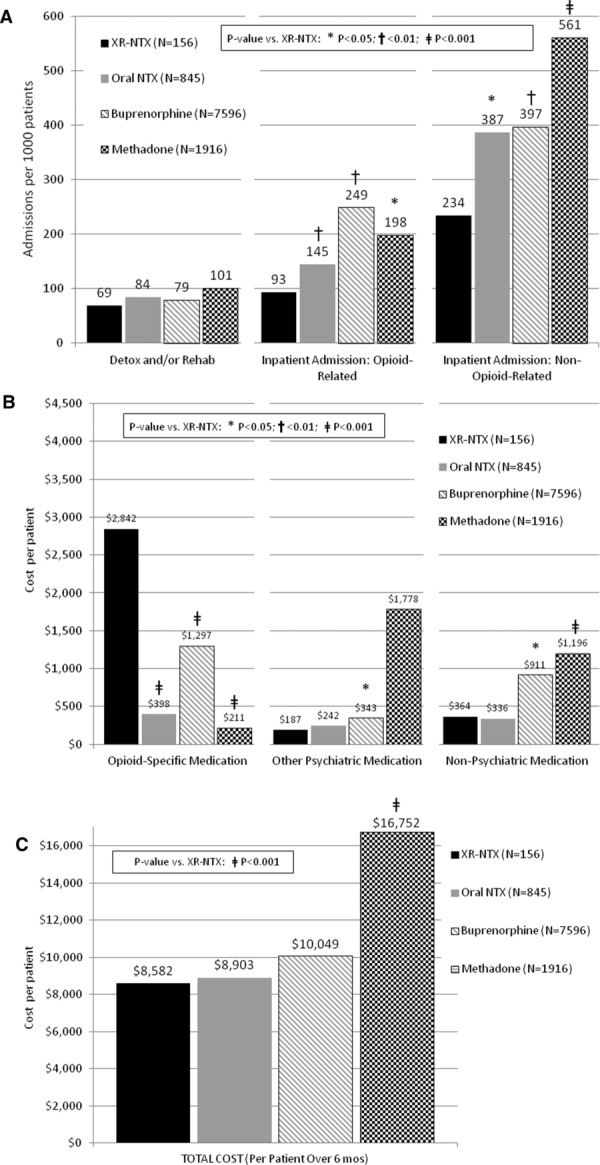
(A) Inpatient admissions per 1000 patients: 6-month outcomes. (B) Pharmacy costs per patient: 6-month outcomes. (C) Total cost per patient (inpatient + outpatient + pharmacy).69
While the actual drug cost (Fig.5B) was lowest for methadone ($211) and highest for XR-NTX ($2,842; P < 0.0001 for XR-NTX vs. all others), when all healthcare costs per patient were totaled over the 6-month period (Fig.5C), there were no significant differences between buprenorphine ($10,049), oral NTX-PO ($8903), or XR-NTX ($8582); however, overall care for methadone patients ($16,752) was nearly twice as expensive as for patients who received XR-NTX (P < 0.0001).
Limitations in this retrospective study include the same issues as in the previously mentioned reports; however, this study may have involved greater baseline cohort differences, many of which may have been unobserved: for example, regional differences in access to methadone and buprenorphine, differences in reimbursement, and attitudes and motivation toward agonist versus antagonist therapies. Commercial insurers may not routinely cover methadone maintenance therapy;72 nevertheless, the proportion of patients in this study in treatment with methadone versus buprenorphine is similar to proportions seen nationally, where most methadone coverage is publicly supported. Of the 270,881 patients who are enrolled in publicly funded opioid treatment programs in the United States, 98.5% receive methadone.73 The annual cost for delivering the full complement of methadone services (sometimes omitted in studies, which therefore substantially neglect the actual cost) ranges from $2000 to $15,682, depending upon the related services provided,66,67 and the federal government reports an average cost of $4700/year.74,75 Baser et al.,69 however, found that combined costs for methadone plus opioid-related physician and psychosocial services were much less, suggesting a possible underestimation of methadone versus XR-NTX costs. Furthermore, opioid maintenance treatment is recommended for long-term use; however, the mean among these insured patients was under 90 days—and a 6-year follow-up study found that patients who had received fewer than 90 days of methadone maintenance did no better than untreated patients.76 Statistical efforts to control for these differences did address unobserved bias but may still have been imperfect. Differential cohort sizes and large variances in cost events may also introduce problems; however, the pattern of comparisons showed relatively good internal consistency, supporting the validity of the findings.
Discussion
Although prior research has shown cost effectiveness for psychosocial treatment alone,46 the net result of these studies is that both alcohol- and opioid-dependence treatment with pharmacotherapy are associated with lower overall healthcare costs than when no pharmacotherapy is utilized. Opioid-dependence pharmacotherapy has previously been shown to be particularly cost effective56,77 and appears in the studies described above to also be somewhat more beneficial than alcohol-dependence pharmacotherapy, although the effect ranges are within the same order of magnitude, and therefore both disorders warrant these approaches. The comparative findings are remarkably consistent across multiple studies with different populations, benefit plans, and analytic approaches. The findings indicate that in the 6 months after initiation of treatment for alcohol dependence and opioid dependence, overall healthcare costs are highest with treatment that omits pharmacotherapeutic agents, lower among patients who receive these agents, and no more expensive with extended-release medication than with daily oral agents (and in some cases less expensive). These cost differences primarily appear due to reduced hospital utilization, which was lowest in patients treated with XR-NTX.
Limitations
Limitations of retrospective claims analyses derive primarily from the absence of randomization, confounding outcomes with the different baseline characteristics and prognoses between cohorts and risking issues of internal and potentially external validity,78 which limits conclusions regarding causality. Randomized trials, however, have their own constraints, particularly in generalizability. Trials usually involve highly specialized investigator teams, and nonroutine research procedures designed to enhance retention. Trials recruit only patients who are open to study treatments with equanimity (not necessarily common among patients68). Trials also often exclude key populations (e.g., those with medical and psychiatric comorbidity). Retrospective studies are limited in their ability to elucidate mechanisms, as they usually cannot analyze changes in alcohol or opioid use, abstinence, severity, or overdose, although utilization and cost outcomes do incorporate much of the health effects of these disease behaviors and states.
Studies involving commercial insureds may not reflect the larger treatment population insured by the public sector state block grants, Medicaid, or the VA. The similarity of findings between studies in Medicaid69 and commercial populations,68 however, is reassuring. The role of commercial insurance is in flux, however, with between one-third and two-thirds of public treatment addiction programs now receiving commercial insurance funding and the National Drug Control Strategy recommending increasing this role.79
Not all of these studies calculated the costs of the treatment agents, although two of the four did include these costs,63,69 and the utilization patterns were similar between these two and the remaining two studies.60,62 The 6-month time frame studied in these reports does not capture impacts from longer term recovery outcomes or relapse events and health deterioration. Patients’ healthcare coverage may change if they leave a plan or become incarcerated—or their data may be inaccessible if they retain coverage during incarceration.
The size of the healthcare utilization–reduction effect in studies of such large populations is also an important question, beyond mere statistical significance. Hartung et al. examined effect size in a meta-analysis across these studies, and managed their similar but nonidentical outcome variables by pooling their standardized mean difference (SMD) using Hedge's g to estimate effect sizes (where 0.2 represents a small, 0.5 a moderate, and 0.8 a large effect).80 Relative to all FDA-approved agents across both alcohol- and opioid-dependence studies, XR-NTX was associated with significantly less inpatient substance-related utilization. This decreased hospitalization was fairly consistent. In alcohol dependence, hospitalization reductions with XR-NTX ranged in SMD from −0.10 (95% CI −0.20–0.00) versus NTX-PO to −0.12 (95% CI −0.20 to −0.04) versus disulfiram. In opioid dependence, the reduction with XR-NTX in SMD ranged from −0.19 (95% CI −0.35 to −0.02) versus methadone to −0.24 (95% CI −0.42 to −0.07) versus NTX-PO. Thus, while effect size differences could be small in a single utilization area, the pattern of differences across multiple utilization categories could be sufficient to nullify initial higher costs for XR-NTX or even make its overall healthcare costs substantially lower than some alternatives.
The costs of these agents are also in flux. The comprehensive studies reported above include the actual costs expended, so changes in charges were included; however, studies that use estimates must take into account actual changes, and past costs or savings must be adjusted in order to serve extrapolation to the future, given the emergence of, for example, more expensive buprenorphine film, less expensive sublingual generics, and decreasing average XR-NTX costs as Medicaid coverage increases across states.
Finally, this discussion does not consider issues that may be important in determining translation into practice. There are important differences between utilization and clinical outcomes; one is complementary to the other. Adoption of parenteral medication shows an increasing trend but a slow one, owing to barriers such as provider concerns (lack of knowledge and upfront costs) and complex logistics (the need for refrigeration and specialty pharmacy ordering). Medications involve potential side effects, which include physical dependence, overdose in combination with other drugs, and discontinuation withdrawal and relapse with agonists and injection-site reactions, pain management challenges, and posttreatment overdose with antagonists. These may inhibit adoption onto formularies and use as first-line treatments. The pharmacoeconomics of potential harms has not been discretely analyzed in these studies, although other research has reported cardiac risks with LAAM (resulting in its withdrawal from the market) and methadone compared to buprenorphine.81 While the costs of adverse events are embedded in the reported data on hospital and emergency admissions in this study, the specific incidence and costs of adverse events is an opportunity for future research.
Importance of treatment adherence
Treatment retention and adherence are well-established predictors of longer term treatment outcome. Opioid-dependent patients who do not take at least 80% of their days of prescribed buprenorphine have over 10 times the risk of relapse of adherent patients.82 Agonist agents are recommended as long-term treatments; however, in a commercial insurance retrospective analysis, only 27% of patients persisted with buprenorphine through 6 months, and a follow-up assessment of pharmacy costs failed to show significant savings, owing to ongoing opioid medication use.83 In the opioid-dependence study by Baser et al.,69 patients maintained XR-NTX, buprenorphine, or methadone prescriptions for only 60–70 days on average, with no significant difference between the three groups. Some might consider this duration far from sufficient, in particular given that the agonists are commonly defined as maintenance medications and a large multisite trial found that over 90% relapsed within 8 weeks following a 3-month buprenorphine regimen.71 XR-NTX's FDA indication does not define it as a maintenance treatment, however, and its optimal duration of use has not yet been studied.
Posttreatment effects
The data also do not specifically analyze what happens after discontinuation of treatment—a question that is also generally not explored in clinical trials. This concern is addressed somewhat in these data, since persistence with pharmacotherapeutic agents lasted for approximately 1.5 to 2.5 months, thereby leaving the majority of the 6-month study time essentially uncovered by medication. This also appears to reflect real-world use; although agonist maintenance therapies are usually recommended for long-term use, this is not consistently the case. On the other hand, antagonists do not involve withdrawal-precipitated relapse,71 and treatment durations remain subject to individualized clinical considerations.
The only retrospective claims analysis study to examine outcomes after treatment was concluded with a pharmacotherapy was a small study (n = 48) of a single agent, independently funded and performed by Horizon Blue Cross Blue Shield of New Jersey84 following the introduction of XR-NTX. In a 6-month pre- versus posttreatment period (i.e., excluding the period of actual treatment), XR-NTX–treated patients experienced 52% lower costs in alcohol-related hospitalization, 34% lower total medical costs, and 36% lower total pharmacy costs, resulting in a total pharmacy and medical cost decrease of 49% (P < 0.05).
Policy implications
In view of these studies, many features of current resource management in the United States appear self-defeating. According to these data, cost-cutting practices, such as limiting coverage to only the least expensive therapeutics, fail-first policies, restricting the number of treatment episodes, pharmacy budget segmentation, or carve outs, may yield higher costs or greater morbidity, if hospitalization can be regarded as a proxy for morbidity. In two large, real-world comparative studies, the low-cost agent, methadone, was significantly more expensive than higher priced alternatives in terms of total healthcare costs.68,69 Plans that require a patient to fail first on oral medications before becoming eligible for extended-release formulations may inadvertently aggravate hospitalization rates and costs. Restricting patients to a limited number of treatments may prevent a patient from accessing a new or previously untried but effective agent. Segmenting the pharmacy budget coverage to only generic or low-cost agents may reduce the pharmacy budget—at the greater expense of the hospitalization budget. Carving out addiction services from general healthcare costs would potentially have missed the savings in general hospital utilization and costs that was afforded by these addiction pharmacotherapeutics. Even basing cost effectiveness on savings or offsets at a single facility are likely to be shortsighted because research has suggested that overall savings for a patient may accrue to multiple provider sites or systems.56 This segmentation of the cost burden may have been partly responsible for a 30% reduction in VA medical spending on substance abuse treatment during 1998–2006, despite a 26% increase in the number of substance use–disordered veterans.56
Net healthcare cost savings, however, may not be the only justification for the reimbursement of addiction therapeutics. Such a standard is not imposed on the treatment of other diseases, such as coronary artery disease or diabetes. This is the basis for a public policy position taken by the American Society of Addiction Medicine decrying discrimination against medication-assisted treatment.85 Societies pay for treatment of diseases even when the cost of a life saved or improved is high. It behooves planners to avoid demands of cost savings, as such a threshold may reflect stigmatization and moralism, but not modern health economic practice.
Given these findings, it may behoove pharmaceutical companies to proactively establish cost–benefit findings in order to achieve effective payer coverage. Two independently sponsored studies mentioned above62,84 led major U.S. insurers to not only cover XR-NTX reimbursement but also to investigate new disease management models to improve access to care. The long-held reluctance by the treatment field to adopt pharmacotherapies suggests that both pharmaceutical companies and payers may need to develop training, tools, incentives, and accountability measures to help providers adopt these agents—not only so that patients benefit from existing options but also to achieve economic viability for pharmaceutical investment in research and development of future addiction therapeutics.
Conclusions
The current pool of comparative studies that are comprehensive across all addiction therapeutics is still relatively modest; however, in aggregate, the studies include a sample size exceeding 60,000 patients, and involve multiple states, insurers, diagnostic groups (i.e., alcohol- vs. opioid-dependence disorder), case-mix adjustment methods, statistical approaches, and both industry and independent sponsorships. Given this diversity of contexts, the pattern in these findings for both alcohol and opioid dependence is highly consistent. This consistency implies internal validity. The size and range of the samples studied implies external validity for insured populations. The findings suggest that optimal investment of healthcare dollars in those addiction treatments that are most likely to be effective is the strategy that is likely to yield the lowest overall healthcare cost results. Patients in all of these studies who received medication bore pharmacy costs; however, overall healthcare costs were significantly and substantially less than in nonmedicated patients. Similarly, patients treated with the newer extended-release agent had higher initial costs in the pharmacy budget, but total healthcare costs that were no greater (or lower, vs. acamprosate- and methadone-treated patients), with less morbidity (using hospitalization rates as a proxy) than other approaches. Although many other factors must be considered, in aggregate, these findings do not support budget devices such as least expensive-agent requirements, fail-first thresholds, restricted treatment episodes, stand-alone pharmacy budgeting, or carve-out plan management in addiction treatment.
Future research
Health economics has the potential for substantially changing the process of addiction treatment and improving its quality, but there is a pressing need for more health economic research. This need is particularly acute in opioid dependence, with longer studies, and studies that focus on the aftermath of treatment with addiction pharmacotherapeutics. There are other types of economic variables that should be examined, such as cost effectiveness and cost utility. Cost-effectiveness analysis expresses the cost of a treatment in units such as dollars per reduced heavy drinking day or increased abstinence days; however, measurement of such variables is best suited to clinical trials rather than naturalistic effectiveness studies such as insurance claims analyses. In cost-utility analysis, health improvement is measured in terms of the increase in QALYs. This type of research should ideally examine 5- to 10-year time frames, rather than the 6- to 12-month durations of clinical trials or claims analyses.
Randomized efficacy trials are important but may not be generalizable to practice or policy. Comparative research that utilizes insurance claims data addresses this external validity need, provides answers regarding effectiveness, and can directly affect reimbursement coverage and other policy needs.86 Future studies should focus on the public sector population, including patients treated via the state block grant program, Medicaid, and Medicare. In opioid dependence, where patients may have strong preferences for either the direct transition to agonist therapy or detoxification and antagonist therapy, but not for both, it may be difficult and even inappropriate to conduct random-controlled trials.68 In fact, both approaches may be needed, and it will be important for studies to identify patient characteristics that predict which options yield optimal clinical and economic outcomes.
Studies have generally failed to examine the societal perspective—a problem common to studies throughout medicine,87 but one with particular relevance in addiction, given its impact on employment and crime. The latter may have the largest potential for cost benefit, followed by economic benefit from employment.88 Studies should also examine the indirect cost benefits to health such as decreased mortality and improvements in quality of life40,57 and the costs from family disturbances and injuries and property damages from crashes and accidents.89
The dearth of health economic research on crime reduction is particularly regrettable,40 since a full year of imprisonment in the United States averages $24,000 per offender,75 and criminal victimization adds to the overall societal cost.3 The United States spent $74 billion on substance-involved adult and juvenile offenders in 2005 but less than 1% of that—$632 million—on prevention and treatment.90 Historically, policy has not been rationally disposed in this area, but studies have demonstrated that investing in treatment saves many times its cost in reduced crime, unemployment, and welfare.44,91
A potential watershed in the economically based opportunity for improving addiction treatment is the convergence of three enormous legislative initiatives: the Wellstone-Domenici Mental Health Parity and Addiction Equity Act of 2008, the Health Information Technology for Economic and Clinical Health (HITECH) Act of 2009, and the Patient Protection and Affordable Care Act (ACA) of 2010. The growing ranks of health-insured Americans, early prison releases of tens of thousands with alcohol- and opioid-related offenses, and the increasing pressure of risk-sharing fiscal models are all intense economic drivers of change.92,93 As a result, awareness of the human and economic cost-savings opportunity with addiction therapeutics is on the rise.94,95
Acknowledgments
XR-NTX (VIVITROL) was developed with support from NIDA Grant R43DA013531 and NIAAA Grant N43AA001002 and is manufactured by Alkermes, Inc.
Conflicts of interest
The author was a full-time employee of Alkermes, Inc., Waltham, Massachusetts, at the time this manuscript was written.
References
- Murray CJ, Lopez AD. Measuring the global burden of disease. N. Engl. J. Med. 2013;369:448–457. doi: 10.1056/NEJMra1201534. [DOI] [PubMed] [Google Scholar]
- Bouchery EE, Harwood HJ, Sacks JJ, et al. Economic costs of excessive alcohol consumption in the U.S., 2006. Am. J. Prev. Med. 2011;41:516–524. doi: 10.1016/j.amepre.2011.06.045. [DOI] [PubMed] [Google Scholar]
- National Drug Intelligence Center (NDIC) The Economic Impact of Illicit Drug Use on American Society. Washington, DC: United States Department of Justice; 2011. [Google Scholar]
- Office of the National Drug Control Policy (ONDCP) 2013. National drug control strategy http://www.whitehouse.gov//sites/default/files/ondcp/policy-and-research3/ndcs_2013.pdf. Accessed on August 14, 2013.
- Substance Abuse and Mental Health Services Administration. Results from the 2012 National Survey on Drug Use and Health: summary of national findings. Rockville, MD: Substance Abuse and Mental Health Services Administration; 2012. Report No.: NSDUH Series H-44, HHS Publication No. (SMA) 12–4713. [Google Scholar]
- Berg KM, Kunins HV, Jackson JL, et al. Association between alcohol consumption and both osteoporotic fracture and bone density. Am. J. Med. 2008;121:406–418. doi: 10.1016/j.amjmed.2007.12.012. [DOI] [PMC free article] [PubMed] [Google Scholar]
- Howard AA, Arnsten JH, Gourevich MN. Effect of alcohol consumption and drug abuse on diabetes mellitus: a systematic review. Ann. Intern. Med. 2004;140:211–219. doi: 10.7326/0003-4819-140-6-200403160-00011. [DOI] [PubMed] [Google Scholar]
- Mertens J, Lu Y, Parthasarathy S, et al. Medical and psychiatric conditions of alcohol and drug treatment patients in an HMO: comparison with matched controls. Arch. Intern. Med. 2003;163:2511–2517. doi: 10.1001/archinte.163.20.2511. [DOI] [PubMed] [Google Scholar]
- Sullivan LE, Fiellin DA, O'Connor PG. The prevalence and impact of alcohol problems in major depression: a systematic review. Am. J. Med. 2005;118:330–341. doi: 10.1016/j.amjmed.2005.01.007. [DOI] [PubMed] [Google Scholar]
- Lindsey M, Patterson W, Ray K, Roohan P. Statistical Brief #3: Potentially Preventable Hospital Readmissions among Medicaid Recipients with Mental Health and/or Substance Abuse Health Conditions Compared with All Others. Albany, NY: New York State Department of Health, Division of Quality and Evaluation, Office of Health Insurance Programs; 2007. [Google Scholar]
- Holder H, Longabaugh R, Miller WR, Rubonis AV. The cost-effectiveness of treatment for alcoholism: a first approximation. J. Stud. Alcohol. 1991;52:517–540. doi: 10.15288/jsa.1991.52.517. [DOI] [PubMed] [Google Scholar]
- Finney JW, Monahan SC. The cost-effectiveness of treatment for alcoholism: a second approximation. J. Stud. Alcohol. 1996;57:229–243. doi: 10.15288/jsa.1996.57.229. [DOI] [PubMed] [Google Scholar]
- McLellan AT, Lewis DC, O'Brien CP, Kleber HD. Drug dependence a chronic medical illness: implications for treatment, insurance and outcomes evaluation. JAMA. 2000;284:1689–1695. doi: 10.1001/jama.284.13.1689. [DOI] [PubMed] [Google Scholar]
- Parthasarathy S, Weisner C, Hu TW, Moore C. Association of oupatient alcohol and drug treatment with health care utilization and cost: revisiting the offset hypothesis. J. Stud. Alcohol. 2001;62:89–97. doi: 10.15288/jsa.2001.62.89. [DOI] [PubMed] [Google Scholar]
- Weisner C, Mertens J, Parthasarathy S, et al. Integrating primary medical care with addiction treatment: a randomized controlled trial. JAMA. 2001;286:1715–1723. doi: 10.1001/jama.286.14.1715. [DOI] [PMC free article] [PubMed] [Google Scholar]
- McGlynn EA, Asch SM, Adams J, et al. The quality of health care delivered to adults in the United States. N. Engl. J. Med. 2003;348:2635–2645. doi: 10.1056/NEJMsa022615. [DOI] [PubMed] [Google Scholar]
- Knudsen HK, Ducharme LJ, Roman PM. Early adoption of buprenorphine in substance abuse treatment centers: data from the private and public sectors. J. Subst. Abuse Treat. 2006;30:363–373. doi: 10.1016/j.jsat.2006.03.013. [DOI] [PubMed] [Google Scholar]
- Ducharme LJ, Knudsen HK, Roman PM. Trends in the adoption of medications for alcohol dependence. J. Clin. Psychopharmacol. 2006;26:S13–S19. doi: 10.1097/01.jcp.0000246209.18777.14. [DOI] [PubMed] [Google Scholar]
- Knudsen HK, Ducharme LJ, Roman PM. Buprenorphine adoption in the National Drug Abuse Treatment Clinical Trials Network. J. Subst. Abuse Treat. 2009;37:307–312. doi: 10.1016/j.jsat.2008.12.004. [DOI] [PMC free article] [PubMed] [Google Scholar]
- Center for Substance Abuse Treatment. Incorporating Alcohol Pharmacotherapies Into Medical Practice. Treatment Improvement Protocol (TIP) Series 49. Rockville, MD: Substance Abuse and Mental Health Services Administration; 2009. HHS Publication No. (SMA) 09-4380. [PubMed] [Google Scholar]
- National Institute on Drug Abuse. Principles of Drug Addiction Treatment: a Research-Based Guide. Bethesda, MD: National Institute on Drug Abuse; 2009. [Google Scholar]
- Knudsen HK, Abraham AJ, Roman PM. Adoption and implementation of medications in addiction treatment programs. J. Addict. Med. 2011;5:21–27. doi: 10.1097/ADM.0b013e3181d41ddb. [DOI] [PMC free article] [PubMed] [Google Scholar]
- Knudsen HK, Roman PM. Financial factors and the implementation of medications for treating opioid use disorders. J. Addict. Med. 2012;6:280–286. doi: 10.1097/ADM.0b013e318262a97a. [DOI] [PMC free article] [PubMed] [Google Scholar]
- Knudsen HK, Ducharme LJ, Roman PM. The adoption of medications in substance abuse treatment: associations with organizational characteristics and technology clusters. Drug Alcohol Depend. 2007;87:164–174. doi: 10.1016/j.drugalcdep.2006.08.013. [DOI] [PMC free article] [PubMed] [Google Scholar]
- Knudsen HK, Abraham AJ, Oser CB. Barriers to the implementation of medication-assisted treatment for substance use disorders: the importance of funding policies and medical infrastructure. Eval. Program Plann. 2011;34:375–381. doi: 10.1016/j.evalprogplan.2011.02.004. [DOI] [PMC free article] [PubMed] [Google Scholar]
- Boswell KA, Cook CL, Burch SP, et al. Associating medication adherence with improved outcomes: a systematic literature review. AJMC. 2012;4:e97–e108. [Google Scholar]
- Bailey JE, Hajjar M, Shoib B, et al. Risk factors associated with antihypertensive medication on adherence in a statewide Medicaid population. Am. J. Med. Sci. 2012;14:1–6. doi: 10.1097/MAJ.0b013e31825ce50f. [DOI] [PubMed] [Google Scholar]
- Gonzalez A, Barinas J, O'Cleirigh C. Substance use: impact on adherence and HIV medical treatment. Curr. HIV/AIDS Rep. 2011;8:223–234. doi: 10.1007/s11904-011-0093-5. [DOI] [PubMed] [Google Scholar]
- Johnson KH, Bazargan M, Bing EG. Alcohol consumption and compliance among inner-city minority patients with type 2 diabetes mellitus. Arch. Fam. Med. 2000;9:964–970. doi: 10.1001/archfami.9.10.964. [DOI] [PubMed] [Google Scholar]
- Teter CJ, Falone AE, Bakaian AM, et al. Medication adherence and attitudes in patients with bipolar disorder and current versus past substance use disorder. Psychiatry Res. 2011;190:253–258. doi: 10.1016/j.psychres.2011.05.042. [DOI] [PMC free article] [PubMed] [Google Scholar]
- Weiss RD. Adherence to pharmacotherapy in patients with alcohol and opioid dependence. Addiction. 2004;99:1382–1392. doi: 10.1111/j.1360-0443.2004.00884.x. [DOI] [PubMed] [Google Scholar]
- Harris KM, DeVries A, Dimidjian K. Datapoints: trends in naltrexone use among members of a large private health plan. Psychiatr. Serv. 2004;55:221. doi: 10.1176/appi.ps.55.3.221. [DOI] [PubMed] [Google Scholar]
- Kranzler HR, Stephenson JJ, Montejano L, et al. Persistence with oral naltrexone for alcohol treatment: implications for health-care utilization. Addiction. 2008;103:1801–1808. doi: 10.1111/j.1360-0443.2008.02345.x. [DOI] [PMC free article] [PubMed] [Google Scholar]
- Bryson WC, McConnell J, Krothuis T, McCarty D. Extended-release naltrexone for alcohol dependence: persistence and healthcare costs and utilization. Am. J. Manag. Care. 2011;17:S222–S234. [PMC free article] [PubMed] [Google Scholar]
- Baser O, Chalk M, Rawson R, Gastfriend DR. Alcohol dependence treatments: comprehensive healthcare costs, utilization outcomes, and pharmacotherapy persistence. Am. J. Manag. Care. 2011;17:S222–S234. [PubMed] [Google Scholar]
- Gastfriend DR. Intramuscular extended-release naltrexone: current evidence. Ann. N. Y. Acad. Sci. 2011;1216:144–166. doi: 10.1111/j.1749-6632.2010.05900.x. [DOI] [PubMed] [Google Scholar]
- Zarkin GA, Bray JW, Mitra D, et al. Cost methodology of COMBINE. J. Stud. Alcohol Suppl. 2005;15:50–55. doi: 10.15288/jsas.2005.s15.50. [DOI] [PubMed] [Google Scholar]
- Wilkerson J. 2011. PCORI head vows not to do cost-effectiveness studies, but notes gray areas http://insidehealthpolicy.com/Inside-Health-General/Public-Content/pcori-head-vows-not-to-do-cost-effectiveness-studies-but-notes-gray-areas/menu-id-869.html. Accessed on August 24, 2013.
- Mortimer D, Segal L. Economic evaluation of interventions for problem drinking and alcohol dependence: do within-family external effects make a difference? Alcohol. 2006;41:92–98. doi: 10.1093/alcalc/agh224. [DOI] [PubMed] [Google Scholar]
- Schwappach D, Popova S, Mohapatra S, et al. Strategies for evaluating the economic value of drugs in alcohol dependence treatment. Drug Alcohol Depend. 2012;122:165–173. doi: 10.1016/j.drugalcdep.2011.08.026. [DOI] [PubMed] [Google Scholar]
- Reijneveld SA. The cross-cultural validity of self-reported use of health care: a comparison of survey and registration data. J. Clin. Epidemiol. 2000;53:267–272. doi: 10.1016/s0895-4356(99)00138-9. [DOI] [PubMed] [Google Scholar]
- Booth BM, Kirchner JE, Fortney SM, et al. Measuring use of health services for at-risk drinkers: how brief can you get? J. Behav. Health Serv. Res. 2006;33:254–264. doi: 10.1007/s11414-006-9010-x. [DOI] [PubMed] [Google Scholar]
- Longo MC, Henry-Edwards SM, Humeniuk RE, et al. Impact of the heroin ‘drought’ on patterns of drug use and drug-related harms. Drug Alcohol Rev. 2004;23:143–150. doi: 10.1080/09595230410001704118. [DOI] [PubMed] [Google Scholar]
- Ettner SL, Huang D, Evans E, et al. Benefit–cost in the California treatment outcome project: does substance abuse treatment “pay for itself”? Health Serv. Res. 2006;41:192–213. doi: 10.1111/j.1475-6773.2005.00466.x. [DOI] [PMC free article] [PubMed] [Google Scholar]
- Mauskopf J, Sullivan S, Annemans L. Principles of good practice for budget impact analysis: report of the ISPOR task force on good research practices—budget impact analysis. Value Health. 2007;10:336–347. doi: 10.1111/j.1524-4733.2007.00187.x. [DOI] [PubMed] [Google Scholar]
- UKATT Research Team. Cost effectiveness of treatment for alcohol problems: findings of the randomised UK alcohol treatment trial (UKATT) BMJ. 2005;331:544. doi: 10.1136/bmj.331.7516.544. [DOI] [PMC free article] [PubMed] [Google Scholar]
- Laine C, Lin YT, Hauck WW, Turner BJ. Availability of medical care services in drug treatment clinics associated with lower repeated emergency department use. Med. Care. 2005;43:985–995. doi: 10.1097/01.mlr.0000178198.79329.89. [DOI] [PubMed] [Google Scholar]
- Laine C, Hauck WW, Gourevitch MN, et al. Regular outpatient medical and drug abuse care and subsequent hospitalization of persons who use illicit drugs. JAMA. 2001;285:2355–2362. doi: 10.1001/jama.285.18.2355. [DOI] [PubMed] [Google Scholar]
- Holder HD. Cost benefits of substance abuse treatment: an overview of results from alcohol and drug abuse. J. Ment. Health Policy Econ. 1998;1:23–29. doi: 10.1002/(sici)1099-176x(199803)1:1<23::aid-mhp3>3.0.co;2-q. [DOI] [PubMed] [Google Scholar]
- Kane R, Wall M, Potthoff S, et al. The effect of alcoholism treatment on medical care use. Med. Care. 2004;42:395–402. doi: 10.1097/01.mlr.0000118865.63346.23. [DOI] [PubMed] [Google Scholar]
- Cartwright WS. Cost-benefit analysis of drug treatment services: review of the literature. J. Ment. Health Policy Econ. 2000;3:11–26. doi: 10.1002/1099-176x(200003)3:1<11::aid-mhp66>3.0.co;2-0. [DOI] [PubMed] [Google Scholar]
- Harwood HJ, Hubbard RJ, Collins JJ, Rachal JV. The costs of crime and the benefits of drug abuse treatment: a cost-benefit analysis using TOPS data. NIDA Res. Monogr. 1988;86:209–235. [PubMed] [Google Scholar]
- Barnett PG. The cost-effectiveness of methadone maintenance as a health care intervention. Addiction. 1999;94:479–488. doi: 10.1046/j.1360-0443.1999.9444793.x. [DOI] [PubMed] [Google Scholar]
- Barnett PG. The cost-effectiveness of methadone maintenance. Mt. Sinai J. Med. 2000;67:365–374. [PubMed] [Google Scholar]
- Zaric GS, Barnett PG, Brandeau ML. HIV transmission and the cost-effectiveness of methadone maintenance. Am. J. Public Health. 2000;90:1100–1111. doi: 10.2105/ajph.90.7.1100. [DOI] [PMC free article] [PubMed] [Google Scholar]
- Humphreys K, Wagner TH, Gage M. If substance use disorder treatment more than offsets its costs, why don't more medical centers want to provide it? A budget impact analysis in the Veterans Health Administration. J. Subst. Abuse Treat. 2011;41:243–251. doi: 10.1016/j.jsat.2011.04.006. [DOI] [PubMed] [Google Scholar]
- Popova S, Mohapatra S, Patra J, et al. A literature review of cost-benefit analyses for the treatment of alcohol dependence. Int. J. Environ. Res. Public Health. 2011;8:3351–3364. doi: 10.3390/ijerph8083351. [DOI] [PMC free article] [PubMed] [Google Scholar]
- Zarkin GA, Bray JW, Aldridge A, et al. Cost and cost-effectiveness of the COMBINE study in alcohol-dependent patients. Arch. Gen. Psychiatry. 2008;65:1214–1221. doi: 10.1001/archpsyc.65.10.1214. [DOI] [PMC free article] [PubMed] [Google Scholar]
- Dunlap LJ, Zarkin GA, Bray JW, et al. Revisiting the cost-effectiveness of the COMBINE study for alcohol dependent patients. The patient perspective. Med. Care. 2010;48:306–313. doi: 10.1097/mlr.0b013e3181ca3d40. [DOI] [PMC free article] [PubMed] [Google Scholar]
- Mark TL, Montejano LB, Kranzler HR, et al. Comparison of healthcare utilization among patients treated with alcoholism medications. Am. J. Manag. Care. 2010;16:879–888. [PMC free article] [PubMed] [Google Scholar]
- U.S. Department of Health and Human Services, National Institutes of Health, National Institute on Alcohol Abuse and Alcoholism. 2007. Helping patients who drink too much: a clinician's guide (NIH publication no. 07–3769) http://pubs.niaaa.nih.gov/publications/Practitioner/CliniciansGuide2005/guide.pdf. Accessed May 8, 2014.
- Bryson WC, McConnell J, Krothuis T, McCarty D. Extended-release naltrexone for alcohol dependence: persistence and healthcare costs and utilization. Am. J. Manag. Care. 2011;17:S222–S234. [PMC free article] [PubMed] [Google Scholar]
- Baser O, Chalk M, Rawson R, Gastfriend DR. Alcohol dependence treatments: comprehensive healthcare costs, utilization outcomes, and pharmacotherapy persistence. Am. J. Manag. Care. 2011;17:S222–S234. [PubMed] [Google Scholar]
- Kuehn BM. Office-based treatment for opioid addiction achieving goals. JAMA. 2005;294:784–786. doi: 10.1001/jama.294.7.784. [DOI] [PubMed] [Google Scholar]
- Rosenheck R, Kosten T. Buprenorphine for opiate addiction: potential economic impact. Drug Alcohol Depend. 2001;63:253–262. doi: 10.1016/s0376-8716(00)00214-3. [DOI] [PubMed] [Google Scholar]
- Barnett PG. Comparison of costs and utilization among buprenorphine and methadone patients. Addiction. 2009;104:982–992. doi: 10.1111/j.1360-0443.2009.02539.x. [DOI] [PubMed] [Google Scholar]
- Jones ES, Moore BA, Sindelar JL, et al. Cost analysis of clinic and office-based treatment of opioid dependence: results with methadone and buprenorphine in clinically stable patients. Drug Alcohol Depend. 2009;99:132–140. doi: 10.1016/j.drugalcdep.2008.07.013. [DOI] [PMC free article] [PubMed] [Google Scholar]
- Clark RE, Samnaliev M, Baxter JD, Leung GY. Addiction treatment with buprenorphine: the evidence doesn't justify steps by state medicaid programs to restrict opioid addiction treatment with buprenorphine. Health Aff. 2011;30:1425–1433. doi: 10.1377/hlthaff.2010.0532. [DOI] [PubMed] [Google Scholar]
- Baser O, Chalk M, Fiellin DA, Gastfriend DR. Cost and utilization outcomes of opioid-dependence treatments. Am. J. Manag. Care. 2011;17:S235–S246. [PubMed] [Google Scholar]
- Minozzi S, Amato L, Vecchi S, et al. Oral naltrexone maintenance treatment for opioid dependence. Cochrane Database Syst. Rev. 2011;2:CD001333. doi: 10.1002/14651858.CD001333.pub2. [DOI] [PubMed] [Google Scholar]
- Weiss RD, Potter JS, Fiellin DA, et al. Adjunctive counseling during brief and extended buprenorphine-naloxone treatment for prescription opioid dependence: a 2-phase randomized controlled trial. Arch. Gen. Psychiatry. 2011;68:1238–1246. doi: 10.1001/archgenpsychiatry.2011.121. [DOI] [PMC free article] [PubMed] [Google Scholar]
- McCarty D, Frank R, Denmead G. Methadone maintenance and state Medicaid managed care programs. Milbank Q. 1999;77:341–62. doi: 10.1111/1468-0009.00139. [DOI] [PMC free article] [PubMed] [Google Scholar]
- Substance Abuse and Mental Health Services Administration, Office of Applied Studies. 2010. The DAWN Report: Trends in Emergency Department Visits Involving Nonmedical Use of Narcotic Pain Relievers http://www.samhsa.gov/data/2k10/dawn016/opioided.htm. Accessed May 8, 2014.
- Zarkin GA, Dunlap LJ, Homsi G. The substance abuse services cost analysis program (SASCAP): a new method for estimating drug treatment services cost. Eval. Program Plann. 2004;23:35–43. [Google Scholar]
- National Institute on Drug Abuse (NIDA) Principles of Drug Abuse Treatment for Criminal Justice Populations: a research-based guide (NIH No. 11-5316) Rockville MD: National Institute of Health; 2012. [Google Scholar]
- Simpson DD Treatment for drug abuse. Follow-up outcomes and length of time spent. Arch. Gen. Psychiatry. 1981;38:875–880. doi: 10.1001/archpsyc.1981.01780330033003. [DOI] [PubMed] [Google Scholar]
- Strang J, Babor T, Caulkins J, et al. Drug policy and the public good: evidence for effective interventions. Lancet. 2012;379:71–83. doi: 10.1016/S0140-6736(11)61674-7. [DOI] [PubMed] [Google Scholar]
- Schneeweiss S, Avorn J. A review of uses of health care utilization databases for epidemiologic research on therapeutics. J. Clin. Epidemiol. 2005;58:323–337. doi: 10.1016/j.jclinepi.2004.10.012. [DOI] [PubMed] [Google Scholar]
- Office of National Drug Control Policy. 2013. National Drug Control Strategy 2013 http://www.whitehouse.gov//sites/default/files/ondcp/policy-and-research/ndcs_2013.pdf. Accessed October 7, 2013.
- Hartung D, McCarty D, Fu R, et al. Extended-release naltrexone for alcohol and opioid dependence: a meta-analysis of healthcare utilization studies. J. Subst. Abuse Treat. 2014;47:113–121. doi: 10.1016/j.jsat.2014.03.007. [DOI] [PMC free article] [PubMed] [Google Scholar]
- Wedam EF, Bigelow GE, Johnson RE, et al. QT-interval effects of methadone, levomethadyl, and buprenorphine in a randomized trial. Arch. Intern. Med. 2007;167:2469–2475. doi: 10.1001/archinte.167.22.2469. [DOI] [PubMed] [Google Scholar]
- Tkacz J, Severt J, Cacciola J, Ruetsch C. Compliance with buprenorphine medication-assisted treatment and relapse to opioid use. Am. J. Addict. 2011;21:55–62. doi: 10.1111/j.1521-0391.2011.00186.x. [DOI] [PubMed] [Google Scholar]
- Kaur AD, McQueen A, Jan S. Opioid drug utilization and cost outcomes associated with the use of buprenorphine-naloxone in patients with a history of prescription opioid use. J. Manag. Care Pharm. 2008;14:186–194. doi: 10.18553/jmcp.2008.14.2.186. [DOI] [PMC free article] [PubMed] [Google Scholar]
- Jan S, Gill P. Utilization patterns of extended-release naltrexone for alcohol dependence. Am. J. Manag. Care. 2011;17:S210–S212. [PubMed] [Google Scholar]
- American Society of Addiction Medicine. 2013. Public Policy Statement on Pharmacological Therapies for Opioid Use Disorder http://www.asam.org/docs/default-source/publicy-policy-statements/pharmacological-therapies-for-opioid-use-disorder-2013-04-24.pdf?sfvrsn=4. Accessed on April 7, 2014.
- Institute of Medicine. Initial National Priorities for Comparative Effectiveness Research. Washington, DC: National Academies Press; 2009. [Google Scholar]
- Schwappach DL, Boluarte TA. HEE-GER: a systematic review of German economic evaluations of health care published 1990–2004. BMC Health Serv. Res. 2007;7:7. doi: 10.1186/1472-6963-7-7. [DOI] [PMC free article] [PubMed] [Google Scholar]
- McCollister KE, French MT. The relative contribution of outcome domains in the total economic benefit of addiction interventions: a review of first findings. Addiction. 2003;98:1647–1659. doi: 10.1111/j.1360-0443.2003.00541.x. [DOI] [PubMed] [Google Scholar]
- Zarkin GA, Bray JW, Aldridge A, et al. The effect of alcohol treatment on social costs of alcohol dependence results from the COMBINE study. Med. Care. 2010;48:396–401. doi: 10.1097/MLR.0b013e3181d68859. [DOI] [PMC free article] [PubMed] [Google Scholar]
- Center for Addiction and Substance Abuse. Behind Bars II: Substance Abuse and America's Prison Population. New York, NY: CASA; 2010. [Google Scholar]
- Godfrey C, Stewart D, Gossop M. Economic analysis of costs and consequences of the treatment of drug misuse: 2-year outcome data from the National Treatment Outcome Research Study (NTORS) Addiction. 2004;99:697–707. doi: 10.1111/j.1360-0443.2004.00752.x. [DOI] [PubMed] [Google Scholar]
- Cuellar AE, Cheema J. As roughly 700,000 prisoners are released annually, about half will gain health coverage and care under federal laws. Health Aff. (Millwood) 2012;31:931–938. doi: 10.1377/hlthaff.2011.0501. [DOI] [PubMed] [Google Scholar]
- Mechanic D. Seizing opportunities under the Affordable Care Act for transforming the mental and behavioral health system. Health Aff. (Millwood) 2012;31:376–382. doi: 10.1377/hlthaff.2011.0623. [DOI] [PubMed] [Google Scholar]
- ABC News. 2013. June 6, Poll: Drug Treatment Favored Over Jail http://abcnews.go.com/Politics/story?id=120958&page=1. Accessed on May 8, 2014.
- The Economist. 2013. August 17, America's overcrowded prisons—One nation, behind bars: Eric Holder's ideas for locking up fewer Americans are welcome, but do not go far enough http://www.economist.com/news/leaders/21583680-eric-holders-ideas-locking-up-fewer-americans-are-welcome-do-not-go-far-enough-one. Accessed on May 8, 2014.