

Abstract
Microfluidic inertial focusing has been shown as a simple and effective method to localize cells and particles within a flow cell for interrogation by an external optical system. To enable portable point of care optical cytometry, however, requires a reduction in the complexity of the large optical systems that are used in standard flow cytometers. Here, we present a new design that incorporates optical waveguides and focusing elements with an inertial focusing flow cell to make a compact robust cytometer capable of enumerating and discriminating beads, cells, and platelets.
INNOVATION
The technology presented in this paper combines inertial microfluidics with integrated optics to create an extremely small flow cytometer capable of measuring cells for clinical diagnostics. Inertial microfluidics is capable of focusing cells without the use of sheath fluid, simplifying fluid processing and control in the system. The integrated optics are built into the flow cell of the cytometer and thus do not require any alignment or adjustment. The optics were designed to maximize light throughput, while minimizing coincident event detection taking into account the unique particle ordering characteristics of the inertial microfluidic flow cell. The optics were also designed to separate out the dim scattering signals from the excitation source, creating a darkfield cytometer similar to those used in commercial cytometers, but at a fraction of the size and complexity of these systems.
Flow cytometry is a common method for the analysis of cells and particles in biomedical research and clinical diagnostics. Current flow cytometers are robust bench top instruments capable of measuring optical scattering and fluorescence of cells and particles at extremely high throughput (~1000’s of events per second)1. While these systems have decreased in size over time, they are still not amenable to mobile point of care diagnostic settings or rugged environments due to the size and sensitivity of the measurement optics.
Integration of microscale fluidic and optical technologies is a promising approach for reducing the size and complexity of optical cytometers. Current approaches to optofluidic integration typically employ optical waveguides to direct light to a microfluidic flow cell, with many different design approaches for both the optical and fluidic system2. Most designs employ either optical fibers3-6 to directly deliver light to a flow cell or slab waveguiding structures that employ photolithographic materials to guide light to a fluid channel defined within the slab7-12. While using optical fibers directly is an attractive method because of the cost, availability, and excellent properties of commercial fibers, it does not allow shaping of the excitation or scattered light without additional optical elements7. This makes discrimination of particles based on scattering challenging as contamination from the excitation source can quickly mask the smaller scattering signals4.
An attractive alternative to direct insertion of fibers into microfluidic structures are systems that employ slab waveguides. Slab waveguides are formed by sandwiching a patterned material with a high refractive index between two substrates with a lower index of refraction. These systems are attractive because of the precision of photolithographic pattering of surface features that act as waveguiding structures. Slab waveguides have been used to optimize excitation beam shape13, steer excitation light with total internal reflection14, and collect scattered light8. These systems, however, typically involve complex construction methods, require photolithographic patterning for each device, and employ materials that can autofluoresce or degrade with ultra-violet exposure.
In this paper we describe a microfluidic device that overcomes many of the limitations discussed above. This device uses waveguides embossed into a rigid optical-grade thermoplastic to direct light to a flow cell. Recently, we reported on a simple method for focusing cells and particles inside of microfluidic channels without sheath fluid15-17, where particles are localized by hydrodynamic lift forces within the flow cell and order with respect to one another. Using inertial focusing provides a distinct advantage in compact flow cytometers as only one fluid stream is controlled. Another advantage is that because cells order with respect to one another, coincident events are eliminated even at high particle concentrations18.
In order to exploit inertial focusing in a compact, integrated device requires an optical system that focuses the excitation beam to a width narrower than the interparticle spacing. We used design aspects from slab waveguiding systems to create lenses to shape the excitation beam within the device. Furthermore, we also designed optical lenses capable of collimating the excitation beam and removing it from the detectors that measure scattered light. We have validated the performance of the device through discrimination and enumeration of beads, red blood cells, and platelets.
RESULTS
Integrated optofluidic design
The flow cell employed in this cytometer is a sheathless design that employs inertial focusing to spatially localize cells within the fluid stream15,17,18. In the current design a rectangular geometry was chosen, which causes cells to focus along two positions within the channel cross-section, shown in Fig. 1. In order to accurately measure scattered light and quantitatively count particles, the width of the optical excitation beam formed by the waveguiding optics must be less than the interparticle spacing. For particles of up to 10 μm in diameter, the interparticle spacing was measured to be 33 μm, setting the upper limit for the beam width at 23 μm.
Figure 1.

Overview of flow cell design constraints. Cells flowing through the small, rectangular channel focus into two streamlines (dotted lines, a). The cells are centered within the cross section of the channel, and spaced from one another along the flow direction by approximately 33 μm as measured with a high-speed camera (b). The optical excitation beam propagates along the x-axis and illuminates the channel in the y-z plane (c). The interparticle spacing in (b) requires that the beam width in the y-direction (Iy) be less than the sum of the interparticle spacing and the maximum diameter of particles of ~10 um.
For the detection of particles, the goal for the current cytometer design was to create a device that could detect both scattering and axial light loss of cells. To achieve this, it is necessary to separate the incident laser beam from the light scattered by cells and particles traveling within the flowcell. The optical system thus needed to: (1) focus from the output of the excitation waveguide to less than 23 μm in width; (2) redirect the primary excitation light into a waveguide; and (3) collect the scattered light into a separate waveguide with minimal contamination of the parent beam. For this device, light is guided within a high refractive index polymer surrounded by a lower index cladding material. This step-index waveguide design employs an optical-grade thermoset epoxy for the high index core, while the low-index cladding is a cycloolefin thermoplastic (COP). The COP cladding is the substrate of the device, which contains channels for the fluid flow cell, channels for the waveguiding epoxy, and air spaces that act as lenses for light.
For a step-index waveguide, light propagates through the channels within a certain angular acceptance based on the difference between core and cladding index of refraction. The core material used in this device had an index of refraction of 1.561 ± 0.003, while the cladding material had an index of 1.525 ± 0.002. These materials were chosen to set the numerical aperture (NA) of the system to 0.33, and allow for easy injection of external light into the system using fibers with a lower NA (NA = 0.22).
One potential drawback to the step-index waveguide designs is the loss of light out of plane at the end face of the waveguide2. Light exits the waveguide at an angle, θ, determined by the waveguide NA, as shown in Fig. 2. This out of plane light is lost to the detection waveguide at a rate that is determined by the NA and spacing between the excitation and collection waveguide faces. The loss versus this distance, L, is also shown in Fig. 2. This loss was modeled as the ratio of beam height in plane (50 μm) to the height of the beam expanding from the face of the waveguide which was assumed to have a hyperbolic profile that approaches the beam NA. To minimize this loss, we designed a system that minimized the distance L between the waveguide faces, but still met the requirements described above.
Figure 2.

Overview of waveguide dimensional constraints. A cross section of the device through the optical axis is shown in (a). Light propagates through the waveguide from the left. At the end of the waveguide channel, the light exits and propagates out with an angle θ determined by the numerical aperture of the system. The light that propagates above and below the aperture face of the detection waveguide, shaded in purple, is not collected by the detection waveguide and is lost. The fractional loss out of plane, is shown in (b) for waveguide spacing, L. The two dashed lines represent the distance from the excitation waveguide to the center of the flow cell, and the distance between excitation and detection waveguides, respectively.
Design for the lenses that shape the optical beams was based on 2D and 3D raytrace simulations. Sequential raytrace simulations were performed at the laser wavelength, 657 nm, using the wavelength-specific index of refraction for the materials above. With the proper material parameters input into the model, the shape of the optical surfaces was optimized subject to a series of metrics: (1) the width of the beam must be no larger than 23 μm at the center of the focus; (2) at least 99.5% of the parent beam had to be collected by the detection waveguide to prevent contamination into the scattering waveguides; and (3) the out of plane power loss for the excitation beam at the flow cell could not exceed 30%. In addition to these metrics, a set of constraints we imposed based on the manufacturing the device by thermal embossing: (1) each surface of the different optical elements had to be spaced by a minimum of 25 μm to allow for molding of the COP device; (2) any corners must have a radii of 5 μm; and (3) all waveguide channels must be at least 50 μm in diameter in order to couple to the core of the fibers used to interface with the device. These optimization metrics and constraints were used to develop a merit function that was minimized during the raytrace simulations.
Using the results from the raytrace simulations, shown in Fig. 3, we were able to generate a design that met the above requirements subject to production constraints. The design consisted of two lenses, one placed between the excitation waveguide and the flow cell channel, and one between the flow cell channel and the detection waveguides. Each lens surface was optimized to a general aspheric curve,
where z(r) is the surface profile as a function of distance off the optical axis, r, surface curvature, c (the inverse of the spherical radius of curvature), and k is a conic constant. Higher order aspheric terms were fitted, but gave no improvement in predicted performance and were thus left out of this design. These optimized parameters are shown in the Fig. 3d.
Figure 3.

Results of 2D raytace simulations of the waveguide system. The main system rays from the excitation fiber (x = 0) are shown in blue in (a). At the center of the fluid channel (vertical blue lines near 0.1 mm), another set of rays representing scattered rays at 30–40° are also propagated (redorange). The lens surfaces optimized in the simulation are shown as thick black lines, and detector surfaces, where the optical field is sampled are shown as thick vertical lines. In (b), the integrated intensity of the rays at the different detector surfaces are plotted. The thin red line is at the excitation waveguide surface. The thin blue line, dotted blue line, and dashed blue line represent the intensity of the beam in the middle, front, and back faces of the flow channel. The thick red line and thick blue line show the intensity of the light at the detector surface for the primary rays and the scattered rays, respectively. The final design and layout of the waveguides and lenses is shown in (c). In addition to lenses and waveguides are the fill channels and channels that act as optical baffles for the forward scatter waveguides. Also shown are waveguides for a scattering channel at 80° and two waveguides at 135° from the optical axis. These channels are used for wide angle scatter detection. The lens surfaces for the excitation and collection optics were optimized to a general aspheric surface. The fit values to these surfaces are shown in the table in panel (d). Additional geometric parameters for panel (c) are given in the Supplementary Fig. 1.
The final design for the darkfield optical cytometer is shown in Fig. 3. This design includes waveguides for the excitation beam and the waveguide to collect the primary beam. This waveguide is used to measure coupling efficiency of the system, DC laser power fluctuations, and axial light loss (ALL) measurements. Adjacent to this ALL waveguide are two forward scatter waveguides. Because of the NA of the waveguide system, the 50 μm width of the multimode excitation beam, and the production constraints, it was not possible to design a collection waveguide system that could collect forward scatter light at angles of less than 30°. Typical flow cytometers measure forward scatter light at angles between 3–20° off axis of the excitation light beam1,19. For cells and particles 1–15 μm in diameter, light is strongly forward scattered, and forward scattering detection can be accomplished using simple photodiodes and modest laser powers (~10mW). For the current design, we predicted an approximately 50 fold signal reduction compared to a traditional forward scatter system, which was accommodated by the pulse detection electronics.
Waveguide cytometer characterization
The cytometer was next built and tested for baseline performance. The device with basic characterization data appears in Fig. 4 and Supplementary Fig. 1. The flow channel had a rectangular cross section of 30 μm wide × 55 μm tall and was 45mm in length. All of the waveguide and lens features were produced with the same height as the fluid channel, and were placed at 4 cm from the inlet of the device. The length was more than sufficient to achieve stable focusing of cells and beads at modest flow rates (10–40 μL/min). The SU-8 master was replicated with a rigid elastomer that was used to mold the features into blank COP slides. The COP slide with molded features was then thermally bonded to a flat COP slide with access holes for fluid input. These devices when interfaced with tubing would easily hold up to 3 bar of pressure, which was sufficient to flow saline buffer at an average flow rate of 17 μL/min/bar. The optical system was interfaced with bare optical fiber through the ends of the waveguides at the edge of the chip (Supplementary Fig. 2). This process allowed us to couple light from a fiber pigtailed laser and to direct light from the detection waveguides into a set of photodiode or photomultiplier tube detectors.
Figure 4.
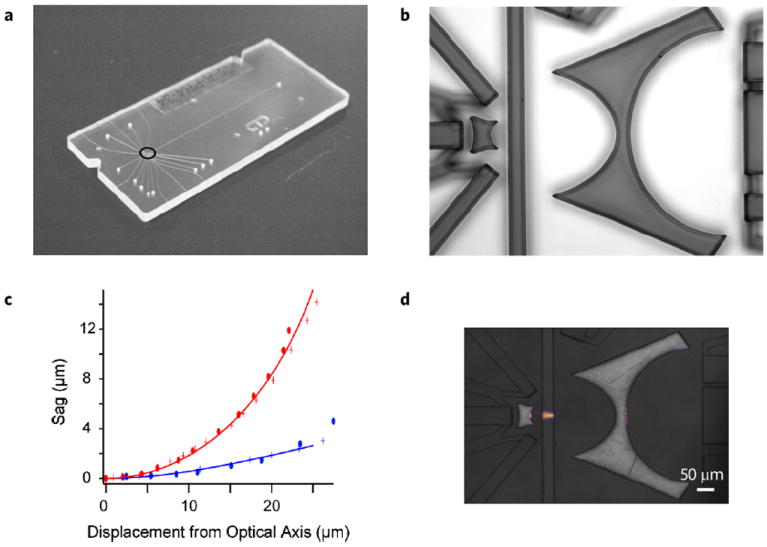
Overview of cytometer characterization. The cytometer is a molded piece of COP bonded to another COP backing plate (a). Holes on the device face are for waveguide filling with epoxy and for access to the flow cell with stainless steel tubing. The COP device is molded from an elastomeric copy of an SU-8 master. A reflectance image of the original master is shown in (b). This master faithfully reproduced the curved surfaces shown in Fig. 3c. Comparison of the feature edges in (b) with design shapes is shown for the excitation lens in (c). The design curves for aspheric surfaces 1 and 2 are shown as solid blue and red lines respectively. The measured sag for two different production masters is shown with crosses and ovals, respectively. The optical focusing performance is shown in (d). The fluid channel is filled with a fluorescent dye, and the waveguides are filled with optical epoxy. When light is launched through a fiber into the excitation waveguide, it focuses the excitation beam to a width of 14.8±0.8 at the center of the channel (N = 3). The beam width variation across the width of the fluid channel is ±4 μm from left to right.
We next tested the optical performance of the completed chip. To validate the optical system, a red fluorescent dye (Alexa-fluor 647) was pumped through the optical channel and excited by the 657nm laser source. The chip was imaged with a standard microscope equipped with excitation blocking filters and the beam width was measured at the center as well as front and back faces of the flow cell. From three different cytometers, the beam width measured was 14.8 ± 0.8 μm, which is actually narrower than the predicted 21 μm from the ray trace model. In addition to static fluorescence images of the beam width we measured the light collection into the different detection channels. A summary of the average coupling losses into different channels for three different assembled cytometers is given in Table 1. While the losses for the axial light loss channel seems large, we estimate coupling losses due to fiber-fiber coupling, fiber-waveguide coupling and slab losses at approximately −14 dB. This suggests that the remaining losses are due to scattering off the walls of the waveguides, at a level of −2.3 dB/cm. This number compares with Bliss et al., who measured a 2.2 dB/cm loss for PDMS waveguide system20. More importantly, we measured a both forward scatter channels to be an additional 22 dB below the DC optical power in the ALL waveguide (a factor of ~0.006), confirming the placement of the waveguides with respect to optical design in Fig. 3.
Table 1.
Summary of optical power coupling into the detection channels.
| Optical coupling | Measured coupling (dB) |
|---|---|
| Excitation – Axial light loss waveguide | −19.4 ± 1.9 |
| Excitation – Forward scatter waveguide 01 | −43.9 ± 1.2 |
| Excitation – Forward scatter waveguide 02 | −44.5 ± 0.9 |
Cytometer performance
Having validated the design we next tested the performance of the device as a functioning cytometer. An overview of the device performance is shown in Fig. 5. First different bead solutions were pumped through the flow cell and excited with the red fiber coupled diode laser. A sample trace of the scattered signals is shown in panel A. A peak detection algorithm built into Labview was used to locate the location scattered peak height, position, and width of beads passing the optical detection system. Scatter height distributions were sufficient to discriminate between particles ranging in size from 4.1 μm in diameter up to 15 μm in diameter (Supplementary Fig. 3). To ensure that cells were focused within the fluid channel, both streak images of the cells were recorded (not shown) and the peak width of the beads was measured. As shown in Fig. 5c the peak width decreases linearly from 0.5 to 2.5 bar. Below 0.5 bar, the peak width lengthens, the peak height distribution broadens substantially, and position within the channel randomizes, suggesting that the inertial hydrodynamic forces were not sufficient to localize particles. These observations were confirmed with streak images and high-speed video (not shown). All additional experiments were driven with 2 bar pressure corresponding to 34 μL/min flow rate.
Figure 5.

Summary of cytometer testing with beads and with cells. Sample voltage signal for 10 μm bead scattering. Pulse height histogram of the data from (a) is displayed in (b). To test the focusing within the flow cell, pulse width was analyzed from 0.1 to 2.5 bar drive pressure. At 0.5 bar and above, the pulse width decreases linearly with drive pressure. The concentration of 6 μm, 10 μm, and 15 μm beads was measured over three orders of magnitude and the concentration was compared with a Coulter counter, (d) (green diamonds). For beads, the correlation between cytometer counts and the Coulter was 0.94 (R2 = 0.998). In addition to beads, diluted whole blood was run through the cytometer. Scattergrams for axial light loss vs forward scatter voltage are plotted in (e) and (f). Sample in (e) was a platelet enriched plasma sample, while the scattergram in (f) is from dilute whole blood. The correlation between cytometer and Coulter counts are shown in (d) with red squares for platelets and blue diamonds for RBCs. The red blood cells exhibited a correlation of 0.93 (R2 = 0.926), while the platelet counts had a correlation of 0.82 (R2 = 0.646). The gates for red blood cell counts are shown in blue and the gate for the platelet count is shown in red.
We next tested the ability of our cytometer to quantitatively count and discriminate particles over a range of concentrations. First we measured the concentration of 6 μm beads over two logs of concentration (~40–4000 beads/μl). For these experiments data was collected over 3–5 minutes and counts derived from the scatter-grams were compared with counts measured on a Coulter counter. Counts for three different concentrations measured in triplicate were linearly correlated with Coulter measurements with a slope of 0.94 (R2 = 0.998).
Finally to test whether our cytometer with integrated optics could measure cells relevant to clinical diagnostics, we measured a set of diluted whole blood samples. Our goal was to discriminate between platelets and red blood cells and to quantitatively measure each with a 10% error. To ensure that we were able to detect platelets, we first measured a platelet-enriched sample Fig. 5e. When plotted on a log scale, scatter from platelets (red region) can be effectively discriminated from contaminating red cells (blue region). We next measured dilute whole blood in order to test the ability to quantitatively detect and count RBCs and platelets. Five samples were measured (one in triplicate), and a representative scattergram in shown in Fig. 5f. Events were counted in the platelet region and the RBC region were compared with Coulter measurements and are plotted in Fig. 5d. The red blood cells exhibited a correlation of 0.93 (R2 = 0.926), while the platelet counts had a correlation of 0.82 (R2 = 0.646). These data demonstrate the ability of our inertial focusing cytometer with integrated optical elements to discriminate and enumerate cells relevant to routine clinical diagnostics.
DISCUSSION
In this paper we have designed, built, and characterized a microfluidic chip that combines integrated optics with inertial microfluidics for scatter detection and discrimination of particles. Inertial focusing gives rise to particle ordering which placed strict technical requirements on the optical system design in order to detect single particles within the optical interrogation region. We designed an optical system that was capable of focusing a large multi-mode optical beam down to less than 20 μm. This was challenging because of the relatively large numerical aperture of the excitation waveguide, and width or mode density of the waveguide system. Despite these challenges in achieving a focused beam, our measured beam width was narrower than predicted. This difference is due to slight rounding of the excitation lens features near the corners of the lens closest to the waveguide surface. Simulations of the light lost through this rounding predict a loss of approximately 20%, which was not detrimental to scattering measurements for beads and cells. The reduction in beam width, however, helped to reduce coincident events and to detect cells at high particle concentrations.
The beam width, however, aids in correcting the loss in beam irradiance across the width of the channel. Based on theoretical predictions in Fig. 2b, there is a predicted drop in excitation on either side of the channel, of 8% for the particle focusing positions given in Fig. 1. The slight narrowing of the beam should lead to a higher irradiance for the narrower beam, and lead to a power density or irradiance of 5–10% across the width of the channel. This difference in excitation intensity across the width of the flowcell will manifest itself as a broadening of the detected pulses, and could help explain the somewhat larger scattering CV’s seen in our device (12–18%) compared to a FACSCaliber (6–10%). Efforts are currently underway to measure the tradeoff between out of plane light losses and beam concentration.
Scattering detection of platelets and red blood cells was determined as a benchmark for the range of measurements made in a clinical cytometer. Red cells occur in the blood at extremely high concentrations (~40–45% volume fraction or ~4 × 10⁶ cells/μl). For compact, point of care cytometry, minimizing fluid volumes is extremely important. In this paper, we measured RBCs with a single 1000-fold dilution with buffer, approximately an order of magnitude less fluid than with a standard sheath-flow cytometer or Coulter measurement. Inertial focusing minimized coincident events allowing direct counts in such a highly concentrated sample.
Due to their small size, platelets do not focus within the flow cell16. One advantage of the current integrated cytometer design is that the excitation light fills the entire channel from top to bottom, and thus platelets are illuminated regardless of position within the flow cell. Platelets are extremely challenging to measure optically, however, due to small scattering cross sections21. For this reason, our correlation in platelet measurements was lower when compared to Coulter counts, but the correlation was still impressive given the optical losses in the current system. Efforts are underway to improve the optical design in order collect scattered light at angles closer to the incident beam. This will require adjustment of the collection lens to properly collimate the divergent multimode beam into a narrower collection waveguide closer to flow cell. Moving the collection optics closer to the flow cell will increase the collected solid angle of scattering. Because scattered light for cells is highly forward directed, this should allow us to increase the signal to noise for platelet detection and improve our enumeration of platelets.
The data presented in this work demonstrate an important first step towards realizing a compact, easily manufactured optical cytometer for routine cell counting. Inertial flow focusing was chosen because it requires minimal sample processing and a single pump for operation18. Optical detection was chosen for particle detection and characterization because of the range of inexpensive optical sources and detectors22-24 and the ability to carry out a wide range of assays including fluorescence. While electrical impedance methods are attractive due to their small size and reduced system complexity25-28, impedance based methods are limited in assay menus for a generalized clinical measurement platform. To extend the simplicity of the inertial focusing chip, we sought to decrease the complexity and the size of the optical system by incorporating optical elements within the microfluidic chip that contains the flow cell. These optics are fixed in space by the manufacturing process and do not require external adjustment over time to maintain alignment. This is an advantage for compact portable instrumentation that is subject to rugged environments or handling. We are currently making improvements to the design to collect fluorescence and high angle scattering measurements from cells. These improvements will be used for white blood cell counts, imunnoassays and cellular phenotyping. Once incorporated, the cytometer described here will enable compact point of care measurements for a wide range of clinical assays including standard blood counts, platelet and coagulation assays, CD4+/CD8+ HIV diagnostics29-31, and bead-based immunofluorescent assays32.
METHODS
Optical design
Ray tracing simulations were run on custom code written for Matlab and on Zemax. For waveguide propagation, non-sequential raytracing was performed in Zemax with > 100 k rays using individual rays or a planar source the size of the input coupling fiber (50 μm diameter core, NA = 0.22). Detectors were placed at positions corresponding to the collection waveguides or along waveguides 1mm in length beyond detection waveguide endfaces. Matlab simulations were sequential raytace simulations carried out for 2D propagation of 5000–10000 rays. Sources originated at the end face of the excitation waveguide and rays were propagated to detectors at the faces of the detection waveguides. Optimization of lens surfaces was performed in both Zemax and Matlab and gave similar results. Optimization for the excitation lens was performed by minimizing the beam width at the center of the fluid channel subject to geometrical constraints based on production methods. For the scattering collection lens, optimization proceeded by minimizing a merit function that sought to collimate the excitation beam, maximize intensity, and minimize width at the detection plane. Detection waveguides were placed such that the excitation beam would be rejected by a ratio of 1000:1 based on the raytrace simulation. In order to minimize overall device size, the detection waveguides were curved to spatially separate the different channels. Arc length of the waveguide curves was chosen to minimize bend loss33. The final optimized geometry was input into a Solidworks model for production (see below).
Microfluidic device production
Microfluidic devices were produced using a modified version of standard soft lithography. First, high resolution chrome masks were generated (Fineline Imaging) based on the optimized geometry, details of which are given in the Supplementary Fig. 1. Three layers of thicknesses of 15, 55, and 70 μm were photolithographically patterned using photoresist SU8 (MicroChem) on bare silicon wafers in order to make the negative masters. All fluid channels and waveguides were at a height of 55 μm, fill channels for the waveguides were made 15 μm, and interfaces for the external coupling fibers were made 70 μm. SU-8 masters were replicated in a cycloolefin copolymer (COP), (Zeon Chemicals) using a soft-embossing process (Edge Embossing)34. COP chips were thermally bonded to a clear COP backing that had access holes for fluid filling. Waveguides were filled with an optical grade epoxy (EpoxySet mixed according to manufacturer recommendations and degassed by centrifugation at 16000xg for 3 min. Once filled with epoxy, thin optical fibers (Polymicro Fiber) connectorized on one end with a standard SMA- 905 connector were cleaved and inserted into the edge of the chips. Fluid connections were made by gluing stainless steel tubing (New England Small Tubing) into holes cut into the COP chips.
Testing setup
The testing setup is shown in Supplementary Fig. 2. Briefly, the fiber glued to the excitation waveguide of the cytometer was connected to a 60mW fiber coupled laser diode (Thorlabs). Fibers coupled to detection waveguides were connected to either photodiodes (axial light loss and forward scattering waveguides) or photomultiplier tubes (side scatter), (Hamamatsu). Current from the photodetectors was converted to voltage with a custom transimpedance amplifier with analog baseline restore capability35. These voltages were digitized at 100–250 kHz and read into a computer through a custom software interface written in Labview (National Instruments). The data streams were processed using a peak detection algorithm in Labview with custom code to calculate peak statistics (height, width, and area). The peak data was then processed and displayed using Matlab (Mathworks) or FlowJo (Treestar).
Experiments were carried out with polystyrene beads (Bangs Laboratories or Polysciences Inc.) or processed whole blood samples. Whole blood was obtained Reseach Blood Components and was processed according to BSL-2 safety procedures. To prevent settling, beads and cells were diluted in isotonic density matched buffer containing phosphate buffered saline and Histodenz (Sigma). Samples were prepared at concentrations ranging from 10–5000 particles/μl and were flowed through the cytometer using a syringe pump (Harvard Apparatus) or through pneumatic driven source (Dolomite) at rates between 1.2–40 μl/min. The density matched buffer flowed through the system at an average rate of 12 ± 0.5 μl/min/bar drive pressure. Each experiment was run for three minutes and the sample outflow was collected and measured on a Coulter counter (Beckman Coulter).
Supplementary Material
Acknowledgments
This work was supported by grants from the US National Institutes of Health, U54 GM-062119 and P41 EB-002503, and Shriners Hospital for Children, 71003-BOS. We would like to thank Bill Parker of Creative Microsystems with help in Zemax modeling of the excitation geometry. Edge Embossing molded the COP microfluidic chips, which were thermally bonded by uFluidix. We would also like to that Bashar Hamza, Octavio Hurtado, and A.J. Aranyosi for technical support.
Footnotes
AUTHOR CONTRIBUTIONS
K.T.K. designed, performed, and analyzed experiments. A.C.P. produced devices and supplementary hardware for testing. R.H., R.G., M.T., and R.G.T. helped in experimental analysis. K.T.K. and M.T. wrote the manuscript.
COMPETING INTERESTS STATEMENT
The authors declare no competing financial interests.
References
- 1.Shapiro HM. Practical Flow Cytometry. 4. Wiley-Liss; 2003. [Google Scholar]
- 2.Godin J, et al. Microfluidics and photonics for Bio-System-on-a-Chip: A review of advancements in technology towards a microfluidic flow cytometry chip. J Biophotonics. 2008;1:355–376. doi: 10.1002/jbio.200810018. [DOI] [PMC free article] [PubMed] [Google Scholar]
- 3.Golden JP, et al. Multi-wavelength microflow cytometer using groove-generated sheath flow. Lab Chip. 2009;9:1942–1950. doi: 10.1039/b822442k. [DOI] [PMC free article] [PubMed] [Google Scholar]
- 4.Kummrow A, et al. Microfluidic structures for flow cytometric analysis of hydrodynamically focussed blood cells fabricated by ultraprecision micromachining. Lab Chip. 2009;9:972–981. doi: 10.1039/b808336c. [DOI] [PubMed] [Google Scholar]
- 5.Shapiro HM, Hercher M. Flow cytometers using optical waveguides in place of lenses for specimen illumination and light collection. Cytometry. 1986;7:221–223. doi: 10.1002/cyto.990070216. [DOI] [PubMed] [Google Scholar]
- 6.Schafer D, et al. Microfluidic cell counter with embedded optical fibers fabricated by femtosecond laser ablation and anodic bonding. Opt Express. 2009;17:6068–6073. doi: 10.1364/oe.17.006068. [DOI] [PMC free article] [PubMed] [Google Scholar]
- 7.Godin J, Lo YH. Two-parameter angular light scatter collection for microfluidic flow cytometry by unique waveguide structures. Biomed Opt Express. 2010;1:1472–1479. doi: 10.1364/BOE.1.001472. [DOI] [PMC free article] [PubMed] [Google Scholar]
- 8.Watts BR, Zhang Z, Xu CQ, Cao X, Lin M. Scattering detection using a photonic-microfluidic integrated device with on-chip collection capabilities. Electrophoresis. 2013 Jul 26; doi: 10.1002/elps.201300195. [DOI] [PubMed] [Google Scholar]
- 9.Watts BR, Zhang Z, Xu CQ, Cao X, Lin M. A method for detecting forward scattering signals on-chip with a photonic-microfluidic integrated device. Biomed Opt Express. 2013;4:1051–1060. doi: 10.1364/BOE.4.001051. [DOI] [PMC free article] [PubMed] [Google Scholar]
- 10.Watts BR, Zhang Z, Xu CQ, Cao X, Lin M. A photonic-microfluidic integrated device for reliable fluorescence detection and counting. Electrophoresis. 2012;33:3236–3244. doi: 10.1002/elps.201200311. [DOI] [PubMed] [Google Scholar]
- 11.Barat D, Benazzi G, Mowlem MC, Ruano JM, Morgan H. Design, simulation and characterisation of integrated optics for a microfabricated flow cytometer. Opt Commun. 2010;283:1987–1992. [Google Scholar]
- 12.Friis P, et al. Monolithic integration of microfluidic channels and optical waveguides in silica on silicon. Appl Opt. 2001;40:6246–6251. doi: 10.1364/ao.40.006246. [DOI] [PubMed] [Google Scholar]
- 13.Watts BR, Kowpak T, Zhang Z, Xu CQ, Zhu S. Formation and characterization of an ideal excitation beam geometry in an optofluidic device. Biomed Opt Express. 2010;1:848–860. doi: 10.1364/BOE.1.000848. [DOI] [PMC free article] [PubMed] [Google Scholar]
- 14.Jensen TG, Nielsen LB, Kutter JP. Fiber-free coupling between bulk laser beams and on-chip polymer-based multimode waveguides. Electrophoresis. 2011;32:1224–1232. doi: 10.1002/elps.201000593. [DOI] [PubMed] [Google Scholar]
- 15.Di Carlo D, Edd JF, Humphry KJ, Stone HA, Toner M. Particle segregation and dynamics in confined flows. Phys Rev Lett. 2009;102:094503. doi: 10.1103/PhysRevLett.102.094503. [DOI] [PMC free article] [PubMed] [Google Scholar]
- 16.Di Carlo D, Edd JF, Irimia D, Tompkins RG, Toner M. Equilibrium separation and filtration of particles using differential inertial focusing. Anal Chem. 2008;80:2204–2211. doi: 10.1021/ac702283m. [DOI] [PubMed] [Google Scholar]
- 17.Di Carlo D, Irimia D, Tompkins RG, Toner M. Continuous inertial focusing, ordering, and separation of particles in microchannels. Proc Natl Acad Sci U S A. 2007;104:18892–18897. doi: 10.1073/pnas.0704958104. [DOI] [PMC free article] [PubMed] [Google Scholar]
- 18.Oakey J, et al. Particle focusing in staged inertial microfluidic devices for flow cytometry. Anal Chem. 2010;82:3862–3867. doi: 10.1021/ac100387b. [DOI] [PMC free article] [PubMed] [Google Scholar]
- 19.Shapiro HM. Laser beam shaping and spot size. Curr Protoc Cytom. 2001;Chapter 1(Unit 1.6) doi: 10.1002/0471142956.cy0106s01. [DOI] [PubMed] [Google Scholar]
- 20.Bliss CL, McMullin JN, Backhouse CJ. Rapid fabrication of a microfluidic device with integrated optical waveguides for DNA fragment analysis. Lab Chip. 2007;7:1280–1287. doi: 10.1039/b708485d. [DOI] [PubMed] [Google Scholar]
- 21.Kolesnikova IV, et al. Determination of volume, shape and refractive index of individual blood platelets. J Quant Spect Radiat Transfer. 2006;102:37–45. [Google Scholar]
- 22.Mogensen KB, Kutter JP. Optical detection in microfluidic systems. Electrophoresis. 2009;30(Suppl. 1):S92–100. doi: 10.1002/elps.200900101. [DOI] [PubMed] [Google Scholar]
- 23.Myers FB, Lee LP. Innovations in optical microfluidic technologies for point-of-care diagnostics. Lab Chip. 2008;8:2015–2031. doi: 10.1039/b812343h. [DOI] [PubMed] [Google Scholar]
- 24.Habbersett RC, Naivar MA, Woods TA, Goddard GR, Graves SW. Evaluation of a green laser pointer for flow cytometry. Cytometry A. 2007;71:809–817. doi: 10.1002/cyto.a.20454. [DOI] [PubMed] [Google Scholar]
- 25.Watkins NN, et al. A microfabricated electrical differential counter for the selective enumeration of CD4+ T lymphocytes. Lab Chip. 2011;11:1437–1447. doi: 10.1039/c0lc00556h. [DOI] [PMC free article] [PubMed] [Google Scholar]
- 26.Sun T, Holmes D, Gawad S, Green NG, Morgan H. High speed multifrequency impedance analysis of single particles in a microfluidic cytometer using maximum length sequences. Lab Chip. 2007;7:1034–1040. doi: 10.1039/b703546b. [DOI] [PubMed] [Google Scholar]
- 27.Ekberg BA, Larsen UD, Fogh-Andersen N. A real point-of-care system for complete blood counting. Point Care. 2005;4:64–65. [Google Scholar]
- 28.Rao LV, et al. Evaluation of a new point of care automated complete blood count (CBC) analyzer in various clinical settings. Clin Chim Acta. 2008;389:120–125. doi: 10.1016/j.cca.2007.12.006. [DOI] [PubMed] [Google Scholar]
- 29.Cheng X, et al. A microfluidic device for practical label-free CD4(+) T cell counting of HIV-infected subjects. Lab Chip. 2007;7:170–178. doi: 10.1039/b612966h. [DOI] [PMC free article] [PubMed] [Google Scholar]
- 30.Ramachandraiah H, et al. Lab-on-DVD: Standard DVD drives as a novel laser scanning microscope for image based point of care diagnostics. Lab Chip. 2013;13:1578–1585. doi: 10.1039/c3lc41360h. [DOI] [PubMed] [Google Scholar]
- 31.Ozcan A, Demirci U. Ultra wide-field lens-free monitoring of cells on-chip. Lab Chip. 2008;8:98–106. doi: 10.1039/b713695a. [DOI] [PubMed] [Google Scholar]
- 32.Holmes D, She JK, Roach PL, Morgan H. Bead-based immunoassays using a micro-chip flow cytometer. Lab Chip. 2007;7:1048–1056. doi: 10.1039/b707507n. [DOI] [PubMed] [Google Scholar]
- 33.Papakonstantinou I, Wang K, Selviah DR, Ferandez FA. Transition, radiation and propagation loss in polymer multimode waveguide bends. Opt Express. 2007;15:669–679. doi: 10.1364/oe.15.000669. [DOI] [PubMed] [Google Scholar]
- 34.Carvalho BL, Arnold TE, Duffy DC, Kellogg GJ, Sheppard NF. LabCD (TM): A platform for automated life sciences research. Abstr Papers Am Chem Soc. 2001;221:U103–U103. [Google Scholar]
- 35.Snow C. Flow cytometer electronics. Cytometry A. 2004;57:63–69. doi: 10.1002/cyto.a.10120. [DOI] [PubMed] [Google Scholar]
Associated Data
This section collects any data citations, data availability statements, or supplementary materials included in this article.