

LEARNING OBJECTIVES
To become aware of the most practical measures of hydration status.
To describe sources of water input and output and the basics of water balance.
To understand how hydration status may impact daily cognitive performance.
CONDENSED VERSION AND BOTTOM LINE
Water is a crucial nutrient and euhydration is necessary for optimal daily functioning. Water balance is precisely regulated within the body and many methods exist for assessing hydration status. Cognitive performance measures an individual’s attentiveness, critical thinking skills, and memory. Traditionally a 2% or more body water deficit was thought to produce cognitive performance decrements; however, recent literature suggests that even mild dehydration – a body water loss of 1–2% – can impair cognitive performance. Counseling clients about their health and wellbeing should include conveying the importance of water for normal body functioning, as well as its effects on physical and cognitive performance.
Keywords: fluid, cognitive function, hydration assessment, water intake, mood
Although it is often overlooked as an essential nutrient, water is vital for life as it serves several critical functions. Total body water comprises approximately 45–75% of a person’s body weight (27). Muscle mass is 70–75% water, while water in fat tissue can vary between 10 and 40% (25). Water acts as a transporter of nutrients, regulates body temperature, lubricates joints and internal organs, provides structure to cells and tissues, and can help preserve cardiovascular function (26). Water consumption may also facilitate weight management (15,17). Water deficits can impact physical performance (25,38), and recent research suggests that cognitive performance may also be impacted (4,13,20–22,35,36). This article will address water balance, hydration assessment, and the effect of water balance on cognitive performance.
Water Balance
Water balance (i.e., input vs. output) is influenced by dietary intake, physical activity level, age, and environmental conditions. Although total body water balance is tightly regulated over a 24-hour period (25), deficits and excesses can occur. Dehydration develops from inadequate fluid intake or excessive fluid losses, and overhydration can result from excessive water (or fluid) intake with or without proper electrolyte replacement (25,33).
Water output and its regulation
The skin, kidneys, lungs, and digestive system are all sources of water output (Figure 1). Environmental factors (e.g., humidity, temperature) and intensity and duration of physical activity also impact urine output (e.g. increased urine output in colder climates, decreased urine output in hot climates and greater water loss via sweat with longer duration activities) (25). Respiratory water loss averages 250–350mL/d in sedentary adults; however, physical activity can increase losses to about 600mL/d (19,25). Insensible water loss, which includes sweat loss, can vary with environmental conditions (i.e. wind speed, humidity, and sun exposure), activity level, body composition, degree of physical fitness, and other variables (e.g. clothing worn, sweat rate) (19,25,38). On average insensible water losses are about 450mL/d; however, during vigorous physical activity in a hot environment, losses in excess of 3L/hr are possible (37). Urine output generally ranges 1000–2000mL/d, but can be altered by exercise and heat strain (25). Gastrointestinal and fecal water output accounts for 100–300mL/d (19,25,27). Total water output is estimated to be approximately 1500–3100mL/d for adults in temperate climates (19,25).
Figure 1.
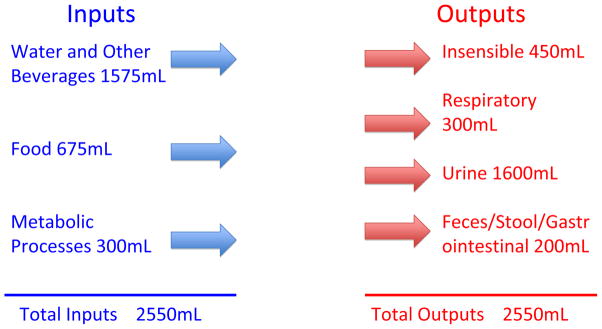
Average daily fluid balance in adults.
One cup equals 237 mL. Adapted from Jéquier and Constant, 2010.
When water loss exceeds intake, blood volume decreases and plasma osmolality increases. The reduction in blood volume decreases blood pressure, leading to increases in renin and angiotensin II concentrations. The latter, along with aldosterone, promote sodium and chloride reabsorption in the kidneys and thus water via osmosis, and decreased urine output. Increased blood osmolality and angiotensin II stimulates the hypothalamus and arginine vasopressin (AVP) is released, promoting renal water retention and reduced urinary output. Increased plasma osmolality also stimulates thirst through peripheral osmoreceptors in the mouth and gastrointestinal tract to replace the remaining water lost. Baroreceptors promote AVP release and thirst when reductions in plasma volume are significant; however, this mechanism is not as sensitive as the osmotic regulation of thirst (31).
Water input and its regulation
Water input comes from food and beverage ingestion, and normal metabolic processes (Figure 1). There are regulated or physiological (e.g. osmoreceptors in the brain and mouth, baroreceptors in blood vessels and atrium) and non-regulated (e.g. social, cultural, behavioral) factors that influence water intake (25,35,43) and fluid balance. The thirst sensation is triggered with a body water loss of 1–2%; a range where physical and cognitive performance may decline (4,9,21,22,25,34,38). Typically, plasma osmolality is tightly maintained between 280–290mOsm/kg; however, an increase of approximately 1–3% creates a drive to drink (12,43).
Fluid water intake generally accounts for ~70–80% of total water consumed (25), and ~20–30% of total water intake comes from solid foods (5,19,25). In a typical sedentary adult, this represents ~7 cups (1575mL) from beverages, ~3 cups (675mL) from foods, and ~1 cup (300mL) from normal metabolic processes (27). Despite popular myths, coffee can be considered a source of fluid (7,25), and although alcohol may increase fluid losses short-term, it is not believed to result in significant water loss over a day’s time (25).
When fluid is consumed, osmoreceptors in the mouth are stimulated, which reduces AVP secretion. This allows the kidneys to release excess water, and preserve water balance. If plasma osmolality decreases and blood volume increases, the thirst sensation fades. The desire to drink may cease before achieving water balance (13), however plasma osmolality will remain elevated and thirst sensations may return until water homeostasis is achieved (12,43).
Hyperhydration and hyponatremi
Typically, healthy individuals can maintain water balance through urination when excess fluid is consumed; hyperhydration is not commonly encountered (19,25). However, during extreme and extended-duration exercise, excessive consumption of hypotonic fluids and sodium losses that exceed the rate of replacement, and sometimes even in the absence of overconsumption of fluids, can cause hyponatremia (25,33,38). Hyponatremia, which is defined as a blood sodium concentration lower than 135 mmol/L (25), can have serious health implications (19,25). Hyperhydration (i.e., “water intoxication”) can present with symptoms such as fatigue, lethargy, disorientation, confusion, headache, nausea, vomiting, and if not treated properly, coma and death (23,25). The signs and symptoms of dehydration and overhydration can be similar (i.e., light-headedness, dizziness, headaches, nausea, fatigue) (4,21,22,30). When working with clients, health and fitness professionals can utilize a variety of methods to assess the presence and nature of water imbalance, to insure clients receive proper treatment.
Methods to Assess Hydration Status
Hydration refers to having adequate fluid within body tissues, and it can be determined through a variety of methods. Dilution techniques, plasma osmolality, neutron activation analysis, and bioelectrical impedance spectroscopy can be used to assess hydration status in a laboratory setting, while thirst, 24-hour urine volume, change in weight (i.e. body mass), urine color and specific gravity can be used in the field (3). Others have extensively reviewed these techniques, their ease of use, and potential limitations (2,3,11,38); however, a brief discussion of practical measures to assess hydration status is provided.
Urine specific gravity (USG) is an accurate and rapid indicator of hydration status (2). A urine specimen is placed on the glass plate at one end of a handheld refractometer and, upon holding it up to natural light and looking through the eyepiece, a fitness professional can read the USG. Normal ranges are from 1.013–1.029; a USG of ≥1.030 suggests dehydration and 1.001–1.012 may indicate overhydration (2). USG is more indicative of recent fluid consumption versus overall chronic hydration status (8), however it can be used in conjunction with other practical measures of hydration status such as changes in body weight (19,38). In order to obtain accurate information, weight should be measured upon waking on three successive days, after voiding, and before consumption of any fluids (3,38). If fluctuations exceed ~1% from baseline, water imbalance may be present (3). While more subjective, urine color can be a marker of hydration status when used in combination with a more quantifiable method, such as USG (6,8,38). A person’s urine sample is compared to a color chart that identifies euhydration or the need to consume additional fluids (8,32). A lighter color indicates adequate hydration, while darker colors indicate the need for fluid consumption. However, diet, supplements, and medications can affect body weight and urine color (19,32), thus these factors must be considered when using this method.
Cheuvront and Sawka suggest athletes use the WUT framework, which takes into account not only body mass, but also degree of thirst and urine parameters (11) (available at: http://www.gssiweb.com/Article/sse-97-hydration-assessment-of-athletes). Additionally, a client’s usual fluid intake can be measured using the beverage intake questionnaire (BEVQ-15) (24), which can be rapidly administered by the practitioner (~3–4 minutes) to provide a valid and reliable estimate of total beverage intake (including water, juice, and sports drinks) in terms of volume and calories (24). Although there are several measures to estimate hydration status, all have limitations (3); using multiple methods may allow the health and fitness professional to obtain the most accurate assessment of a client’s hydration status (5,6,8,38).
Water Intake Recommendations
Water needs can vary from person to person – and no one person will need the same amount of fluid from one day to the next - thus, developing a recommended dietary allowance (RDA) for water is challenging. The Institute of Medicine (IOM) established an Adequate Intake (AI) for water, which is a guideline to help most healthy individuals avoid dehydration (25,26). Table 1 outlines the AI for total water and total fluid intake for various age groups. On average, Americans typically consume about one liter (~ 4 cups) of drinking water per day (40). While the AI addresses water needs of the general public, the health and fitness professional must consider an individual’s physical activity regimen and environment when assessing hydration needs (25,38). The ACSM’s Exercise and Fluid Replacement guidelines can be utilized when counseling clients on appropriate hydration strategies to avoid dehydration and overhydration. Dehydration can negatively impact physical performance (25,34,38), and the magnitude of decrements in physical performance may be influenced by fitness level, environmental acclimatization, and mode of activity (25,38). As the level of dehydration increases, physical performance decreases – that is, performance suffers with greater degrees of dehydration (25) – and recent literature suggests the same for cognitive performance (9,36,41).
Table 1.
The Institute of Medicine’s Water Intake Recommendations*.
| Age (years) | Total Daily Water Needs** | Total Fluid Intake Including Water | |
|---|---|---|---|
| Children | |||
| 1–3 | 6c (1300mL) | 4c (900mL) | |
| 4–8 | 7c (1700mL) | 5c (1200mL) | |
| Adolescents | |||
| Males | 9–13 | 10c (2400mL) | 8c (1800mL) |
| 14–18 | 14c (3300mL) | 11c (2600mL) | |
| Females | 9–13 | 9c (2100mL) | 7c (1600mL) |
| 14–18 | 10c (2300mL) | 8c (1800mL) | |
| Adults | |||
| Males | 19+ | 16c (3700mL) | 13c (3000mL) |
| Females | 19+ | 11c (2700mL) | 9c (2200mL) |
Adequate Intake (AI) for total water and total fluid intake including water in cups (c) and milliliters (mL). 1 cup = 8 fluid ounces; 1000mL = 33.8 fluid ounces.
Total water needs is the sum of plain drinking water and water from formulas, beverages, and foods consumed.
Cognitive performance and assessment
Cognition refers to the process or act of knowing - a person’s awareness and judgment. Cognitive functions can include a person’s concentration or attentiveness, concept learning, critical thinking, and memory (39). Likewise, motivation, mood, arousal, and physical health affect cognitive processing (39). Cognitive performance is a measure of cognitive functioning (39), or how someone uses their judgment, memory, reasoning, and concentration to complete one or more tasks. Many tests exist to measure cognitive performance; however, debate on which assessment method(s) is superior persists among practitioners (29). There are few standardized assessment methods, and causal mechanisms as to how dehydration may impact cognitive performance are unknown (30,35).
The degree of precision and/or rapidity of a response is commonly evaluated in cognitive performance assessments (39). For example, the time it takes for someone to respond to a visual stimulus would measure speed/reaction time and a word recall would measure an individual’s cognitive accuracy. Table 2 provides definitions of common terminology and examples of cognitive performance assessment methods.
Table 2.
Common measures and methods of cognitive performance assessment.
| Measure | Definition | Example of assessment method |
|---|---|---|
| Reaction Time | Measure of elapsed time to a response following an audio, visual, or gustatory stimulus (46). | Ruler drop test – a ruler is dropped between an individual’s extended index finger and thumb; the point on ruler where it was caught in cm is the recorded measure and can be converted into response time (28). More information about the ruler drop test can be found in reference #14. |
| Mood States | Prevailing emotional feelings. | Profile of mood states (POMS) – depending on the question, “How [the person feels] right now?” various descriptions of mood (e.g. anxiety, confusion, anger, fatigue, indifference) are rated on a 5-point scale (42). Additional information about the POMS and the test itself can be purchased at: http://www.mhs.com/product.aspx?gr=cli&prod=poms&id=overview |
| Working Memory/Short-term Memory | A test of how long someone can remember a certain number of words or numbers; it involves taking information and being able to process, absorb (i.e. retail and recall) information for more complex tasks such as learning, comprehension, and reasoning. | Word list of about 30 words with 1 minute to study and 1 minute to recall as many words as possible (9); another variation can be on a computer screen where time to response, correct and incorrect answers, and “false alarms” are recorded. |
| Vigilance | Degree of responsiveness to stimuli; quality or state of being alert; ability to recognize a stimulus over time; wakefulness, alertness, and attention; ability to pay attention over time. | Trail Making Test (TMT) A and B (42,44) – involves joining numbers 1–25 and/or numbers 1–13 and letters A-L, measured in seconds to completion with mistakes noted. Alternatively can be on computer where individual scans screen for the appearance of a difficult to recognize stimulus occurring infrequently. Once observed the individual is to press the space bar; this measure is in milliseconds with false alarms being categorized as responses more than two seconds after the stimulus is presented. A pdf copy of the TMT A and B with instructions and scoring can be found at: http://doa.alaska.gov/dmv/akol/pdfs/uiowa_trailmaking.pdf |
| Executive function | A compendium of mental processes used to organize, plan, strategize, pay attention, manage space and time, and remember details, and connect present action with past experiences (39). | No one test can measure executive function due to its complexity; however, individual tests assessing specific skills can measure the different facets of executive function. |
| Motor skills | Coordination of muscles to perform a specific act; can be complex (i.e. gross, e.g. slap shot in ice hockey) or simple (i.e. fine, e.g. posture while walking or sitting in a chair or the act of gasping) movements. | Range of motion or physical performance parameters (e.g. walking on a straight line, jumping rope, or catching). |
| Visuoconstruction | Perception of object’s relationships with each other in combination with fine motor skills. | Copying (redrawing) a 3-D object like a cube or drawing a clock at a specified time with all numbers (10). |
Two cognitive assessments that may be of practical use for the fitness professional are the ruler drop test and Trail Making Test (TMT) A and B (1,14,42,44). To conduct a ruler drop test the practitioner holds a ruler vertically hovering above the outstretched dominant hand’s index finger and thumb of a client. The zero centimeter line of the ruler is parallel to the client’s thumb. The client catches the ruler following the practitioner “dropping” it without notification. The distance is recorded and can converted into a reaction time or interpreted as follows: Poor: >28cm; Below average: 204-28cm; Average: 15.9–20.4cm; Above average: 7.5–15.9cm; and Excellent: <7.5cm (14). The TMT can measure vigilance and consists of form “A” on which a client is asked to connect 25 randomly placed numbers in sequence with a pen/pencil (42). The second form (i.e. “B”) is similar to the first except in addition to numbers, alphabetical letters are incorporated (42). For example, a client would have to connect the number 1 with letter A and connect A to number 2, which would then be connected to letter B, and B would be connected to 3, etc.(42). The outcome measure is time-to- completion and mistakes do not stop timing. Average score for form A is 29 seconds with scores greater than 78 seconds considered below average (1). On form B, average score is 75 seconds and below average is 273 seconds (1).
Due to the complexity involved with cognitive processes, a battery of assessments should be administered to obtain the most accurate analysis (45). One such battery is called the Montreal Cognitive Assessment 7.1 (MoCA) (10). This screening tool was developed to assess mild cognitive impairment and early Alzheimer’s dementia through attention and concentration, executive functions, memory, language, visuoconstructional skills, conceptual thinking, calculations, and orientation analyses (10). The MoCA can be administered in ~10 minutes and a normal score is considered 26 out of 30; however, scores of 24 may be acceptable (10). While the tool was extensively tested in adults aged ≥ 49 years, it can also detect mild cognitive impairments in younger, active individuals (16). The health and fitness professional may find the MoCA useful due to its rapid administration and scoring; however, if clients participate in contact sports or have experienced a concussion in years past, scores may be lower than suggested norms (16). The test and administration and scoring instructions can be found at http://www.mocatest.org/default.asp.
Cognitive performance and dehydration
Cognitive performance had previously been reported to decline at or above a 2% body water loss (22,25). The level of reduction in cognitive performance can depend on environmental and individual factors (e.g. level of fitness, acclimatization, and dehydration tolerance) (41) and it appears that as the level of dehydration increases, efficiency of cognitive processing decreases (36). In long distance walkers and runners, increased water intake has been associated with increased visual attentiveness and short-term memory (9). In women, aspects of mood (i.e. vigor, alertness, fatigue, calmness, confusion, happiness) were negatively affected during fluid deprivation (36). Children may also have decrements in cognitive functioning as a result of inadequate water intake (20).
Recently we have learned that even mild dehydration – a body water loss of 1–2% - can impair cognitive abilities (4,21). This amount of dehydration equates to about 1½-3 lbs of body weight loss for a 150 lb person, which could occur through routine daily activities (4). Since many individuals experience fatigue later in the day when their workout time approaches, this could be important for fitness professionals to discuss with their clients. Problems with cognitive performance that can occur with mild dehydration include poor concentration, increased reaction time, and short-term memory problems, as well as moodiness and anxiety (4,21). Water consumption affects cognitive performance in adults (18), and an adequate daily water intake is important for maintaining optimal cognitive functioning.
Most studies on hydration and cognitive performance are short-term (i.e., hours, days) and it is not certain if there are longer-term cognitive decrements resulting from hypohydration; however, a recent study suggests that even after replenishing a fluid deficit, effects on mood may persist (36). Meaning, even after achieving euhydration, cognitive functioning may be compromised. This is an area in need of additional research.
Case Study 1 (Feature Box)
Marion is a 38-year-old mother of three who works a full-time job from 8am to 4pm five days a week. The BEVQ-15 revealed that she typically consumes ~2700mL of fluid from beverages daily. You often train her at your gym in the afternoons, and on Monday she came to you after successfully completing a 10K on Saturday, and spending Sunday gardening and doing yard work with her family. It is the middle of August and when she shows up for her training session she was stating how tired and lethargic she feels and that she has been making careless mistakes at work, that her head has been “pounding all day”, and that she almost canceled the training session because she felt nauseous driving over from work. Marion’s baseline body weight is 150 pounds and from Friday on her weights are as follows:
Friday: 150lbs (0% change from baseline)
Saturday (race day): 151lbs (1% increase from baseline)
Sunday: 149lbs (<1% decrease from baseline)
Monday: 145lbs (~3% decrease from baseline)
You question Marion about her fluid intake and you find that her focus has not really been on hydration since finishing the race on Saturday. After obtaining a urine sample that was dark yellow you analyze Marion’s urine SG, which was 1.033. Suspecting that her fatigue and mistakes at work may be signs of compromised cognitive functioning, you administer the Montreal Cognitive Assessment (MoCA) (10) and her score is 22. Marion’s physical and cognitive signs and symptoms suggest she is dehydrated and her recent decreased morning body weight, USG, MoCA results, and urine color all confirm this. You provide Marion with guidelines for rehydration according to the ACSM (38) and make plans to follow up with her tomorrow afternoon.
Implications and Conclusions
Clients may experience mild dehydration – a 1–2% water loss – during routine daily activities (4,21,36). This may be a common problem, considering that adults drink only one liter (~ 4 cups) of water a day on average (40) – which is less than half of what is currently recommended by the IOM (25). The signs and symptoms of dehydration and overhydration can mirror each other, sharing light-headedness/dizziness, headaches, nausea, and fatigue - all subjective parameters sometimes used in hydration and cognition research (4,21,22,30,36). When working with clients, health and fitness professionals can utilize a number of means to assess water imbalances (e.g. urine SG, body weight, and urine color) to insure that clients receive proper treatment. Additionally, fitness professionals can educate their clients on monitoring their own hydration status through morning body weight and the WUT framework (11) and when counseling patients on fluid needs before, during, and following exercise, the health and fitness professional can utilize the ACSM’s Exercise and Fluid Replacement guidelines (38). However, if a client has a chronic medical condition such as hypertension, cardiovascular disease, or diabetes, referring them to a registered dietitian for a personalized hydration plan may be necessary.
Cognitive functions, such as concentration, vigilance, memory, and critical thinking can be measured through a variety of cognitive performance assessments. While there is no consensus as to which method of assessment is superior (29), tests like the ruler drop test, Trail Making Test A & B (42), and MoCA (10) may be practical means for the health and fitness professional to rapidly assess a client’s cognitive processing. Similar to physical performance, cognitive performance has been observed to decline at levels >2% body water loss (22,25), but recent research shows that mild dehydration (i.e. 1–2% body water loss) may impair cognitive performance (4,21). Current literature provides insight into how cognitive functioning may be influenced by hydration status. However, the long-term consequences of dehydration on cognitive parameters and the mechanism by which fluid imbalances impact cognitive performance are unknown (35) - areas where future research efforts are needed.
Biographies

Shaun Riebl, MS, RD, is a doctoral student in the Water INTERface Interdisciplinary Graduate Education Program (IGEP) and Department of Human Nutrition, Food, and Exercise (HNFE) at Virginia Tech.

Brenda Davy, PhD, RD, FACSM, is the program director of the Water INTERface IGEP and an associate professor of HNFE and at Virginia Tech. Her research interests include investigating lifestyle strategies to prevent and treat obesity and related comorbidities, and beverage consumption and weight control.
Footnotes
CONFLICT OF INTEREST: None declared.
Contributor Information
Shaun K Riebl, Email: sriebl@vt.edu, Department of Human Nutrition, Foods and Exercise (0430), 229A Wallace Hall, Virginia Polytechnic Institute and State University, Blacksburg, VA 24061, ph. 540.231.7918.
Brenda M. Davy, Email: bdavy@vt.edu, Laboratory for Eating Behaviors and Weight Management, Department of Human Nutrition, Foods and Exercise (0430), 221 Wallace Hall, Virginia Polytechnic Institute and State University, Blacksburg, VA 24061, ph. 540.231.6784, fax 540.231.3916.
References
- 1.Alaska Department of Administration. Mature Drivers: Cautions and Concerns. [Accessed April 30, 2013.];Trail Making Test (TMT) Parts A & B. http://www.doa.alaska.gov/dmv3/akol/mature_driver.htm.
- 2.Armstrong LE. Hydration assessment techniques. Nutr Rev. 2005 Jun;63(6 Pt 2):S40–54. doi: 10.1111/j.1753-4887.2005.tb00153.x. [DOI] [PubMed] [Google Scholar]
- 3.Armstrong LE. Assessing hydration status: the elusive gold standard. J Am Coll Nutr. 2007 Oct;26(5 Suppl):575S–584S. doi: 10.1080/07315724.2007.10719661. [DOI] [PubMed] [Google Scholar]
- 4.Armstrong LE, Ganio MS, Casa DJ, et al. Mild dehydration affects mood in healthy young women. J Nutr. 2012 Feb;142(2):382–388. doi: 10.3945/jn.111.142000. [DOI] [PubMed] [Google Scholar]
- 5.Armstrong LE, Johnson EC, Munoz CX, et al. Hydration biomarkers and dietary fluid consumption of women. Journal of the Academy of Nutrition and Dietetics. 2012 Jul;112(7):1056–1061. doi: 10.1016/j.jand.2012.03.036. [DOI] [PubMed] [Google Scholar]
- 6.Armstrong LE, Maresh CM, Castellani JW, et al. Urinary indices of hydration status. Int J Sport Nutr. 1994 Sep;4(3):265–279. doi: 10.1123/ijsn.4.3.265. [DOI] [PubMed] [Google Scholar]
- 7.Armstrong LE, Pumerantz AC, Roti MW, et al. Fluid, electrolyte, and renal indices of hydration during 11 days of controlled caffeine consumption. Int J Sport Nutr Exerc Metab. 2005 Jun;15(3):252–265. doi: 10.1123/ijsnem.15.3.252. [DOI] [PubMed] [Google Scholar]
- 8.Armstrong LE, Soto J, Hacker F, Jr, Casa D, Kavouras S, Maresh CM. Urinary indices during dehydration, exercise, and rehydration. Int J Sport Nutr. 1998;8(4):345. doi: 10.1123/ijsn.8.4.345. [DOI] [PubMed] [Google Scholar]
- 9.Benefer MD, Corfe BM, Russell JM, Short R, Barker ME. Water intake and post-exercise cognitive performance: an observational study of long-distance walkers and runners. Eur J Nutr. 2012 May 11; doi: 10.1007/s00394-012-0364-y. [DOI] [PubMed] [Google Scholar]
- 10.Carolan Doerflinger DM. (try this: Best Care Practices in Nursing Care to Older Adults - general Assessment Series.). [Accessed April 30, 2013.];Mental Status Assessment in Older Adults: Montreal Cognitive Assessment: MoCA Version 7.1 (Original Version) 2012 (3.2) http://consultgerirn.org/uploads/File/trythis/try_this_3_2.pdf.
- 11.Cheuvront SN, Sawka MN. SSE #97: Hydration Assessment of Athletes. Sports Science Exchange. 2005;18(2):1–12. [Google Scholar]
- 12.Colorado State University. [Accessed January 14, 2012];Pathophysiology of the Endocrine System [e-Textbook] 2006 http://www.vivo.colostate.edu/hbooks/pathphys/endocrine/index.html.
- 13.D’Anci KE, Constant F, Rosenberg IH. Hydration and cognitive function in children. Nutr Rev. 2006 Oct;64(10 Pt 1):457–464. doi: 10.1301/nr.2006.oct.457-464. [DOI] [PubMed] [Google Scholar]
- 14.Davis B, Bull R, Roscoe J. Physical education and the study of sport. Mosby; 2000. [Google Scholar]
- 15.Davy BM, Dennis EA, Dengo AL, Wilson KL, Davy KP. Water consumption reduces energy intake at a breakfast meal in obese older adults. J Am Diet Assoc. 2008 Jul;108(7):1236–1239. doi: 10.1016/j.jada.2008.04.013. [DOI] [PMC free article] [PubMed] [Google Scholar]
- 16.Debert CT, Benson BW, Dukelow S. Montreal cognitive assessment (MoCA): baseline evaluation of cognition in the athletic population. Br J Sports Med. 2013 Apr 1;47(5):e1. [Google Scholar]
- 17.Dennis EA, Dengo AL, Comber DL, et al. Water consumption increases weight loss during a hypocaloric diet intervention in middle-aged and older adults. Obesity (Silver Spring) 2010 Feb;18(2):300–307. doi: 10.1038/oby.2009.235. [DOI] [PMC free article] [PubMed] [Google Scholar]
- 18.Edmonds CJ, Crombie R, Ballieux H, Gardner MR, Dawkins L. Water consumption, not expectancies about water consumption, affects cognitive performance in adults. Appetite. 2013 Jan;60(1):148–153. doi: 10.1016/j.appet.2012.10.016. [DOI] [PubMed] [Google Scholar]
- 19.EFSA Panel on Dietetic Products Nutrition and Allergies (NDA) Scientific Opinion on Dietary Reference Values for Water. EFSA Journal. 2010;8(3):1459–1507. [Google Scholar]
- 20.Fadda R, Rapinett G, Grathwohl D, et al. Effects of drinking supplementary water at school on cognitive performance in children. Appetite. 2012 Dec;59(3):730–737. doi: 10.1016/j.appet.2012.07.005. [DOI] [PubMed] [Google Scholar]
- 21.Ganio MS, Armstrong LE, Casa DJ, et al. Mild dehydration impairs cognitive performance and mood of men. Br J Nutr. 2011 Nov;106(10):1535–1543. doi: 10.1017/S0007114511002005. [DOI] [PubMed] [Google Scholar]
- 22.Grandjean AC, Grandjean NR. Dehydration and Cognitive Performance. J Am Coll Nutr. 2007 Oct;26(suppl 5):549S–554S. doi: 10.1080/07315724.2007.10719657. [DOI] [PubMed] [Google Scholar]
- 23.Grandjean AC, Reimers KJ, Buyckx ME. Hydration: issues for the 21st century. Nutr Rev. 2003 Aug;61(8):261–271. doi: 10.1301/nr.2003.aug.261-271. [DOI] [PubMed] [Google Scholar]
- 24.Hedrick VE, Savla J, Comber DL, et al. Development of a Brief Questionnaire to Assess Habitual Beverage Intake (BEVQ-15): Sugar-Sweetened Beverages and Total Beverage Energy Intake. J Acad Nutr Diet. 2012;112(6):840–849. doi: 10.1016/j.jand.2012.01.023. [DOI] [PMC free article] [PubMed] [Google Scholar]
- 25.Institute of Medicine of the National Academies. Water. Dietary Reference Intakes for Water, Sodium, Chloride, Potassium and Sulfate. Washington, D.C: National Academy Press; 2005. pp. 73–185. [Google Scholar]
- 26.Institute of Medicine of the National Academies. Dietary Reference Intakes: The Essential Guide to Nutrient Requirements. The National Academies Press; 2006. [Google Scholar]
- 27.Jequier E, Constant F. Water as an essential nutrient: the physiological basis of hydration. Eur J Clin Nutr. 2010 Feb;64(2):115–123. doi: 10.1038/ejcn.2009.111. [DOI] [PubMed] [Google Scholar]
- 28.Kent M. The Oxford Dictionary of Sports Science & Medicine. 3. Oxford University Press; 2007. [Google Scholar]
- 29.Lieberman HR. Nutrition, brain function and cognitive performance. Appetite. 2003 Jun;40(3):245–254. doi: 10.1016/s0195-6663(03)00010-2. [DOI] [PubMed] [Google Scholar]
- 30.Lieberman HR. Hydration and cognition: a critical review and recommendations for future research. J Am Coll Nutr. 2007 Oct;26(5 Suppl):555S–561S. doi: 10.1080/07315724.2007.10719658. [DOI] [PubMed] [Google Scholar]
- 31.Menninger RP. Current concepts of volume receptor regulation of vasopressin release. Fed Proc. 1985 Jan;44(1 Pt 1):55–58. [PubMed] [Google Scholar]
- 32.Mentes JC, Wakefield B, Culp K. Use of a urine color chart to monitor hydration status in nursing home residents. Biol Res Nurs. 2006 Jan;7(3):197–203. doi: 10.1177/1099800405281607. [DOI] [PubMed] [Google Scholar]
- 33.Montain SJ, Cheuvront SN, Sawka MN. Exercise associated hyponatraemia: quantitative analysis to understand the aetiology. Br J Sports Med. 2006 Feb;40(2):98–105. doi: 10.1136/bjsm.2005.018481. discussion 198–105. [DOI] [PMC free article] [PubMed] [Google Scholar]
- 34.Murray B. Hydration and physical performance. J Am Coll Nutr. 2007 Oct;26(5 Suppl):542S–548S. doi: 10.1080/07315724.2007.10719656. [DOI] [PubMed] [Google Scholar]
- 35.Popkin BM, D’Anci KE, Rosenberg IH. Water, hydration, and health. Nutr Rev. 2010 Aug;68(8):439–458. doi: 10.1111/j.1753-4887.2010.00304.x. [DOI] [PMC free article] [PubMed] [Google Scholar]
- 36.Pross N, Demazieres A, Girard N, et al. Influence of progressive fluid restriction on mood and physiological markers of dehydration in women. Br J Nutr. 2012 Apr 13;:1–9. doi: 10.1017/S0007114512001080. [DOI] [PMC free article] [PubMed] [Google Scholar]
- 37.Rehrer NJ, Burke LM. Sweat losses during various sports. Australian Journal of Nutrition and Dietetics. 1996;53(Supplement 4):S13–S16. [Google Scholar]
- 38.Sawka MN, Burke LM, Eichner ER, Maughan RJ, Montain SJ, Stachenfeld NS. American College of Sports Medicine position stand. Exercise and fluid replacement. Med Sci Sports Exerc. 2007 Feb;39(2):377–390. doi: 10.1249/mss.0b013e31802ca597. [DOI] [PubMed] [Google Scholar]
- 39.Schmitt JA, Benton D, Kallus KW. General methodological considerations for the assessment of nutritional influences on human cognitive functions. Eur J Nutr. 2005 Dec;44(8):459–464. doi: 10.1007/s00394-005-0585-4. [DOI] [PubMed] [Google Scholar]
- 40.Sebastian RS, Wilkinson Enns C, Goldman JD. Drinking Water Intake in the U.S.: What We Eat In America, NHANES 2005–2008. [Accessed October 22, 2012.];Dietary Data Brief No 7. 2011 Sep; http://www.ars.usda.gov/SP2UserFiles/Place/12355000/pdf/DBrief/7_water_intakes_0508.pdf.
- 41.Secher M, Ritz P. Hydration and cognitive performance. J Nutr Health Aging. 2012 Apr;16(4):325–329. doi: 10.1007/s12603-012-0033-0. [DOI] [PubMed] [Google Scholar]
- 42.Spreen O, Strauss E. A Compendium of Neuropsychological Tests: Administration, Norms, and Commentary. 2. New York: Oxford University Press; 1998. [Google Scholar]
- 43.Stipanuk MH, Caudill MA. Biochemical, Physiological, and Molecular Aspects of Human Nutrition. Elsevier Health Sciences; 2012. [Google Scholar]
- 44.Tombaugh TN. Trail Making Test A and B: normative data stratified by age and education. Arch Clin Neuropsychol. 2004 Mar;19(2):203–214. doi: 10.1016/S0887-6177(03)00039-8. [DOI] [PubMed] [Google Scholar]
- 45.Westenhoefer J, Bellisle F, Blundell JE, et al. PASSCLAIM--mental state and performance. Eur J Nutr. 2004 Jun;43(Suppl 2):II85–II117. doi: 10.1007/s00394-004-1204-5. [DOI] [PubMed] [Google Scholar]
- 46.Woodworth RS, Schlosberg H. Experimental psychology. New York: Holt; 1954. [Google Scholar]