

Abstract
MicroRNAs (miRNAs), small non-coding RNAs, regulate gene expression primarily at the posttranscriptional level. We previously found that miR-335 is critically involved in the regulation and differentiation capacity of human mesenchymal stem cells (hMSCs) in vitro. In this study, we investigated the significance of miR-335 for the therapeutic potential of hMSCs. Analysis of hMSCs in ex vivo culture demonstrated a significant and progressive increase in miR-335 that is prevented by telomerase. Expression levels of miR-335 were also positively correlated with donor age of hMSCs, and were increased by stimuli that induce cell senescence, such as γ-irradiation and standard O2 concentration. Forced expression of miR-335 resulted in early senescence-like alterations in hMSCs, including: increased SA-β-gal activity and cell size, reduced cell proliferation capacity, augmented levels of p16 protein, and the development of a senescent-associated secretory phenotype (SASP). Furthermore, overexpression of miR-335 abolished the in vivo chondro-osseous potential of hMSCs, and disabled their immunomodulatory capacity in a murine experimental model of lethal endotoxemia. These effects were accompanied by a severely reduced capacity for cell migration in response to pro-inflammatory signals and a marked reduction in Protein Kinase D1 (PRKD1) phosphorylation, resulting in a pronounced decrease of AP-1 activity. Our results demonstrate that miR-335 plays a key role in the regulation of reparative activities of hMSCs and suggests that it might be considered a marker for the therapeutic potency of these cells in clinical applications.
Keywords: Mesenchymal stem cells, miRNA, Immunotherapy, Aging
Introduction
Human mesenchymal stem cells (hMSCs) have become an important tool for cell-based therapeutic strategies. These cells can be easily isolated and expanded from the stroma of virtually all organs, although the preferred sources are bone marrow and subcutaneous fat. Experimental and clinical models have demonstrated conclusively that administration of ex vivo-expanded hMSCs can be effective in ameliorating some of the most prevalent clinical conditions which are currently poorly responsive to more conventional therapies (reviewed in [1]). In vivo, hMSCs are engaged in general tissue homeostasis, including cell proliferation, differentiation and migration, as well as regulation of angiogenesis and the immune response [2]. However, the molecular mechanisms which govern their biological and therapeutical activities remain unclear. Additionally, the poorly-understood therapeutic properties of hMSCs are sensitive to culture conditions during ex vivo expansion, and are also negatively affected by donor age [3–6].
From extensive studies on primed differentiation of murine embryonic stem (ES) cells it was concluded that efficient maintenance of stem cells requires a highly coordinated regulation of gene expression [7, 8], involving both coding genes and noncoding RNAs (ncRNAs). Among the several regulatory elements involved in the regulation of stem cell function, microRNAs (miRNAs) play an important role. miRNAs are an abundant class of small ncRNAs that regulate the translation, stability and localization of target messenger RNAs; computational predictions of miRNA targets indicate that greater than 60% of all human protein-coding genes are regulated by miRNAs [9, 10]. Functional studies in ES cells have shown that miRNAs play essential roles, particularly in regulating the balance between self-renewal and differentiation [11, 12]. Less information is available on the role(s) of specific miRNAs in the regulation of MSC therapeutic activity; however, a number of relevant examples have been described, addressing areas from specific differentiation potential to hMSC aging (see Supplementary Table S1).
Using the same rational that allowed the dissection of self-renewal and differentiation mechanisms in ES cells, we attempted to identify miRNAs which are important for controlling the transition between the self-renewing (undifferentiated) and the reparative (differentiated) phenotypes in human bone marrow-derived MSCs. We found that miR-335 is the sole miRNA in hMSCs that is significantly downregulated in response to diverse differentiation stimuli [13]. In addition, miR-335 is the most highly upregulated miRNA in hMSCs in comparison with dermal fibroblasts, in agreement with previous data [14]. Up to that point, the only well-characterized description of miR-335 was its identification as a metastasis suppressor in human breast cancer cells [15]. We found that forced expression of miR-335 impairs the cell migratory capacity of primary bone marrow-derived hMSCs [13]. This finding has very interesting implications in view of our data showing that hMSC differentiation is associated with miR-335 downregulation. Indeed, we found that forced miR-335 expression also inhibits osteogenic and adipogenic differentiation of hMSCs in vitro. Thus, miR-335 is part of a common regulatory pathway for both cell migration and differentiation in hMSCs. The existence of such an overlapping regulatory circuitry for diverse biological processes has been demonstrated previously in MSCs, in addition to other cell lineages [16, 17]. Our data also established that miR-335 expression in hMSCs is regulated by the canonical WNT signaling pathway, which has been described as a regulator of MSC self-renewal, and by γ interferon, a pro-inflammatory cytokine that plays an important role in activating the immunomodulatory properties of hMSCs. We could associate all these effects with 62 putative targets of miR-335, which are strongly enriched for transcription regulators [13]. Taken together, these results strongly suggested that miR-335 downregulation could be a major trigger for the initiation of activities involved in tissue repair and remodeling, including cell migration and differentiation. However, the importance of miR-335 regulation for in vivo therapeutic activity of hMSCs, together with its possible role in immune regulation and its potential relationship with aging/senescence-related loss of reparative potential, remained to be addressed.
Here we demonstrate that both aging and prolonged ex vivo expansion of hMSCs, induces a progressive increase in miR-335 expression. Our results show that a relatively high level of miR-335 expression in hMSCs is associated with cell senescence alterations, and results in an essential loss of their therapeutic capacity. Mechanistically, this is linked to a significantly reduced capacity to activate protein kinase D1 (PRKD1), which in turn reduces the activity of the AP-1 transcription factor.
Materials and Methods
Cell Culture
Bone marrow-derived hMSCs were obtained from Inbiobank Stem Cell Bank (http://www.inbiobank.org), and cultured in low glucose (1 g/L) Dulbecco’s modified Eagle’s medium (DMEM) supplemented with 10% fetal bovine serum (FBS), 2 mM glutamine, and penicillin (100 U/ml)/streptomycin (1000 U/ml). All culture reagents were obtained from Sigma-Aldrich, St. Louis, MO, http://www.Sigma-Aldrich.com). Cells were cultured at 37°C in a humidified 5% CO2/95% air atmosphere incubator and were passaged once per week, and media was changed twice weekly. Cell proliferation and SA-β-Gal activity were quantified as described in Supplementary Information. In some experiments, cells were γ-irradiated as described (Supplementary Information). The study was carried out in accordance with guidelines of the Instituto de Salud Carlos III (Madrid, Spain).
Lentiviral transduction
The lentiviral vectors pLV-EmGFP-MIR335, (encoding the human miR-335 gene) and pLV-EmGFP-Mock (encoding a non-specific shRNA sequence) were described previously [13]. The lentiviral vector encoding the telomerase reverse transcriptase catalytic subunit (pRRL.hTERT) has also been described [18].
Real-time quantitative PCR
Total RNA was isolated from cultured cells with the miRNeasy mini prep Kit (Qiagen, Valencia, CA, http://www1.qiagen.com). Transcripts of human miR-335, MAF, ATF3, JUN, JUNB, FOS, FOSB, COX2, IGF2, CXCL12, H19, PTGS2, TP53, CDKN1A, CDKN2A, AKAP9, RNASE2 and SCIN were quantified by real-time reverse transcription (RT)-PCR using the corresponding TaqMan® Gene Expression Assays (Applied Biosystems, Foster City, CA, http://www.appliedbiosystems.com). RNU48 and GAPDH genes were used as endogenous normalization controls for miRNAs and protein-coding genes, respectively. For quantification of IL6 and IL8 expression, quantitative PCR was performed using the Roche Universal ProbeLibrary (Roche Diagnostics, Basel, Switzerland, http://www.roche-applied-science.com) with α-tubulin as endogenous control, and the following primer-probe combinations: IL6 (Probe 45; F: GCCCAGCTATGAACTCCTTCT, R: GAAGGCAGCAGGCAACAC), IL8 (Probe 72; F: AGACAGCAGAGCACACAAGC, R: ATGGTTCCTTCCGGTGGT), and α-tubulin (Probe 58; F: CTTCGTCTCCGCCATCAG; R: TTGCCAATCTGGACACCA).
Nuclear Morphometric Analysis (NMA)
Analysis of nuclear morphometry was performed as described [19], using fixed cells permeabilized with 0.1% triton X-100, and labeled with 4,6-diamidino-2-phenylindole dihydrochloride hydrate (DAPI; Sigma-Aldrich). The percentage of small and regular nuclei was determined as described [19].
Immunofluorescence
Cells were cultured on glass chamber slides, fixed with 4% paraformaldehyde (PFA) for 10 min, and permeabilized with 0.1% Triton in phosphate-buffered saline (PBS). Samples were blocked for 30 min at room temperature with 5% goat serum and incubated with the primary antibody against p16 (clone G175-405; BD-Pharmingen, San Diego, CA, http://www.pharmingen.com) or Lamin B1 (M-20; Santa Cruz Biotech, Santa Cruz, CA, http://www.scbt.com), and the appropriate secondary antibody conjugated with Cy3. Images were quantified using the CellProfiler™ software (http://www.cellprofiler.org).
Secretome analysis
Subconfluent cultures (10,000 cells/cm2) were washed and incubated in serum-free DMEM for 24 h to generate conditioned medium (CM), which was collected and cells counted. CM was analyzed using a custom human 51-plex Luminexassay (Affymetrix, Santa Clara, CA, http://www.affymetrix.com), as described in Supplementary Information.
Western blot analysis
Whole-cell lysates for western blotting were prepared as described [4], and protein lysates were resolved by 10% SDS-PAGE and transferred to polyvinylidene difluoride (PVDF) membranes (Invitrogen, Carlsbad, CA, http://www.invitrogen.com). Membranes were blocked with 5% non-fat milk for 1 h at room temperature and subsequently incubated overnight at 4°C with primary antibodies at the following dilutions: JUN, p-JUN, FOS, p-FOS, JUNB 1:500 (60A8, D47G9, 9F6, D82C12, C37F9, respectively; all from Cell Signaling Technology, Danvers, MA, http://www.cellsignal.com); Mn-SOD2 1:500 (06-984; Millipore, Billerica, MA, http://www.millipore.com); p21 and p53 1:200 (sc-756, sc-99, respectively; Santa Cruz); β-actin 1:5000 (8226, Abcam, Cambridge, MA, http://www.abcam.com); p16 1:500 (554079; BD Pharmingen, San Jose, CA, http://www.bdbiosciences.com); PKD/PKCμ, Phospho-PKD/PKCμ (Ser916), Phospho-PKD/KCμ (Ser744/748) 1:1000 (2052, 2051, and 2054, respectively; Cell Signaling Technology), were used for SER 910 and 938/942 detection respectively; SRF 1:500 (NBP1-61263; Novus Biologicals, Littleton, CO, http://www.novusbio.com). Signals were detected using the appropriate peroxidase-conjugated secondary antibody (Dako, Glostrup, Denmark, http://www.dako.com). Western blots were scanned and quantified by densitometry using ImageJ software (NIH, Bethesda, MD, www.nih.gov).
Flow cytometry analysis of mitochondrial mass and reactive oxygen species (ROS) production
MSCs were detached with trypsin and resuspended in HBSS/Ca/Mg phenol-red-free medium (Sigma-Aldrich) at 106 cells/ml. Samples were incubated at 37°C in the dark with 5 μM dihydroethidium (DHE) red for 30 min, or with 1 μM MitoSOX™ Red, or 100 nM MitoTracker® Deep red probes for 30 min (all probes from Molecular Probes, Invitrogen). Cells were counter-stained with TOPRO-3 (for cells incubated with DHE or MitoSOX) or DAPI (for cells incubated with MitoTracker), to visualize the nuclei.
Diffusion chamber in vivo culture
Diffusion Chambers (DCs) were assembled from commercially available components (Millipore). Cell-loaded DCs (one per animal) were implanted subcutaneously into 8-week-old Fisher-344 rats. DCs were removed from the animals 4 weeks after implantation and fixed in 20% buffered formalin. The harvested chambers were decalcified in 4% EDTA solution, and then dehydrated with an ethanol gradient prior to embedding in paraffin wax. Standard histopathological analysis was performed on sections (5 μm) following hematoxylin and eosin staining, type I collagen, Sirius red (for collagen), mineralization by von Kossa, as well as Alcian blue and toluidine blue (for cartilage detection).
Lymphocyte proliferation assay
Buffy coat preparations were obtained from whole blood of healthy volunteers following the guidelines of the Centro de Transfusión de la Comunidad de Madrid, Spain. Human peripheral blood mononuclear cells (PBMCs) were isolated from the buffy coats by density sedimentation on Ficoll-Hypaque (Sigma-Aldrich) gradients (20 min, 2000 rpm, at room temperature). PBMCs (105) were cultured in duplicate with Roswell Park Memorial Institute (RPMI) complete medium in the presence of phytohemagglutinin (PHA, 10 μg/ml, Sigma-Aldrich) with or without various amounts of hMSCs (2×10³ to 5×10⁴) in flat-bottom 96-well plates. Proliferation was evaluated after 72 h culture by BrdU incorporation (Roche Applied Science).
Induction of endotoxemia and sepsis
Endotoxemia was induced in 7- to 10-week-old BALB/c male mice (Harlan Laboratories, Gannat, France) by intraperitoneal (i.p.) injection of 400 μg lipopolysaccharide (LPS)/mouse (E. coli serotype 055:B5; Sigma-Aldrich) as described [20]. All experiments were performed in accordance with institutional guidelines for the Care and Use of Laboratory Animals in Research, and were approved by CNIC.
Macrophage culture
Peritoneal exudate mouse cells were elicited in 8-week-old BALB/c male mice (Harlan Laboratories) by i.p. injection of 2 ml of 3% sterile sodium thioglycolate (Sigma-Aldrich). Cells were obtained 3 days later by peritoneal lavage with cold PBS, washed in cold RPMI medium and cultured in RPMI complete medium at 106 cells/ml. Macrophage monolayers (106 cells/well) were incubated with RPMI complete medium in the absence or presence of LPS (1 μg/ml), and hMSCs (1:5 hMSC:macrophage cell ratio). To determine the cell-contact dependence of the co-culture response, LPS-stimulated macrophages (106) were placed in the upper insert of a transwell system (0.8 μm pore, Corning Inc., Corning, NY, http://www.corning.com), and hMSCs (2×10⁵) were placed in the lower well. Cell-free supernatants were collected after 24 h incubation, and cytokine levels were determined as described in Supplementary Information. For the generation of macrophage-CM, macrophages were cultured for 24 h at 80% confluence in RPMI complete medium containing LPS (1 μg/ml).
Cell migration assay
The in vitro migratory potential of hMSCs, was evaluated by transwell migration assays in response to the following stimuli: HMG1 (10 ng/mL), fMLP (10 nM), SDF1 (1 ng/mL), TNFα (2.5 μig/ml), PDGBB (0.1 mg/ml), and macrophage-conditioned medium (Mϕ-CM; diluted 2:3 in RPMI complete medium). hMSCs (1.5×10⁴) were cultured in fresh medium without FBS in a 24-well tissue culture insert with an 8 μm pore size membrane (Corning). Inserts were placed on top of wells containing the different stimuli. After 6 h, (3 h for Mϕ-CM) filter membranes were washed with PBS, and non-migrated cells were removed from the upper side using a cotton swab. Finally, membranes were fixed with 4% PFA and mounted in mounting medium containing DAPI. Migration of hMSCs was calculated by counting the number of DAPI-stained nuclei on the underside of the membrane under X200 magnification using CellProfiler™ image analysis software.
Statistical and functional analysis
Statistical analysis of experimental data was performed with Prism 5.0 (Graphpad Software Inc., San Diego, CA, USA, http://www.graphpad.com). All values are expressed as mean ± standard error of mice/experiment. Unless otherwise stated, differences between groups were assessed by double-tailed Student’s t-test. Survival curves were analyzed by the Mantel-Cox log-rank test. Results were considered statistically significant at p<0.05. Functional gene analysis was generated as described in Supplementary Information.
Results
miR-335 expression is associated with hMSC aging
Our previous studies identified miR-335 as the only miRNA consistently downregulated in hMSCs in all differentiation regimes tested, and its forced expression in hMSCs reduced their proliferation and differentiation capacity [13]. To further examine the regulation of miR-335 expression, we subjected a panel of bone marrow-derived naïve hMSCs to different environmental stimuli associated with the promotion of senescence, and measured expression levels by qRT-PCR. Compared with early passage cells, prolonged culture of hMSCs (>7 weeks) resulted in a significant increase in miR-335 expression (3.4–10.2 fold) in all hMSCs tested (Fig. 1A). miR-335 expression was also dependent on the oxygen tension used during culture, with mild hypoxia (3% O2, for 7 days) significantly decreasing the level of miR-335 (Fig. 1B). Furthermore, expression of miR-335 was transiently increased by γ-irradiation (0.5–10 Gy, Fig. 1C); while stimulation of hMSCs with a range of pro-inflammatory growth factors resulted in a significant decrease of expression (Fig. 1D). Interestingly, miR-335 expression was also dependent on the donor age of bone marrow-derived hMSCs (Fig. 1E), and we found a strong positive correlation between the level of miR-335 and donor age from 15–55 years (Fig. 1E; Pearson’s r=0.9205, p=0.0033). This result prompted us to examine the possible effect of telomerase for expression of miR-335. Telomerase activity prevents cells dividing recursively from reaching their Hayflick limit [21] and has been inversely correlated with aging [22, 23]. Results demonstrated that the increase in miR-335 expression during ex vivo culture was abolished by forced expression of TERT (Fig. 1F). Collectively, these findings indicated that an increase in miR-335 expression was associated with hMSC aging/senescence and could be prevented by telomerase expression.
Figure 1.
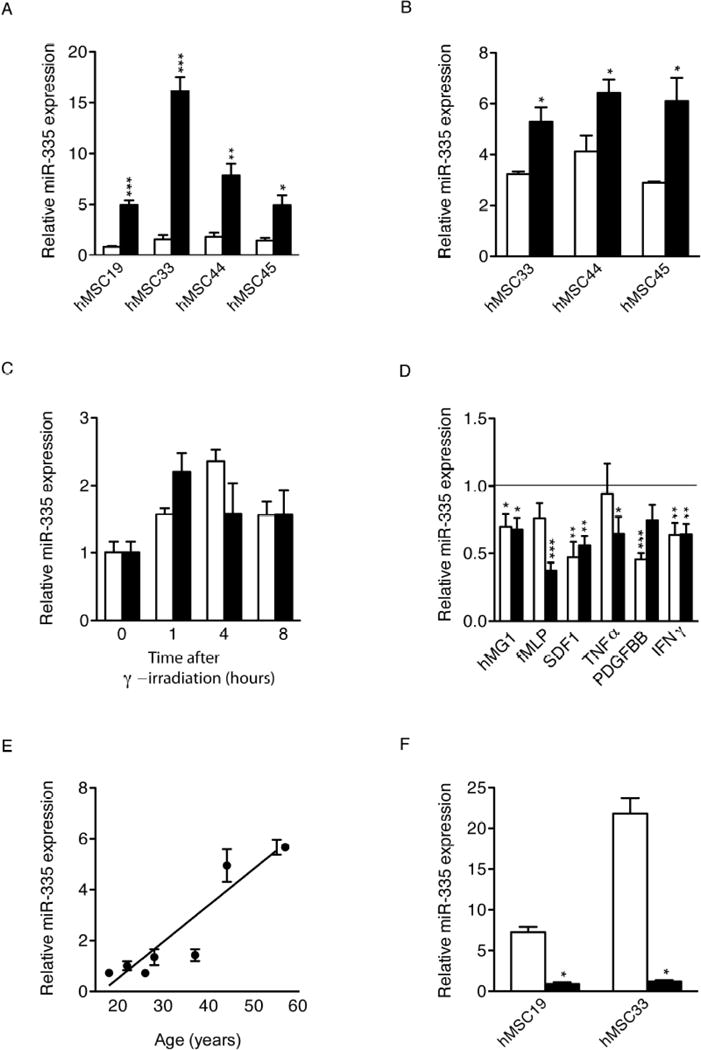
Regulation of miR-335 expression in cultured human mesenchymal stem cells under different stimuli. Relative expression levels of miR-335 were measured by real-time RT-PCR (RNU6B as endogenous control) in hMSCs cultured in different conditions or after specific stimuli. (A): hMSCs from different donors were cultured over several passages; miR-335 was measured at early passage (1 to 2 weeks in culture; white bars) and late passage (>7 weeks in culture; black bars). (B): miR-335 expression was quantified in hMSCs cultured for 7 days at 3% and 20% oxygen concentration (white and black bars, respectively). (C): miR-335 levels were determined in hMSCs at 1, 4 and 8 hours after treatment with different doses of γ-irradiation (0.5 and 10 Gy; white and black bars, respectively). Data are expressed relative to the miR-335 level in untreated cells. (D): miR-335 expression was quantified at 24 (white bars) and 48 hours (black bars) after treatment with the indicated cytokines. Data are expressed relative to the miR-335 level in untreated cells (E): A correlation curve was produced for miR-335 expression and age of donor; a significant correlation was confirmed. (F): hMSCs overexpressing hTERT (black bars) or wild type cells (white bars) were serially passaged over an extended period of time and miR-335 expression was quantified. *p<0.05; **p<0.005, ***p<0.005. Error bars represent s.e.m. (N=3).
Forced expression of miR-335 induces senescence-related changes in hMSCs
Given the positive correlation between miR-335 expression and senescence/aging, we wondered whether forced overexpression of miR-335 could induce a senescence/aging phenotype in hMSCs. To consider this, independent hMSCs were transduced with a lentiviral vector encoding the genomic sequence spanning miR-335 (335-hMSC), or with a control vector (control-hMSCs), and transduced cells were purified to >95% homogeneity (GFP-positive cells) by FACS [13]. Comparative analyses of control- and 335-hMSCs in culture demonstrated that miR-335 overexpression resulted in manifold changes associated with cell senescence, including: reduced proliferation (Fig. 2A), morphological alterations (greater cell size, more vacuoles and an increased nuclear irregularity index; Fig. 2B), and a larger proportion of SA-β-gal positive cells (Fig. 2C). Furthermore, 335-hMSCs exhibited reduced expression of Lamin B1 (Fig. 2D), a protein lost in senescent cells [24]. In contrast, no significant differences were found in the cell cycle between control and miR-335-overexpressing cells (Supplementary Fig. S1), and genetic stability was comparable between both cell types, as monitored by karyotype analysis and comparative genomic hybridization (data not shown).
Figure 2.
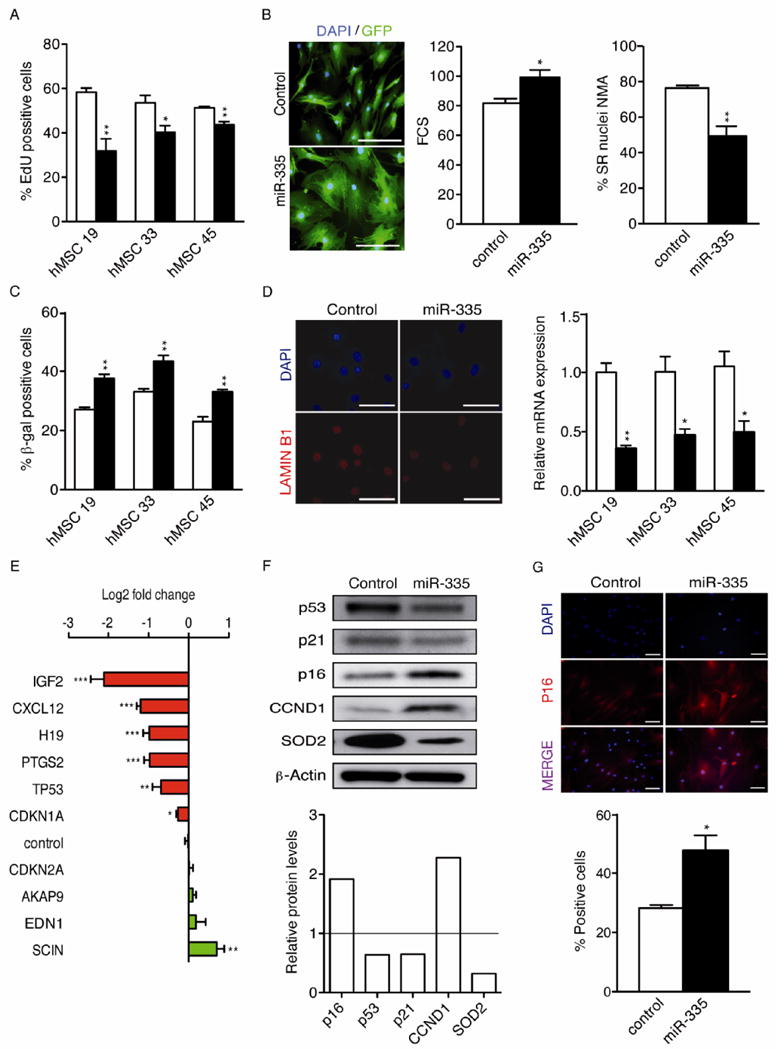
Forced expression of miR-335 induced senescence-related changes in hMSCs. Bone marrow-derived hMSCs were transduced with the lentiviral vectors pLV-EmGFP-MIR335 or pLV-EmGFP-mock (encoding a negative control shRNA), and transduced (gfp+) cells were purified by FACS. The purified cells (335- and control-hMSCS, respectively) were used to analyze different markers previously associated with senescence in hMSCs. (A): Percentage of proliferating 335- and control-hMSCs by EdU imaging. White bars, control-hMSCs; black bars, 335-hMSCs. (B): Alterations in cell size and morphology. Left panel, representative images showing alterations in morphology and cell size similar to those seen in senescent cells, scale bar represents 100 μm. Middle panel: cell size was measured by FSC-A using FACS. Right panel: DAPI-stained nuclei were analyzed for size and irregularity using the NMA tool, as described in materials and methods, and the percentage of small and regular nuclei (SR) is shown. At least 200 nuclei were analyzed for each data point. White bars, control-hMSCs; black bars, 335-hMSCs. (C): SA-β-gal staining of senescent cells induced by overexpression of miR-335. White bars, control-hMSCs; black bars, 335-hMSCs. (D): Lamin B1 expression was quantified in 335- and control-hMSCs by real-time RT-PCR (α-tubulin as endogenous control). White bars, control-hMSCs; black bars, 335-hMSCs. Representative immunofluorescence images of Lamin B1 expression in 335- and control-hMSCs are shown in the left panel; scale bar represents 100 μm. (E): Real-time RT-PCR quantification of mRNA transcripts in 335- versus control-hMSCs (GAPDH as endogenous control). (F): Western blot of p53, p21, p16, CCND1, SOD2 and β-actin. The lower histogram shows protein quantification by pixel density analysis using ImageJ software, normalized to the β-actin signal. (G): Immunofluorescence staining of p16 in 335- and control-hMSCs. DAPI staining was used to define total cell counts. The percentage of p16 positive cells is shown in the lower panel; scale bar represents 100μm; white bars, control-hMSCs; black bars, 335-hMSCs. *p<0.05; **p<0.005; ***p<0.001. Error bars represent s.e.m. (N=3).
Guided by these results, we next analyzed the expression of candidate genes that have been previously associated with replicative senescence. These genes included TP53 [25], CDKN1A, CDKN2A [26], PTGS2 [27], and six genes that we have recently defined as markers of replicative senescence in hMSCs (SCIN, EDN1, AKAP9, CXCL12 [4], H19 and IGF2 (García et al., submitted). Compared with control cells, 335-hMSCs showed a statistically significant increase in the expression of SCIN, and a decrease in IGF2, CXCL12 and H19 (Fig. 2E), supporting a pro-senescence activity of miR-335. In contrast, miR-335 overexpression resulted in a significant decrease in TP53 (p53) and CDKN1A (p21) mRNA, and also protein (Fig. 2E and 2F, respectively). Notably, the clear reduction of PTGS2 (COX2) expression observed in 335-hMSCs (Fig. 2E) is contrary to that previously observed in aged cells [27]. Interestingly, western blot analysis of 335-hMSCs also revealed a reduction in the steady-state levels of SOD2 (Fig. 2F), a protein whose deficiency has been recently linked to cellular senescence [28]. Moreover, p16 and cyclin D1 (CCND1), which are known to be associated with cellular senescence [26], were significantly increased in 335-hMSCs (Fig. 2F), and immunofluorescence analysis confirmed this increase in p16 expression (Fig. 2G). Taken together, these data clearly suggested that increased expression of miR-335 could favor the evolution of hMSC senescence through a p53/p21-independent mechanism.
miR-335 overexpression induces a senescence-associated secretory phenotype in hMSCs
Previous work demonstrated that fibroblasts undergoing senescence growth arrest secrete myriad factors, including proteins associated with inflammation, and develop a senescence-associated secretory phenotype (SASP) [29]. To determine whether overexpression of miR-335 induced a similar senescence-related phenotype, we compared the secretome of 335-hMSCs and control cells using conditioned medium (CM) from confluent cells. CM was analyzed with Luminex antibody arrays designed to detect 51 secreted human proteins involved in intercellular signaling during inflammation (Supplementary Table S2). Results indicated a significant (t-test, p<0.05) increase in 12 out of 51 tested factors in CM from 335-hMSCs compared with control cells, with ratios of oversecretion between 2–3 fold (Fig. 3A). Those identified proteins showed upregulated levels (normalized to 105 cells/ml) between 0.89 pg/ml (IFNγ) and 300.23 pg/ml (IL6) in CM from 335-hMSCs (Fig. 3A). Comparable results were obtained in hMSCs made senescent by γ irradiation, although fewer proteins were differentially oversecreted in 335-hMSCs (23.5%, compared to 52.9% in γ-irradiated hMSCs; [30]). The differential secretome of 335-hMSCs was similar to results obtained from a previous characterization of SASP in senescent human primary fibroblasts [29]. Additionally, RT-PCR analysis of the key SASP factors, IL-6 and IL-8, confirmed previous observations [29] and indicated that proteins comprising SASP are generally upregulated at the mRNA level (Fig. 3B).
Figure 3.
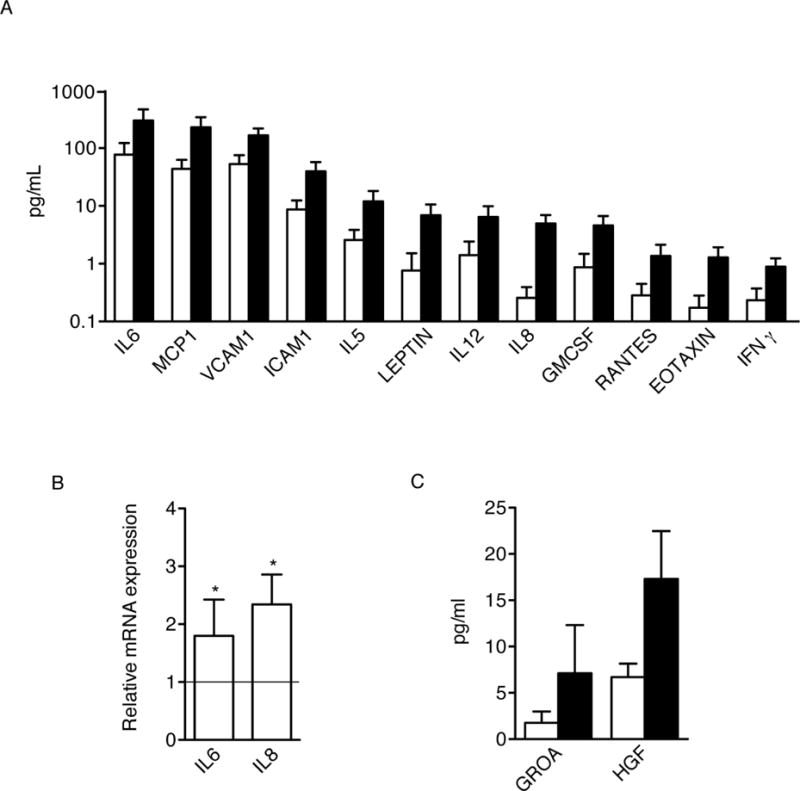
miR-335 promotes the acquisition of a senescence-associated secretory phenotype (SASP). (A): Conditioned medium (CM) from control- (white bars) and 335-hMSCs (black bars) obtained from three different donors was collected 24 h after serum starvation. Concentration of cytokines was analyzed by Luminex® multiplex assay. Protein levels were normalized to 105 cells/ml. Significant changes in protein levels are shown. (B): Relative IL6 and IL8 expression levels were quantified by real-time RT-PCR (α-Tubulin as endogenous control). (C): Significant changes in protein levels as measured by the same Luminex® multiplex assay in conditioned medium from control- (white bars) and 335-hMSCs (black bars), treated with LPS. *p<0.05. Error bars represent s.e.m. (N=3).
When CM from control and 335-hMSCs were obtained in the presence of 1 mg/ml LPS, to mimic a pro-inflammatory condition, only GROA and HGF were significantly oversecreted in 335-hMSCs (Fig. 3C). The immune system processes (Gene Ontology, GO terms) associated to all the identified upregulated proteins are shown in Supplementary Table S3.
miR-335 overexpression induces mitochondrial changes in hMSCs
Alterations in both mitochondrial content and function are associated with senescence [31]. To determine whether this phenotype was also discernible in hMSCs, we performed mitochondrial staining in 335- and control-hMSCs using MitoTracker (MT), a marker of mitochondrial mass that is independent of membrane potential [32]. While the pattern of mitochondrial staining was comparable between 335- and control-hMSCs (data not shown), FACS analysis demonstrated a significant increase in mitochondrial mass in 335-hMSCs (Fig. 4A). Furthermore, analysis with MitoSOX Red, a dye which specifically detects superoxide within the mitochondrial matrix, revealed a significant increase in superoxide in 335-hMSCs compared with control cells (fluorescence increase approximately 3-fold; p=0,013; Fig. 4A), and this increase remained significant when expressed per unit of mitochondrial mass (Fig. 4B; a representative example is shown in Fig. 4C). This finding was consistent with the reduction in SOD2 expression observed in 335-hMSCs (Fig. 2F). Additionally, an increase in the relative levels of both total and mitochondrial superoxide was detected in 335-hMSCs stained with dihydroethidium (Fig. 4A). Together, these findings indicated that forced expression of miR-335 in hMSCs induced a significant increase in mitochondrial ROS production, which is presumably compensated by an increase in mitochondrial biogenesis.
Figure 4.
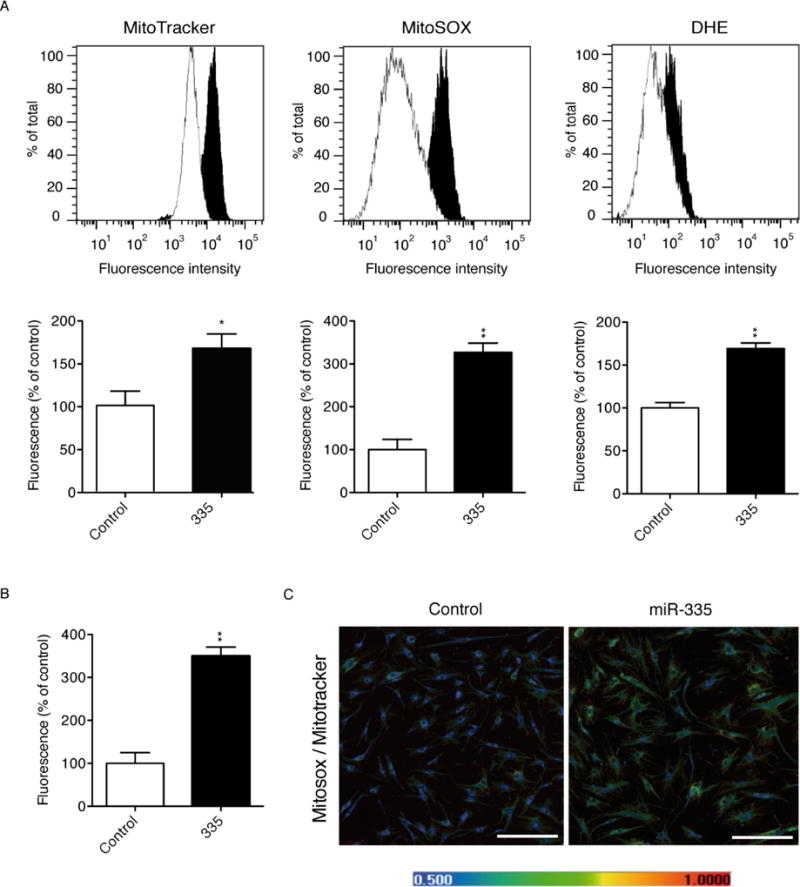
Forced miR-335 expression increases mitochondrial mass and ROS levels in hMSCs. (A): Upper panels, flow cytometry histograms of mitochondrial mass measured using MitoTracker®, and total and mitochondrial reactive oxygen species measured by DHE (di-hydroethidium) and MitoSOX™, respectively, in 335-(black histograms) and control-(white histograms) in hMSCs. Lower panels, relative fluorescence levels in 335-hMSCs shown as the percentage of control-hMSCs. (B): Relative fluorescence levels of mitochondrial reactive oxygen species measured with MitoSOX were normalized with fluorescence levels of mitochondrial mass using MitoTracker. Results in 335-hMSCs are shown as the percentage of control-hMSCs. (C): Representative confocal microscopy images of control- and 335 hMSCs after staining with MitoTracker, MitoSOX and DAPI. Color scale shows false color referring to increasing fluorescence MitoSOX:MitoTracker values, from lowest (blue) to highest (red), scale bar represents 500μm. *p<0.05; **p<0.005. Error bars represent s.e.m. (N=3).
Forced expression of miR-335 abrogates the in vivo chondro-osseous differentiation capacity of hMSCs
Previously, we demonstrated that forced expression of miR-335 in hMSCs strongly reduced their osteogenic differentiation potential in vitro [13]. To connect these observations with what happens in vivo, we utilized cell diffusion chambers in a rat model of osteogenesis. Control- and 335-hMSCs were first cultured in a collagen-gel medium containing 0.5% fetal bovine serum (FBS) for 10 days in the presence of recombinant human BMP2, followed by culture for 6 days in medium containing BMP2 and 10% FBS. This treatment has been described to be effective in initiating a chondro-osseous differentiation pathway in bone marrow hMSCs cultured in vitro [33]. After this 16-day period of differentiation, cells were placed inside diffusion chambers and implanted subdermically into the back of 8-week-old rats for 28 days. Whereas histological and immunohistochemical analyses provided clear evidence of collagen (Fig. 5A, panel 1–3; 6–9) cartilage (panel 6–9) and osteoid tissue (panel 4–9) inside the diffusion chambers seeded with control hMSCs, chambers seeded with 335-hMSCs failed to show any evidence of cartilage or osteoid tissue formation, and instead their content appeared as a mass of fibrous tissue (Fig. 5B). This complete abrogation of in vivo osteogenic potential demonstrated that miR-335 downregulation is physiologically necessary for bone differentiation of hMSCs.
Figure 5.

Chondro-osseous formation in hMSC-seeded diffusion chambers in vivo. In vitro predifferentiated preparations of control- (A) and 335-hMSC (B), by stimulation with BMP2 in a collagen-gel medium containing 0.5% fetal bovine serum (FBS) for 10 days, followed by culture for 6 days in medium containing BMP2 and 10% FBS, were placed inside diffusion chambers and implanted subdermically into the back of 8-week-old rats for 28 days. Photomicrographs of histological sections of diffusion chambers, four weeks after implantation, using different stains are shown. Asterisks mark the wall of the chamber. Picrosirius-Hematoxylin was used for detection of collagen under polarized light (panels 1, 2, 3, 10, 11, 12); panels (2) and (11) show higher magnification images, marked by dotted boxes in (1) and (10), respectively; (4) matrix calcification evidenced by Von Kossa staining; (5) cartilage tissue stained with Alcian Blue; (6, 9) anti-Collagen Type I staining; (7) collagen fibers in the bone matrix detected using Picrosirius Red staining; (8) cartilage-like matrix stained with Toluidine Blue. Representative images from four different animals/treatment are shown. Scale bars: panels 1 and 10, 1 mm; 2 and 11, 500 μm; 3 and 12, 200 μm; 4–9, 100 μm.
miR-335 is critical in modulating the immunoregulatory capacity of hMSCs
Given the established immunomodulatory properties of MSCs, we next investigated whether overexpression of miR-335 in hMSCs altered their capacity to regulate the immune response. Using co-culture assays, we first assessed the potential of hMSCs to inhibit cell proliferation of human PBMCs stimulated with phytohemagglutinin. Compared with control cells, 335-hMSCs displayed a reduced, but still significant, capacity to inhibit PBMC proliferation measured by BrdU incorporation, after 72 h culture (Fig. 6A, 30.8% vs. 47.9% inhibition at a 1:5 ratio). As hMSC administration has a strong therapeutic effect in experimental sepsis, by protecting against mortality caused by endotoxin [34, 35], we next investigated whether forced expression of miR-335 could influence mortality in a LPS-induced endotoxemia model. Thus, mice were injected with 400 μg of LPS, together with wild-type hMSCs, control-hMSCs or 335-hMSCs (106 cells/mouse), and mortality was monitored over 96 h. As expected, administration of wild-type or control-hMSCs rescued the majority of animals from LPS-induced lethality (Fig. 6B). In contrast, inoculation of an equivalent number of 335-hMSCs did not provide any significant protection against LPS, and mortality was comparable to the administration of vehicle (Fig. 6B).
Figure 6.
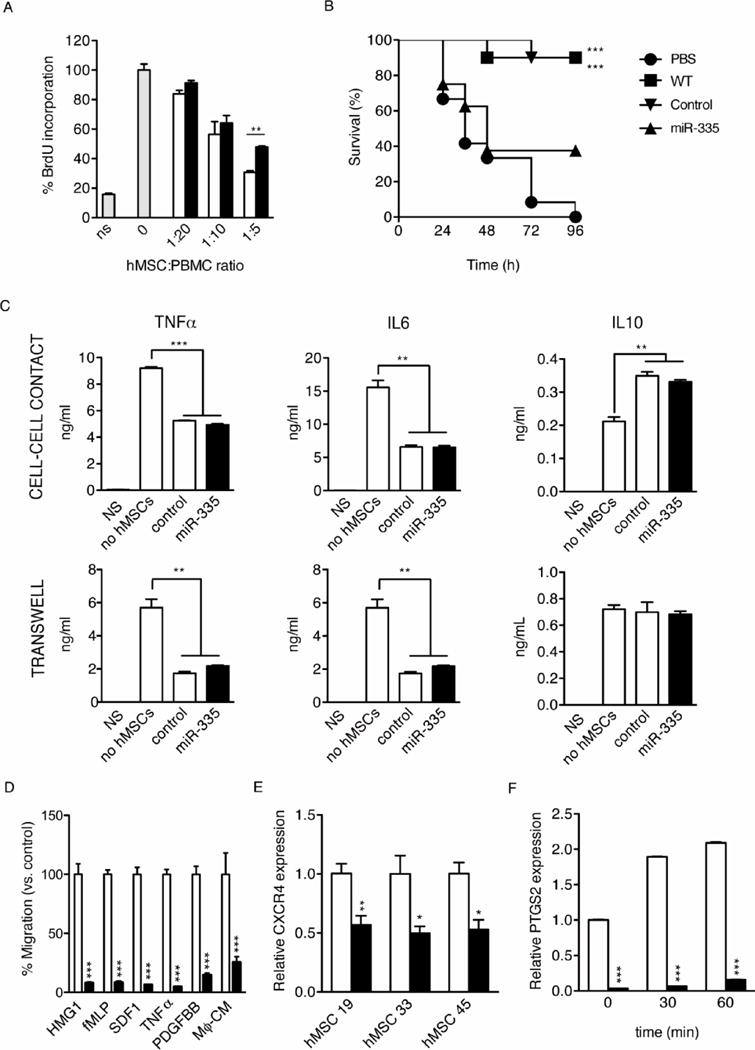
miR-335 overexpression inhibits the immuneregulatory effect of hMSCs. (A): Human PBMCs were stimulated or not (NS, non-stimulated) with phytohemagglutinin (PHA, 10 μg/ml), in the presence of different ratios of 335- or control-hMSCs (0:1 to 1:5 MSC/PBMC ratios). After 72 h of culture, proliferation was evaluated by BrdU incorporation. Gray bars, absence of hMSCs; white bars, control-hMSCs at the indicated ratios; black bars, 335-hMSCs at the indicated ratios. (B): Survival curves of mice (10 mice/group) after LPS injection and injection of 335- or control-hMSCs (PBS was used as a negative control). (C): Macrophages treated with LPS, were co-cultured with 335- or control-hMSCs. Macrophages cultured in the absence of LPS and hMSCs (NS) were used as negative controls. The co-culture was performed in the same well (cell-to-cell contact, upper panels) or in different compartments separated by a 0.8 μm-pore membrane using a transwell system (transwell, lower panels). Cytokine levels in the medium were determined after 24 h, by ELISA. (D): The migratory capacity of 335-hMSCs was quantified using a transwell migration assay. Different chemokines were used as stimuli. (E): CXCR4 expression levels measured by real-time RT-PCR in 335-and control-hMSCs (GAPDH as endogenous control). (F): PTGS2 expression levels measured by real-time RT-PCR in 335- and control-hMSCs after Mϕ-CM treatment at different time points (GAPDH as endogenous control). *p<0.05; **p<0.005, ***p<0.001. Error bars represent s.e.m. (N=3 in A, C–F).
hMSCs are known to promote the conversion of macrophages to a regulatory (M2) phenotype through the secretion of soluble factors [36–38]. To evaluate the potential modulation of macrophage activity by miR-335 overexpression, we utilized co-culture assays of hMSCs and macrophages, and measured the concentration of cytokines released 24 h after macrophage activation with LPS. Compared with macrophage-only cultures, results showed that TNFα and IL-6 were decreased to similar levels in co-cultures of both 335-hMSCs and control-hMSCs with activated macrophages (Fig. 6C). Additionally, IL-10 was increased in both co-culture systems in comparison with macrophage-only cells, but only if there was direct cell-to cell contact as described in previous studies [35]. These results suggest that macrophage modulation is not a major component of the immunoregulatory capacity of hMSCs by miR-335.
Transwell migration assays revealed that overexpression of miR-335 caused a consistent reduction in the migratory capacity of hMSCs tested with different specific stimuli (HMG-1, 8.1%; fMLP, 8.5%; SDF1, 6.5%; TNFα, 4.7%; and PDGFBB, 14.5%) and also with LPS-stimulated macrophage-conditioned medium (Mϕ-CM) (25.4% compared to control; Fig. 6D). Consistent with this reduction in cell motility, 335-hMSCs expressed lower membrane levels of CXCR4 (Fig. 6E) the receptor for CXCL12 (SDF-1), which has been demonstrated to be an important player in hMSC migration in vivo [39, 40].
One of the major regulatory factors involved in macrophage reprogramming by hMSCs is prostaglandin E2 (PGE2). PGE2 levels depend on the activity of COX-2 (PTGS2), an enzyme induced in MSCs after stimulation with activated macrophages [35]. As described earlier, PTGS2 expression was downregulated in 335-hMSCs relative to control cells in non-stimulated conditions (Fig. 2B). Stimulation of 335-hMSCs with Mϕ-CM containing LPS also resulted in a marked decrease in the induction of PTGS2 (Fig. 6F), suggesting that PTGS2 could be an important mediator for the regulation of the hMSC anti-inflammatory response by miR-335. Interestingly, a detailed analysis of the microarray expression data obtained for 335-hMSCs [13], using the Ingenuity Pathway Analysis tool, generated a network (score 24) including 26 of the regulated mRNAs which have PTGS2 as nodal molecule (Supplementary Fig. S2).
Downstream mediators of miR-335 function in hMSCs
Analyses of previously obtained differential gene expression data [13], revealed that most members of the AP-1 family of transcription factors (including MAF, ATF3, JUN, JUNB, FOS and FOSB) were significantly downregulated in 335-hMSCs (Supplementary Fig. S3). Notably, AP-1 mediates the response to a variety of extracellular stimuli and plays a key role in the regulation of diverse processes such as differentiation, proliferation and migration (reviewed in [41]). A downregulation of AP-1 components in three independent miR-335 expressing hMSC samples, measured under basal conditions, was detected by qRT-PCR, with the exception of ATF3 (Fig. 7A), and confirmed the previous microarray data [13]. Therefore, we hypothesized that regulation of the AP-1 complex by miR-3335 could be involved in both the control of hMSC migration and differentiation. When we measured expression of AP-1 components after stimulation of control- and 335-hMSCs with Mϕ-CM (used as a migratory stimuli, Fig. 6D), or BMP2 (used for chondro-osseous differentiation, Fig. 5), we found that under both conditions 335-hMSCs expressed significantly less JUN, JUNB, FOS, FOSB, ATF3 and MAF mRNA, and this was particularly evident with BMP2 stimulation (Fig. 7B). Western blot analysis confirmed the blunted expression of JUN protein in 335-MSCs after Mϕ-CM and BMP2 induction (Fig. 7C). Strikingly, both treatments resulted in an almost complete loss of FOS and p-FOS induction in 335-hMSCs compared with control cells (Fig. 7C). Since neither FOS nor JUN mRNA contain a miR-335 binding site, it seemed likely that AP-1 activity is regulated through an indirect mechanism. To address this possibility, we selected putative miR-335 targets that could have a direct effect on AP-1 activity [13], or an indirect impact on the MAPK kinase pathway leading to AP-1 activation (reviewed in [42]). These included Serum response factor (SRF), a transcription factor involved in FOS regulation [43], and Protein kinase D1 (PRKD1), a key regulator of MAPK activation [44, 45]. Thus, hMSCs were stimulated with Mϕ-CM, and the expression of SRF and PKD1 were measured by immunoblotting. Compared with control hMSCs, Mϕ-CM-stimulated 335-hMSCs had a moderate reduction in SRF protein (Fig. 7D). On the other hand, whereas total PRKD1 protein did not differ significantly between groups, phosphorylation on residues Ser738/742 and Ser910 of PRKD1 was decreased markedly (greater than 60%) in 335-hMSCs compared with control cells, after stimulation with Mϕ-CM. Notably, PRKD1 plays a pleiotropic role in the regulation of many cellular processes, including cell migration and differentiation [46, 47]. Accordingly, reduction in the phosphorylation of critical regulatory residues in PRDK1 could reduce MAPK activation, and impact on downstream signaling cascades, including AP-1. In turn, a reduction in the activity of the AP-1 complex could abrogate the migration and differentiation characteristics of MSCs.
Figure 7.
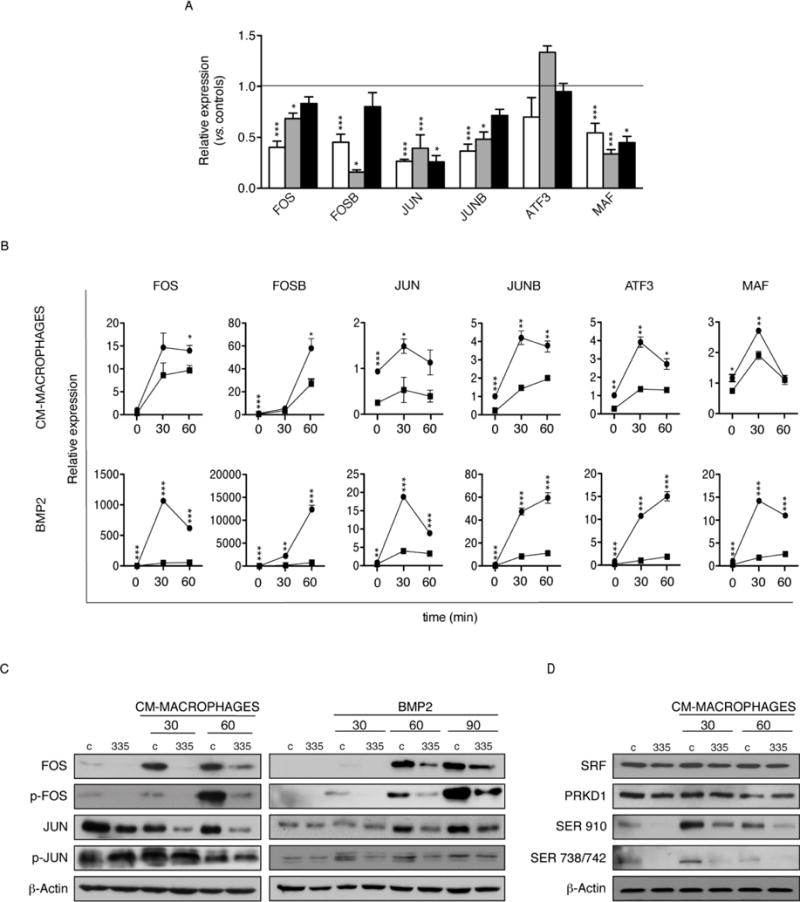
AP-1 activation in response to migration and differentiation stimuli is modulated by miR-335. (A): Relative basal expression levels of AP-1 components (MAF, ATF3, JUN, JUNB, FOS, FOSB; GAPDH as endogenous control) measured by real-time RT-PCR in 335-hMSCs from three different donors, versus the corresponding control-hMSCs. mRNA expression levels are presented as the relative fold-increase compared with control-hMSCs (horizontal line). The different colored bars correspond to three independent hMSC isolates. (B): Relative expression levels of AP-1 components in control- (black circles) and 335-hMSCs (black squares) after treatment with Mϕ-CM or BMP2 at indicated time points, measured by real-time RT-PCR. (C): Western blot analysis of AP-1 components after Mϕ-CM (left panel) and BMP2 (right panel) treatments at indicated times. Representative results from at least three experiments are shown. (D): Western blot analysis of SRF, PRKD1, and phospho-specific PRKD1 SER910 and SER738/742 protein levels after Mϕ-CM treatment at indicated times. Representative results from at least three experiments are shown. *p<0.05; **p<0.005; ***p<0.005. Error bars represent s.e.m. (N=3).
Discussion
We previously identified miR-335 as being uniquely downregulated in hMSCs early after induction of differentiation, and its forced expression negatively impacted proliferation, migration and differentiation of hMSCs in vitro [13]. These results led us to conclude that miR-335 was important for the maintenance of the undifferentiated state of hMSC and/or it must be downregulated to allow differentiation in this cell type. These features might conceivably explain its original description as a tumor suppressor [15, 48].
It is well established that, due to oxidative stress, primary cells maintained in culture evolve towards a state of senescence/aging, which in turn leads to a progressive loss of their biological activity [3, 49]. Analysis of hMSCs revealed a clear increase in the expression of miR-335 during extended periods of ex vivo culture. This finding, together with the observation that telomerase overexpression downregulates miR335, argued for a genuine role for miR-335 in the promotion of senescence/aging, and is in agreement with its negative impact on hMSC function [13]. Here we demonstrate that forced expression of miR-335 abolishes chondroosteogenic differentiation of hMSCs in vivo, and also significantly reduces their immunoregulatory properties in vivo. A very recent study has reported that miR-335 promotes chondrogenic differentiation in murine MSCs [50]. The discrepancy between these recent findings and those of this study might be due to a speciesspecific mechanism, or perhaps the different differentiation models used. The negative effects of miR-335 overexpression for both differentiation and immunoregulation of hMSCs can be at least partly explained by a decrease in their migratory capacity, together with a reduction in the expression of the migration receptor CXCR4. The fact that 335-hMSCs appear to maintain most of their intrinsic modulatory activity on macrophages suggest that the loss of their in vivo immunoregulatory activity is more likely due to their reduced migratory potential, rather than a defect in their signaling apparatus. These results are similar to those previously obtained by us in radiation-induced senescent hMSCs [30].
Interestingly, 335-hMSCs have lower basal levels of PTGS2 (COX-2), and fail to upregulate this gene in response to several stimuli. Of note, PTGS2 has been proposed to contribute to the establishment of the senescence phenotype and is known to be upregulated during both replicative and stress-induced senescence of cultured fibroblasts [27, 51, 52], and also during organismal aging [53–57]. However, it remains unclear whether the catalytic activity of PTGS2 is involved in the aging process [51], and paradoxically, constitutive overexpression of PTGS2 has been linked with cellular resistance to senescence in cancer cells [58]. Moreover, PTGS2 has been described as a key player in the immune regulatory activity of hMSCs and its loss appears to be a hallmark of the onset of cell senescence in this cell type [38].
In agreement with our findings, previous work has demonstrated an upregulation of both miR-335 and miR-34a in old (24-months-old), but not young (3-months-old), rat mesanglial kidney cells. In this model, senescence was mediated principally through inhibition of Sod2 and Txnrd2 by miR-335 and miR-34 respectively, which dramatically affected the mitochondrial antioxidant capacity of these cells [59]. Our data in 335-hMSCs also demonstrated a significant reduction in SOD2 expression, together with enhanced superoxide production by mitochondria; both are hallmarks of cellular senescence and aging [28]. It remains to be determined whether the observed increase in mitochondrial content is due to a deregulation of mitochondria biogenesis, or is simply an adaptation to the overall increased cellular size of 335-hMSCs. Nevertheless, these data strongly suggest that miR335 is regulating the progression of senescence.
A balance between cell growth and response to stress must exist to ensure that cells proliferate without accumulating damaged DNA. Consequently, optimal cell proliferation requires the coordination of pro-growth and stress-response pathways. While cellular senescence is considered a cellular stress response, and widely recognized as a potent tumor suppressive mechanism, it has also recently been acknowledged as a partner in degenerative and hyperplastic pathologies, most likely by promoting chronic inflammation and aging [60]. Senescent cells have been shown to exhibit a senescence-associated secretory phenotype (SASP) that can alter the tissue microenvironment and promote age-related pathology through secretion of growth factors and proteases [29]. SASP is a damage response, separable from growth arrest [61, 62], and variable with cell type and mode of senescence induction. In an effort to decode the molecular mechanisms influenced by miR-335, we compared the secretome of 335-MSCs with control-MSCs. As described for other cell types [29], we did not detect a selective response in 335-hMSCs; however, the secretion of more than the 20% of the analyzed factors was increased 2-3-fold. The majority of these factors have been previously characterized as part of SASP in fibroblasts, but with some specific differences likely related to the cell type [29, 63]. These results are therefore consistent with the association of miR-335 with senescence promotion.
An important finding in this study was the significant relationship between miR-335 and AP-1 activity. Members of the FOS family dimerize with JUN to form the AP-1 transcription factor, which upregulates the transcription of a diverse collection of genes [64]. Moreover, AP-1 activation is involved in the regulation of cell migration [65]. Whereas control hMSCs responded to BMP2 or Mϕ-CM treatments by increasing their expression of JUN, mainly at the level of mRNA, this was blunted in 335-hMSCs, particularly when stimulated with BMP2. However, greatest differences between cells were found in the protein expression levels of FOS and p-FOS, and miR-335 overexpression almost completely abrogated FOS expression (Fig. 7). FOS is upregulated in response to many extracellular signals, and phosphorylation by MAPK, PKA, PKC or CDK1 alters its activity and stability. Interestingly, hyporesponsiveness to growth factors is a fundamental feature of cellular senescence and, in several models including senescent human diploid fibroblasts and aged mice, a proportional reduction in the expression of Fos has been demonstrated [66]. Therefore, the impact of forced miR-335 expression on the level of active FOS could play an important role in senescence promotion.
As neither FOS nor JUN mRNAs harbor canonical target sequences for miR-335, we reasoned that their modulation must be regulated indirectly. From previous bioinformatic analyses, we selected a panel of predicted targets of miR-335 which were plausible upstream regulators of FOS/JUN. Among them, we demonstrated that SRF was moderately decreased by overexpression of miR-335, whereas PRKD1 was severely infraphosphorylated, both in basal and activated conditions.
SRF stimulates both cell proliferation and differentiation, and through binding to canonical serum response elements (SRE), regulates the activity of many immediate-early genes such as FOS, which is a downstream target of many pathways including vascular development [67] and heart fibrosis [68]. Information on the specific role of SRF in hMSC biology or senescence is limited; however, SRF knockdown abolished expression of αSMA induced by several differentiation stimuli in adipose tissue-derived hMSCs [69]. All these findings strongly suggest that even a moderate reduction of SRF expression could play a relevant role in miR-335-mediated induction of senescence in hMSCs.
PRKD1 has been proposed to act as a signal-regulated scaffold, integrating an assortment of different stimuli and influencing the subcellular localization of important partners. Phosphorylation of serines 910 and 738/742 by PKC, and their subsequent autophosphorylation, are associated with upregulated PRKD1 activity [70]. Besides these central regulatory modifications, additional phosphorylation of PRKD1 by p38, Src and c-Abl kinases have also been described to modulate its activity, as well as cleaveage by caspase-3 during apoptosis [70]. PRDK1 activation by DAPK1 has been implicated in the induction of autophagy in response to oxidative damage [71]. Hitherto, no specific role for PKRD1 has been described in hMSC biology or cellular senescence. Our results suggest that reduced activation of PRKD1 by miR-335 could result in severe reduction of AP-1 activity, although the precise mechanisms involved requires further study.
Collectively, our results propose a scenario whereby miR-335 promotes the evolution of hMSCs towards a senescent stage by reducing the activity of AP-1. In addition to oxidative damage [72] a decline in fos/AP-1 activity is typically associated with aging; basal levels appear similar in young and old animals but in the latter the capacity to modulate fos/AP-1 activity is greatly impaired [72]. A reduction of AP-1 expression seems likely to be related to cell senescence also, since JNK-deficient cells exhibit early p53-dependent senescence [73] and JNK is required for expression of the JUN and JUND components of AP-1. Indeed, a reduction of Fos in several brain regions has been also correlated with physiological aging [74].
Considering this, we compared miR-335 expression levels in a panel of hMSCs obtained from donors ranging from 18 to 55 years old, and found a direct correlation between miR-335 expression level and the age of the donor. Therefore it seems plausible that miR-335 levels could be a good marker of physiological aging. Consistent with this, previous work [75] demonstrated that miR-335 and miR-452 are the only two miRNAs that are upregulated in hMSCs obtained from adipose tissue of old donors in comparison with young donors. Additionally, this study demonstrated that aged hMSCs had reduced levels of FOS, JUN and ERK1/2, together with increased expression of NF-kB, MYC and IL4R. This is in good agreement with the majority of the phenotypes associated with forced expression of miR-335.
Conclusions
This study demonstrates that miR-335 must be downregulated to allow hMSCs to respond to regulatory and differentiation signals. Aging or prolonged culture of hMSCs induce a progressive and constitutive increase of miR-335 levels, rendering these cells less responsive to activation stimuli (pro-inflammatory and/or pro-differentiation signals), and more prone to aging/senescence. This state, which is reversed by telomerase, translates to an impaired capacity for cell migration, and is linked to reduced AP-1 activity. As miR-335 expression levels are closely linked to the therapeutic activity of hMSCs, we consider that this miRNA might be used as a valuable predictive marker to monitor therapeutic potency of individual preparations of hMSCs-based medicinal products.
Supplementary Material
Acknowledgments
We thank Dr. E. Samper for his valuable help in data analysis and interpretation; S. Calleja and R. Alvarez (CNIC) for microarray hybridization; A. García and J.C. Ramírez (CNIC) for production of lentiviral stocks; F. Cabo (CNIC) for bioinformatics and statistical support, and K. McCreath for helpful discussions. This work was supported by a grant to MAG from the Spanish Ministry of Science and Innovation (SAF 2010-16065), by grants to AB from the Ministry of Economy and Competitiveness (SAF 2008-02099; PLE2009-0147 and PSE-010000-2009-3), Comunidad Autónoma de Madrid(S2010/BMD-2420), Red de Terapia Celular del Instituto de Salud Carlos III (TerCel) and the European Commission (FP7-HEALTH-2009/CARE-MI), and by a grant to JAA from the Ministry of Economy and Competitiveness (FIS PI13/00666). MAG was also supported by the “Miguel Servet” Program (CP07/00306) of the Instituto de Salud Carlos III (Ministry of Economy and Competitiveness, Spain). JCS was supported by PLE2009-0112. MT is currently a predoctoral fellow funded by the Spanish Programa de Formación del Profesorado Universitario (Ministry of Education, Culture, and Sports, Spain). The CNIC is supported by the Spanish Ministry of Economy and Competitiveness and the Pro-CNIC Foundation.
Footnotes
DISCLOSURE OF POTENTIAL CONFLICTS OF INTEREST
MT, MAG, and AB are inventors of a patent application in part based on findings described in this article. The other authors have no potential conflicts of interest.
AUTHOR CONTRIBUTIONS
M.T.: Collection and/or assembly of data, manuscript writing; J.C.S.: Collection and/or assembly of data; M.D.: Collection and/or assembly of data, data analysis and interpretation; J.A.A.: Collection and/or assembly of data, data analysis and interpretation; J.C.: Data analysis and interpretation; M.A.G.: Conception and design, financial support, data analysis and interpretation, manuscript writing; A.B.: Financial support, data analysis and interpretation, manuscript writing and final approval of manuscript.
References
- 1.DelaRosa O, Dalemans W, Lombardo E. Mesenchymal stem cells as therapeutic agents of inflammatory and autoimmune diseases. Curr Opin Biotechnol. 2012;23:978–983. doi: 10.1016/j.copbio.2012.05.005. [DOI] [PubMed] [Google Scholar]
- 2.Bernardo ME, Locatelli F, Fibbe WE. Mesenchymal stromal cells. Ann N Y Acad Sci. 2009;1176:101–117. doi: 10.1111/j.1749-6632.2009.04607.x. [DOI] [PubMed] [Google Scholar]
- 3.Estrada JC, Albo C, Benguria A, et al. Culture of human mesenchymal stem cells at low oxygen tension improves growth and genetic stability by activating glycolysis. Cell Death Differ. 2012;19:743–755. doi: 10.1038/cdd.2011.172. [DOI] [PMC free article] [PubMed] [Google Scholar]
- 4.Estrada JC, Torres Y, Benguria A, et al. Human mesenchymal stem cell-replicative senescence and oxidative stress are closely linked to aneuploidy. Cell Death Dis. 2013;4:e691. doi: 10.1038/cddis.2013.211. [DOI] [PMC free article] [PubMed] [Google Scholar]
- 5.Kim M, Kim C, Choi YS, et al. Age-related alterations in mesenchymal stem cells related to shift in differentiation from osteogenic toadipogenic potential: implication to age-associated bone diseases and defects. Mech Ageing Dev. 2012;133:215–225. doi: 10.1016/j.mad.2012.03.014. [DOI] [PubMed] [Google Scholar]
- 6.Stolzing A, Jones E, McGonagle D, et al. Age-related changes in human bone marrow-derived mesenchymal stem cells: consequences for cell therapies. Mech Ageing Dev. 2008;129:163–173. doi: 10.1016/j.mad.2007.12.002. [DOI] [PubMed] [Google Scholar]
- 7.Fazzio TG, Huff JT, Panning B. An RNAi screen of chromatin proteins identifies Tip60-p400 as a regulator of embryonic stem cell identity. Cell. 2008;134:162–174. doi: 10.1016/j.cell.2008.05.031. [DOI] [PMC free article] [PubMed] [Google Scholar]
- 8.Ivanova N, Dobrin R, Lu R, et al. Dissecting self-renewal in stem cells with RNA interference. Nature. 2006;442:533–538. doi: 10.1038/nature04915. [DOI] [PubMed] [Google Scholar]
- 9.Lewis BP, Burge CB, Bartel DP. Conserved seed pairing, often flanked by adenosines, indicates that thousands of human genes are microRNA targets. Cell. 2005;120:15–20. doi: 10.1016/j.cell.2004.12.035. [DOI] [PubMed] [Google Scholar]
- 10.Friedman RC, Farh KK, Burge CB, et al. Most mammalian mRNAs are conserved targets of microRNAs. Genome Res. 2009;19:92–105. doi: 10.1101/gr.082701.108. [DOI] [PMC free article] [PubMed] [Google Scholar]
- 11.Kim KS, Kim JS, Lee MR, et al. A study of microRNAs in silico and in vivo: emerging regulators of embryonic stem cells. FEBS J. 2009;276:2140–2149. doi: 10.1111/j.1742-4658.2009.06932.x. [DOI] [PubMed] [Google Scholar]
- 12.Schoeftner S, Scarola M, Comisso E, et al. An Oct4-pRb axis, controlled by MiR-335, integrates stem cell self-renewal and cell cycle control. Stem Cells. 2013;31:717–728. doi: 10.1002/stem.1315. [DOI] [PubMed] [Google Scholar]
- 13.Tome M, Lopez-Romero P, Albo C, et al. miR-335 orchestrates cell proliferation, migration and differentiation in human mesenchymal stem cells. Cell Death Differ. 2011;18:985–995. doi: 10.1038/cdd.2010.167. [DOI] [PMC free article] [PubMed] [Google Scholar]
- 14.Bae S, Ahn JH, Park CW, et al. Gene and microRNA expression signatures of human mesenchymal stromal cells in comparison to fibroblasts. Cell Tissue Res. 2009;335:565–573. doi: 10.1007/s00441-008-0729-y. [DOI] [PubMed] [Google Scholar]
- 15.Tavazoie SF, Alarcon C, Oskarsson T, et al. Endogenous human microRNAs that suppress breast cancer metastasis. Nature. 2008;451:147–152. doi: 10.1038/nature06487. [DOI] [PMC free article] [PubMed] [Google Scholar]
- 16.Ge W, He F, Kim KJ, et al. Coupling of cell migration with neurogenesis by proneuralbHLH factors. Proc Natl Acad Sci U S A. 2006;103:1319–1324. doi: 10.1073/pnas.0510419103. [DOI] [PMC free article] [PubMed] [Google Scholar]
- 17.Boland GM, Perkins G, Hall DJ, et al. Wnt 3a promotes proliferation and suppresses osteogenic differentiation of adult human mesenchymal stem cells. J Cell Biochem. 2004;93:1210–1230. doi: 10.1002/jcb.20284. [DOI] [PubMed] [Google Scholar]
- 18.Beausejour CM, Krtolica A, Galimi F, et al. Reversal of human cellular senescence: roles of the p53 and p16 pathways. EMBO J. 2003;22:4212–4222. doi: 10.1093/emboj/cdg417. [DOI] [PMC free article] [PubMed] [Google Scholar]
- 19.Filippi-Chiela EC, Oliveira MM, Jurkovski B, et al. Nuclear morphometric analysis (NMA): screening of senescence, apoptosis and nuclear irregularities. PLoS One. 2012;7:e42522. doi: 10.1371/journal.pone.0042522. [DOI] [PMC free article] [PubMed] [Google Scholar]
- 20.Gonzalez-Rey E, Anderson P, Gonzalez MA, et al. Human adult stem cells derived from adipose tissue protect against experimental colitis and sepsis. Gut. 2009;58:929–939. doi: 10.1136/gut.2008.168534. [DOI] [PubMed] [Google Scholar]
- 21.Hayflick L, Moorhead PS. The serial cultivation of human diploid cell strains. Exp Cell Res. 1961;25:585–621. doi: 10.1016/0014-4827(61)90192-6. [DOI] [PubMed] [Google Scholar]
- 22.Bernardes de Jesus B, Vera E, Schneeberger K, et al. Telomerase gene therapy in adult and old mice delays aging and increases longevity without increasing cancer. EMBO Mol Med. 2012;4:691–704. doi: 10.1002/emmm.201200245. [DOI] [PMC free article] [PubMed] [Google Scholar]
- 23.Jaskelioff M, Muller FL, Paik JH, et al. Telomerase reactivation reverses tissue degeneration in aged telomerase-deficient mice. Nature. 2011;469:102–106. doi: 10.1038/nature09603. [DOI] [PMC free article] [PubMed] [Google Scholar]
- 24.Freund A, Laberge RM, Demaria M, et al. Lamin B1 loss is a senescence-associated biomarker. Mol Biol Cell. 2012;23:2066–2075. doi: 10.1091/mbc.E11-10-0884. [DOI] [PMC free article] [PubMed] [Google Scholar]
- 25.Shay JW, Pereira-Smith OM, Wright WE. A role for both RB and p53 in the regulation of human cellular senescence. Exp Cell Res. 1991;196:33–39. doi: 10.1016/0014-4827(91)90453-2. [DOI] [PubMed] [Google Scholar]
- 26.Stein GH, Drullinger LF, Soulard A, et al. Differential roles for cyclin-dependent kinase inhibitors p21 and p16 in the mechanisms of senescence and differentiation in human fibroblasts. Mol Cell Biol. 1999;19:2109–2117. doi: 10.1128/mcb.19.3.2109. [DOI] [PMC free article] [PubMed] [Google Scholar]
- 27.Zdanov S, Bernard D, Debacq–Chainiaux F, et al. Normal or stress-induced fibroblast senescence involves COX-2 activity. Exp Cell Res. 2007;313:3046–3056. doi: 10.1016/j.yexcr.2007.04.033. [DOI] [PubMed] [Google Scholar]
- 28.Velarde MC, Flynn JM, Day NU, et al. Mitochondrial oxidative stress caused by Sod2 deficiency promotes cellular senescence and aging phenotypes in the skin. Aging (Albany NY) 2012;4:3–12. doi: 10.18632/aging.100423. [DOI] [PMC free article] [PubMed] [Google Scholar]
- 29.Coppe JP, Patil CK, Rodier F, et al. Senescence-associated secretory phenotypes reveal cell-nonautonomous functions of oncogenic RAS and the p53 tumor suppressor. PLoS Biol. 2008;6:2853–2868. doi: 10.1371/journal.pbio.0060301. [DOI] [PMC free article] [PubMed] [Google Scholar]
- 30.Sepúlveda JC, Tomé M, Fernández ME, et al. Cell senescence abrogates the therapeutic potential of human mesenchymal stem cells in the lethal endotoxemia model. Stem Cells. 2014 doi: 10.1002/stem.1654. (in press) [DOI] [PMC free article] [PubMed] [Google Scholar]
- 31.Passos JF, Saretzki G, Ahmed S, et al. Mitochondrial dysfunction accounts for the stochastic heterogeneity in telomere-dependent senescence. PLoS Biol. 2007;5:e110. doi: 10.1371/journal.pbio.0050110. [DOI] [PMC free article] [PubMed] [Google Scholar]
- 32.Pendergrass W, Wolf N, Poot M. Efficacy of MitoTracker Green and CMXrosamine to measure changes in mitochondrial membrane potentials in living cells and tissues. Cytometry A. 2004;61:162–169. doi: 10.1002/cyto.a.20033. [DOI] [PubMed] [Google Scholar]
- 33.Andrades JA, Han B, Nimni ME, et al. A modified rhTGF-beta1 and rhBMP-2 are effective in initiating a chondro-osseous differentiation pathway in bone marrow cells cultured in vitro. Connect Tissue Res. 2003;44:188–197. doi: 10.1080/03008200390229912. [DOI] [PubMed] [Google Scholar]
- 34.Gonzalez MA, Gonzalez-Rey E, Rico L, et al. Adipose-derived mesenchymal stem cells alleviate experimental colitis by inhibiting inflammatory and autoimmune responses. Gastroenterology. 2009;136:978–989. doi: 10.1053/j.gastro.2008.11.041. [DOI] [PubMed] [Google Scholar]
- 35.Nemeth K, Leelahavanichkul A, Yuen PS, et al. Bone marrow stromal cells attenuate sepsis via prostaglandin E(2)-dependent reprogramming of host macrophages to increase their interleukin-10 production. Nat Med. 2009;15:42–49. doi: 10.1038/nm.1905. [DOI] [PMC free article] [PubMed] [Google Scholar]
- 36.Anderson P, Souza-Moreira L, Morell M, et al. Adipose-derived mesenchymal stromal cells induce immunomodulatory macrophages which protect from experimental colitis and sepsis. Gut. 2013;62:1131–1141. doi: 10.1136/gutjnl-2012-302152. [DOI] [PubMed] [Google Scholar]
- 37.Gonzalez-Rey E, Gonzalez MA, Varela N, et al. Human adipose-derived mesenchymal stem cells reduce inflammatory and T cell responses and induce regulatory T cells in vitro in rheumatoid arthritis. Ann Rheum Dis. 2010;69:241–248. doi: 10.1136/ard.2008.101881. [DOI] [PubMed] [Google Scholar]
- 38.Yanez R, Oviedo A, Aldea M, et al. Prostaglandin E2 plays a key role in the immunosuppressive properties of adipose and bone marrow tissue-derived mesenchymal stromal cells. Exp Cell Res. 2010;316:3109–3123. doi: 10.1016/j.yexcr.2010.08.008. [DOI] [PubMed] [Google Scholar]
- 39.Hu C, Yong X, Li C, et al. CXCL12/CXCR4 axis promotes mesenchymal stem cell mobilization to burn wounds and contributes to wound repair. J Surg Res. 2013;183:427–434. doi: 10.1016/j.jss.2013.01.019. [DOI] [PubMed] [Google Scholar]
- 40.Ji JF, He BP, Dheen ST, et al. Interactions of chemokines and chemokine receptors mediate the migration of mesenchymal stem cells to the impaired site in the brain after hypoglossal nerve injury. Stem Cells. 2004;22:415–427. doi: 10.1634/stemcells.22-3-415. [DOI] [PubMed] [Google Scholar]
- 41.Angel P, Szabowski A, Schorpp-Kistner M. Function and regulation of AP-1 subunits in skin physiology and pathology. Oncogene. 2001;20:2413–2423. doi: 10.1038/sj.onc.1204380. [DOI] [PubMed] [Google Scholar]
- 42.Karin M. The regulation of AP-1 activity by mitogen-activated protein kinases. J Biol Chem. 1995;270:16483–16486. doi: 10.1074/jbc.270.28.16483. [DOI] [PubMed] [Google Scholar]
- 43.Treisman R. Identification of a protein-binding site that mediates transcriptional response of the c-fos gene to serum factors. Cell. 1986;46:567–574. doi: 10.1016/0092-8674(86)90882-2. [DOI] [PubMed] [Google Scholar]
- 44.Brandlin I, Hubner S, Eiseler T, et al. Protein kinase C (PKC)eta-mediated PKC mu activation modulates ERK and JNK signal pathways. J Biol Chem. 2002;277:6490–6496. doi: 10.1074/jbc.M106083200. [DOI] [PubMed] [Google Scholar]
- 45.Sinnett-Smith J, Zhukova E, Hsieh N, et al. Protein kinase D potentiates DNA synthesis induced by Gq-coupled receptors by increasing the duration of ERK signaling in swiss 3T3 cells. J Biol Chem. 2004;279:16883–16893. doi: 10.1074/jbc.M313225200. [DOI] [PubMed] [Google Scholar]
- 46.Celil AB, Campbell PG. BMP-2 and insulin-like growth factor-I mediate Osterix (Osx) expression in human mesenchymal stem cells via the MAPK and protein kinase D signaling pathways. J Biol Chem. 2005;280:31353–31359. doi: 10.1074/jbc.M503845200. [DOI] [PubMed] [Google Scholar]
- 47.Young SH, Rozengurt N, Sinnett-Smith J, et al. Rapid protein kinase D1 signaling promotes migration of intestinal epithelial cells. Am J Physiol Gastrointest Liver Physiol. 2012;303:G356–366. doi: 10.1152/ajpgi.00025.2012. [DOI] [PMC free article] [PubMed] [Google Scholar]
- 48.Lynch J, Meehan MH, Crean J, et al. Metastasis Suppressor microRNA-335 Targets the Formin Family of Actin Nucleators. PLoS One. 2013;8:e78428. doi: 10.1371/journal.pone.0078428. [DOI] [PMC free article] [PubMed] [Google Scholar]
- 49.Parrinello S, Samper E, Krtolica A, et al. Oxygen sensitivity severely limits the replicative lifespan of murine fibroblasts. Nat Cell Biol. 2003;5:741–747. doi: 10.1038/ncb1024. [DOI] [PMC free article] [PubMed] [Google Scholar]
- 50.Lin X, Wu L, Zhang Z, et al. MiR-335-5p Promotes Chondrogenesis in Mouse Mesenchymal Stem Cells and is Regulated Through Two Positive Feedback Loops. J Bone Miner Res. doi: 10.1002/jbmr.2163. [DOI] [PubMed] [Google Scholar]
- 51.Kim SR, Park JH, Lee ME, et al. Selective COX-2 inhibitors modulate cellular senescence in human dermal fibroblasts in a catalytic activity-independent manner. Mech Ageing Dev. 2008;129:706–713. doi: 10.1016/j.mad.2008.09.003. [DOI] [PubMed] [Google Scholar]
- 52.Martien S, Pluquet O, Vercamer C, et al. Cellular senescence involves an intracrine prostaglandin E2 pathway in human fibroblasts. Biochim Biophys Acta. 2013;1831:1217–1227. doi: 10.1016/j.bbalip.2013.04.005. [DOI] [PubMed] [Google Scholar]
- 53.Badawi AF, Liu Y, Eldeen MB, et al. Age-associated changes in the expression pattern of cyclooxygenase-2 and related apoptotic markers in the cancer susceptible region of rat prostate. Carcinogenesis. 2004;25:1681–1688. doi: 10.1093/carcin/bgh176. [DOI] [PubMed] [Google Scholar]
- 54.Kim HJ, Kim KW, Yu BP, et al. The effect of age on cyclooxygenase-2 gene expression: NF-kappaB activation and IkappaBalpha degradation. Free Radic Biol Med. 2000;28:683–692. doi: 10.1016/s0891-5849(99)00274-9. [DOI] [PubMed] [Google Scholar]
- 55.Baek BS, Kim JW, Lee JH, et al. Age-related increase of brain cyclooxygenase activity and dietary modulation of oxidative status. J Gerontol A Biol Sci Med Sci. 2001;56:B426–431. doi: 10.1093/gerona/56.10.b426. [DOI] [PubMed] [Google Scholar]
- 56.Casolini P, Catalani A, Zuena AR, et al. Inhibition of COX-2 reduces the age-dependent increase of hippocampal inflammatory markers, corticosterone secretion, and behavioral impairments in the rat. J Neurosci Res. 2002;68:337–343. doi: 10.1002/jnr.10192. [DOI] [PubMed] [Google Scholar]
- 57.Chung HY, Kim HJ, Shim KH, et al. Dietary modulation of prostanoid synthesis in the aging process: role of cyclooxygenase-2. Mech Ageing Dev. 1999;111:97–106. doi: 10.1016/s0047-6374(99)00061-5. [DOI] [PubMed] [Google Scholar]
- 58.Watson AJ. Chemopreventive effects of NSAIDs against colorectal cancer: regulation of apoptosis and mitosis by COX-1 and COX-2. Histol Histopathol. 1998;13:591–597. doi: 10.14670/HH-13.591. [DOI] [PubMed] [Google Scholar]
- 59.Bai XY, Ma Y, Ding R, et al. miR-335 and miR-34a Promote renal senescence by suppressing mitochondrial antioxidative enzymes. J Am Soc Nephrol. 2011;22:1252–1261. doi: 10.1681/ASN.2010040367. [DOI] [PMC free article] [PubMed] [Google Scholar]
- 60.Campisi J, Andersen JK, Kapahi P, et al. Cellular senescence: a link between cancer and age-related degenerative disease? Semin Cancer Biol. 2011;21:354–359. doi: 10.1016/j.semcancer.2011.09.001. [DOI] [PMC free article] [PubMed] [Google Scholar]
- 61.Coppe JP, Rodier F, Patil CK, et al. Tumor suppressor and aging biomarker p16(INK4a) induces cellular senescence without the associated inflammatory secretory phenotype. J Biol Chem. 2011;286:36396–36403. doi: 10.1074/jbc.M111.257071. [DOI] [PMC free article] [PubMed] [Google Scholar]
- 62.Rodier F, Coppe JP, Patil CK, et al. Persistent DNA damage signalling triggers senescence-associated inflammatory cytokine secretion. Nat Cell Biol. 2009;11:973–979. doi: 10.1038/ncb1909. [DOI] [PMC free article] [PubMed] [Google Scholar]
- 63.Coppe JP, Patil CK, Rodier F, et al. A human-like senescence-associated secretory phenotype is conserved in mouse cells dependent on physiological oxygen. PLoS One. 2010;5:e9188. doi: 10.1371/journal.pone.0009188. [DOI] [PMC free article] [PubMed] [Google Scholar]
- 64.Shaulian E, Karin M. AP-1 as a regulator of cell life and death. Nat Cell Biol. 2002;4:E131–136. doi: 10.1038/ncb0502-e131. [DOI] [PubMed] [Google Scholar]
- 65.Anton K, Banerjee D, Glod J. Macrophage-associated mesenchymal stem cells assume an activated, migratory, pro-inflammatory phenotype with increased IL-6 and CXCL10 secretion. PLoS One. 2012;7:e35036. doi: 10.1371/journal.pone.0035036. [DOI] [PMC free article] [PubMed] [Google Scholar]
- 66.Kim SY, Kang HT, Choi HR, et al. Reduction of Nup107 attenuates the growth factor signaling in the senescent cells. Biochem Biophys Res Commun. 2010;401:131–136. doi: 10.1016/j.bbrc.2010.09.025. [DOI] [PubMed] [Google Scholar]
- 67.Franco CA, Blanc J, Parlakian A, et al. SRF selectively controls tip cell invasive behavior in angiogenesis. Development. 2013;140:2321–2333. doi: 10.1242/dev.091074. [DOI] [PubMed] [Google Scholar]
- 68.Lahoute C, Sotiropoulos A, Favier M, et al. Premature aging in skeletal muscle lacking serum response factor. PLoS One. 2008;3:e3910. doi: 10.1371/journal.pone.0003910. [DOI] [PMC free article] [PubMed] [Google Scholar]
- 69.Jeon ES, Moon HJ, Lee MJ, et al. Sphingosylphosphorylcholine induces differentiation of human mesenchymal stem cells into smooth-muscle-like cells through a TGF-beta-dependent mechanism. J Cell Sci. 2006;119:4994–5005. doi: 10.1242/jcs.03281. [DOI] [PubMed] [Google Scholar]
- 70.Steinberg SF. Regulation of protein kinase D1 activity. Mol Pharmacol. 2012;81:284–291. doi: 10.1124/mol.111.075986. [DOI] [PMC free article] [PubMed] [Google Scholar]
- 71.Eisenberg-Lerner A, Kimchi A. PKD is a kinase of Vps34 that mediates ROS-induced autophagy downstream of DAPk. Cell Death Differ. 2012;19:788–797. doi: 10.1038/cdd.2011.149. [DOI] [PMC free article] [PubMed] [Google Scholar]
- 72.Jackson MJ, McArdle A. Age-related changes in skeletal muscle reactive oxygen species generation and adaptive responses to reactive oxygen species. J Physiol. 2011;589:2139–2145. doi: 10.1113/jphysiol.2011.206623. [DOI] [PMC free article] [PubMed] [Google Scholar]
- 73.Das M, Jiang F, Sluss HK, et al. Suppression of p53-dependent senescence by the JNK signal transduction pathway. Proc Natl Acad Sci U S A. 2007;104:15759–15764. doi: 10.1073/pnas.0707782104. [DOI] [PMC free article] [PubMed] [Google Scholar]
- 74.Hunt GE, Van Nieuwenhuijzen PS, ChanLing T, et al. ‘When an old rat smells a cat’: A decline in defense-related, but not accessory olfactory, Fos expression in aged rats. Neurobiol Aging. 2011;32:737–749. doi: 10.1016/j.neurobiolaging.2009.03.014. [DOI] [PubMed] [Google Scholar]
- 75.Pandey AC, Semon JA, Kaushal D, et al. MicroRNA profiling reveals age-dependent differential expression of nuclear factor kappaB and mitogen-activated protein kinase in adipose and bone marrow-derived human mesenchymal stem cells. Stem Cell Res Ther. 2011;2:49. doi: 10.1186/scrt90. [DOI] [PMC free article] [PubMed] [Google Scholar]
Associated Data
This section collects any data citations, data availability statements, or supplementary materials included in this article.