Abstract
Objective:
A new dosimetric variable, dose-dropping speed (DDS), was proposed and used to evaluate normal tissue sparing among stereotactic radiosurgery (SRS) plans with different prescription isodose lines.
Methods:
40 plans were generated for 8 intracranial SRS cases, prescribing to isodose levels (IDLs) ranging from 50% to 90% in 10% increments. Whilst maintaining similar coverage and conformity, plans at different IDLs were evaluated in terms of normal tissue sparing using the proposed DDS. The DDS was defined as the greater decay coefficient in a double exponential decay fit of the dose drop-off outside the planning target volume (PTV), which models the steep portion of the drop-off. Provided that the prescription dose covers the whole PTV, a greater DDS indicates better normal tissue sparing.
Results:
Among all plans, the DDS was found to be the lowest for the prescription at 90% IDL and the highest for the prescription at 60% or 70%. The beam profile slope change in the penumbra and its field size dependence were explored and given as the physical basis of the findings.
Conclusion:
A variable was proposed for SRS plan quality evaluation. Using this measure, prescriptions at 60% and 70% IDLs were found to provide best normal tissue sparing.
Advances in knowledge:
A new variable was proposed based on which normal tissue sparing was quantitatively evaluated, comparing different prescription IDLs in SRS.
Stereotactic radiosurgery (SRS) has gained increasing popularity as a treatment modality for patients with brain metastases as well as other malignant and benign brain lesions.1 SRS has traditionally been performed by using an invasive fixed head frame that establishes the stereotactic co-ordinates of the target.2 More recently, frameless stereotactic systems have been developed and implemented with the help of an image-guided system.3–11
The reports of radiation therapy oncology12–15 have made specific prescription dose recommendations for brain SRS treatments based on different target volumes. But, the prescription isodose level (IDL) can vary from 50% to 90% among different clinical practices. Therefore, it is interesting to find out which prescription IDL would be most suitable for brain SRS. In fact, a recent study has been conducted in this aspect.16 In the study by Ohtakara et al,16 10 SRS cases have been retrospectively planned and studied comparing different IDLs (90%, 80% and 70%), and the authors found the best prescription IDL at 70% for those 10 cases, based on volume that receives at least 50% of the prescription dose (V50%). The technique used in their study was non-coplanar dynamic conformal arcs, standard in brain SRS treatments. However, in the study, no physical reason was explored to explain the findings, and the studied prescription IDLs ranged from 70% to 90%, rendering it inadequate to determine if 70% was truly the extrema. Whilst we explored a similar topic in this article, we used a broader search range of 50–90%, the range of clinically used prescription IDLs, to comprehensively study the normal tissue dose effect of prescription IDLs. Furthermore, we proposed in this work a new and useful variable, dose-dropping speed (DDS) that reflects the radial dose drop-off from the planning target volume (PTV) surface, defined as the greater decay coefficient in a double exponential decay fit of the dose drop-off outside the PTV, to quantitatively evaluate the normal tissue sparing. The double exponential decay fit takes a global look at the dose drop-off outside the PTV, with the greater decay coefficient characterizing the steep portion of the drop-off or the higher dose gradient region, and the lesser decay coefficient characterizing the shallow portion or the lower dose gradient region. Our work chose to define the greater decay coefficient, owing to its greater clinical relevance, as a quantitative measure called DDS and to use it in our investigation of normal tissue dose effect of prescription IDLs. In addition to discovering the effects of prescription IDLs on the plan quality, our work also explored the physical aspects in an attempt to explain the observations. The normal tissue sparing trend of different prescription IDLs was found to result from the different gradients of the penumbra on the linear accelerator (LINAC) beam profile of the corresponding effective field size. Effectively speaking, a different part of the beam penumbra of a different beam field size is used to surround the PTV on the plan of a given prescription IDL. Moreover, our work also uncovered a target size dependence of the observed normal tissue dose trend and explored its physical basis. Finally, the planning technique also had some differences from the work of Ohtakara et al.16 In their study, block margin was only uniformly adjusted for plans with different prescription IDLs, whilst in our study, we manually optimized individual multileaf collimator (MLC) leaf positions for each plan to generate realistic plans with quality satisfactory to our clinical standards. As a result, in our work, the plans with different IDLs for the same patient all had high and matched coverage and conformity, therefore rendering our results and conclusions more generalizable to clinical SRS practice.
It is difficult to simply define what a good plan entails. But in general, a good plan shall have both good local control and good normal tissue sparing to the best extent possible, and this is especially true for SRS cases in which an ablative dose is given in a single fraction. In other words, hot spots in the PTV may be tolerated but the normal tissue shall be as cold as possible. As will be shown in this article, the prescription IDLs were revealed to affect normal tissue sparing in a SRS plan. Normal tissue sparing is usually quantitatively or qualitatively evaluated in a variety of ways. One way is to assess specific dose–volume end points for different organs at risk (OARs), such as the maximum dose to the brainstem, or the volume of normal brain tissue receiving >12 Gy. These end points are useful because they are often linked with specific toxicities found and therefore represent what the clinicians are most interested in, to constrain the dose and minimize the toxicities. On the other hand, each of these measures only represents a local and partial view of the entire plan. As a result, those variables cannot be used to represent the general dose change trends inside the normal tissue. Another popular way to evaluate normal tissue dose is to use V50%, as has been done in the study of Ohtakara et al.16 However, V50% has the same shortcoming as the dose–volume histogram (DVH) that it does not reflect the “co-ordinate information”. In other words, for the same V50%, the dose can be distributed in many different positions. Furthermore, V50% studies only the dose effect at a localized dose level, that is, 50%. Finally, the selection of V50% not V55% or V40% is arbitrary. Thus, there is a natural question whether we could find a generic function that can be used to describe the dose distribution outside the PTV. In this work, we have proposed a double exponential function for this purpose. In this work, we proposed a new parameter named DDS, extracted from a global fitting of the dose drop-off outside the PTV, to quantitatively and comprehensively evaluate normal tissue sparing and to study the effects of different prescription IDLs in brain SRS.
Our dose drop-off calculation involves some position information of the dose distribution, which is ignored in the above-enumerated measures, and thus provides us with information that can be used to evaluate the general dose trends outside the PTV. The DDS, as we defined using the greater decay coefficient in a double exponential decay fit of the dose drop-off outside the PTV, is of course an interesting measure that has not been explored in the existing literature.
The goals of SRS are the ablation of target tissue and the sparing of critical normal tissue. Largely owing to the little normal tissue usually contained in a SRS PTV, dose inhomogeneity inside the PTV is considered acceptable. Conventionally, the “sphere-packing” type of SRS, such as Gamma Knife® (Elekta AB, Stockholm, Sweden), prescribes to a fairly low IDL, usually around 50%, whilst such low prescription IDL would not be used for radiotherapy with conventional fractionations in which target uniformity is critical. High prescription IDLs such as 90% are achievable in LINAC-based SRS, although a broad range of IDLs from 50% to 90% has been used in clinical practice owing to the relative freedom from the target uniformity restriction and the importance of normal tissue sparing outside the PTV. Whilst our work was conducted based on our proposed DDS to study the normal tissue dose effect and to identify the prescription IDL that would provide the optimal normal tissue sparing outside the PTV, there are a few other items that need to be taken into consideration. Most important of all, the tolerance of target dose heterogeneity is still clinically important even for SRS. Although usually within the target itself, the hottest dose point in a low prescription IDL plan can have a much higher dose than that in a high prescription IDL plan. For example, for a plan with 18 Gy prescribed to 90% IDL, the hottest dose is around 20 Gy, whilst another plan with the same dose prescribed to 50% IDL will have the hottest dose at around 36 Gy. Because single fraction SRS treatment was found to sometimes cause necrosis,17–20 very high dose points shall still be avoided and therefore plans with very low prescription IDLs may not be clinically practical or appropriate. In addition, because plans with lower prescription IDLs deliver higher maximum doses and require larger numbers of monitor units, they may in turn result in larger integral doses and may cause logistic problems such as longer irradiation time. Last but not the least, a plan with a lower prescription IDL has a smaller effective field size than does a plan with a higher IDL. Because the typical smallest MLC field size commissioned for LINAC-based SRS is about 1 cm, the smaller effective field size in low IDL plans for a very small target may lead to bigger dosimetric errors than does a larger field size in high IDL plans would.
Here, we report our work in which we used the DDS calculated from a double exponential decay function fit of dose drop-off outside the PTV to investigate normal tissue sparing on brain SRS plans with 50–90% prescription IDLs. A total of 40 plans were retrospectively generated for 8 brain SRS patients who had been clinically treated with 90% IDL plans. The physical basis of the observed phenomena will also be discussed.
METHODS AND MATERIALS
Under a study approved by the institutional review board of University of Nebraska, Medical Center (NE, USA), eight previously treated brain SRS patients were randomly selected, including one with acoustic neuroma, one with meningioma, two with pituitary lesions and four with metastatic tumours. Table 1 lists the disease sites, locations and PTVs for all the patients. These patients were clinically treated prescribed to 90% IDL following the practice guideline at our institution. In our work, a single physicist first replanned the eight cases at 90% IDL with non-coplanar 6 MV dynamic conformal arcs using iPlan (Brainlab AG, Feldkirchen, Germany) for a Novalis machine (Brainlab AG). Subsequently, whilst fixing the arc number and orientation for each patient, the physicist manually optimized the individual micro-MLC leaf positions to create plans with the other prescription IDLs (80%, 70%, 60% and 50%). The plans were created such that the PTV coverage and conformity were similar for the same patient on the different plans. The typical number of arcs was around five.
Table 1.
Patient characteristics of all eight patients
| Patient index | Disease | Location | Planning target volume (cm3) |
|---|---|---|---|
| 1 | Pituitary | Pituitary | 16.48 |
| 2 | Metastasis | Right cerebellar | 12.23 |
| 3 | Meningioma | Anterior left parafalcine | 4.37 |
| 4 | Pituitary | Pituitary | 3.64 |
| 5 | Metastasis | Right side of the pons (brainstem) | 1.68 |
| 6 | Metastasis | Right frontal lobe | 1.05 |
| 7 | Acoustic neuroma | Left internal auditory canal | 0.56 |
| 8 | Metastasis | Right parietal lobe | 0.37 |
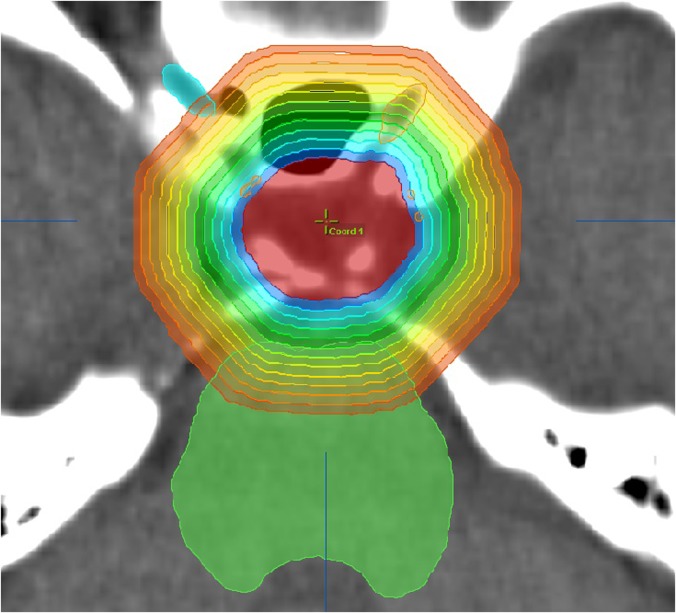
To quantitatively evaluate the dosimetric effect on the normal tissue for individual plans, we proposed to use a new metric, the DDS, defined as the following. Firstly, 1-mm-thick concentric rind structures were generated layer by layer from immediately outside the PTV to when the rind structures reach the head surface (see an example patient image in Figure 1). Secondly, the average dose inside each rind structure was calculated. Thirdly, an analytical double exponential decay function was fitted to describe the average dose as a function of the distance from the PTV surface, as in Equation (1):
| (1) |
where D(r) (Gy) denotes the average dose in a rind structure with the distance of r (millimetres) from the PTV surface. The two terms are symmetrical in Equation (1). The steeper decay is always denoted as the first exponential term , and the shallower decay as the second exponential term . Lastly, we defined b1, the greater decay coefficient from the steeper decay of the fit, as our proposed variable DDS. When , which corresponds to the surface immediately outside the PTV, the second term of Equation (1) approaches a constant value. Therefore, the first exponential dominates the dose drop-off in the areas outside but close to the PTV, that is, the medium-to-high dose region outside the PTV. On the other hand, at a point farther away from the PTV surface, the contribution of the first term becomes less prominent. For example, at a point with the distance of from the PTV surface, the contribution of the first term is . At a point with the distance of , the contribution of the first term becomes . It is obvious that at , the two terms in Equation (1) are equal. At a point closer than r0, the first term dominates the contribution; on the other hand, at a point farther away than r0, the second term dominates. We defined b1 to be our proposed variable DDS because the dose drop-off in the normal tissue immediately outside and close to the PTV is always of the most clinical importance in brain SRS.
Figure 1.
The zoomed in axial view of one example patient (Patient 4) showing multiple concentric 1-mm-thick rind structures generated from the planning target volume surface. Although only a few rind structures are shown in the figure to avoid crowdedness, rind structures were generated layer by layer until they reached the closest head surface for each plan. The average dose in each rind was calculated to study the normal tissue dose.
Suppose a plan is made perfectly such that the prescription IDL completely covers and perfectly conforms to the surface of the PTV, a larger DDS is then preferable because it means faster dose drop-off immediately outside and close to the PTV. The OARs close to the PTV will receive a lower dose. On the other hand, a smaller DDS indicates slower dose drop-off leading to a higher dose to the OARs close to the PTV.
For the 40 plans that we generated for the 8 SRS patients (5 plans with prescription IDLs set at 50–90% for each patient), we calculated the dose distribution outside the PTV and applied the above-described fitting to the distribution for each plan to investigate the normal tissue dose effect of different prescription IDLs. To explore the physical basis behind the studied effect and its trend, the MLC-collimated square field beam profiles measured at the commissioning and modelled by the treatment planning system were inspected in connection with the clinical plans.
To explore the target size dependence, we conducted a simulated phantom study in which a hypothetical spherical target was used for brain SRS. In the study, we fixed the prescription IDL at 80% and changed the spherical target diameter from 4.90, 4.05, 3.20, 2.30 to 1.2 cm. A plan was generated for each target size, from which the DDS for each target size was calculated.
RESULTS
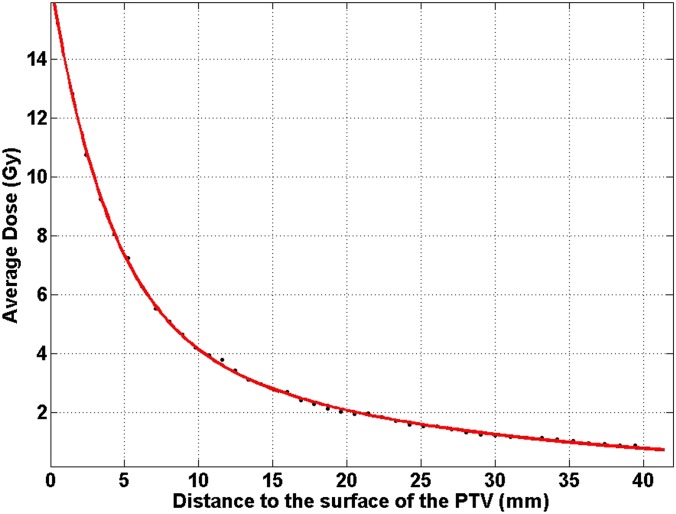
In Figure 2, one example of the dose as a function of the distance from the PTV surface is shown (Patient 4 in Table 1). In this figure, the prescription IDL is 80%. Using Equation (1) to fit it, the fitted coefficients were:
Figure 2.
One example patient plan (Patient 4 at 80% prescription isodose level) showing the average dose in each rind structure as a function of the distance from the surface of the planning target volume (PTV). The fitted values of Equation (1) were a1 = 18.43 (Gy), a2 = 4.218 (Gy), b1 = 0.2477 (mm−1) and b2 = 0.04334 (mm−1).
For this plan, the halfway dose decay distance for the DDS was . The halfway dose decay distance for the second exponential term was . At r0 = 7.2 mm, the contributions from the two terms were equal.
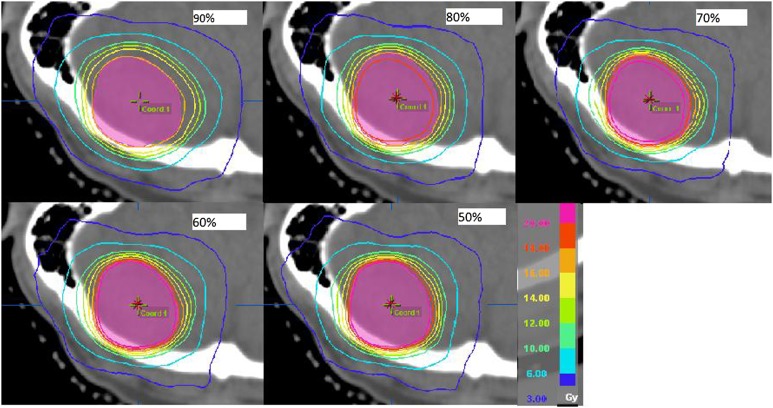
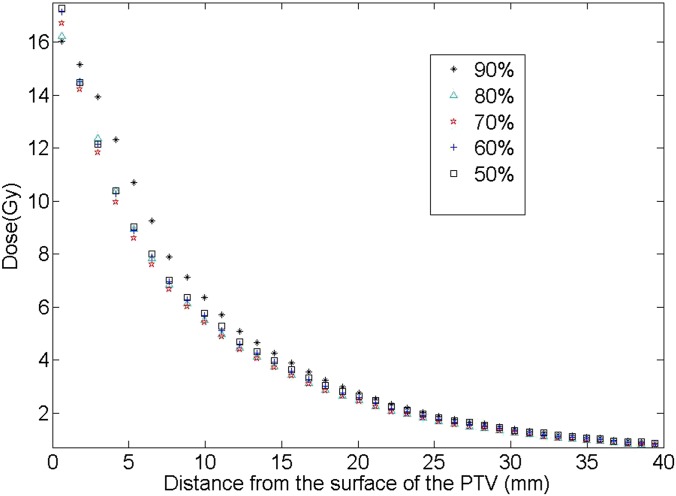
Comparing the five different prescription IDL plans for each patient, similar trends were found for all eight patients. The isodose distributions outside the PTV for one example patient are given in Figure 3 for cases of prescription IDLs from 90% to 50% (Patient 2 in Table 1). From the figure, the following two observations were made: (1) it appeared that for the plans with all other prescription IDLs, the high dose distribution more tightly hugs the PTV than the 90% plan and (2) for the lower prescription IDL cases (i.e. 50%), the lower dose was more spread out. The average dose in each rind structure, as a function of the distance from the PTV surface, is plotted for each plan in Figure 4 for this example patient (Patient 2). It was clear that for the 90% prescription IDL plan, the dose drop-off in the medium-to-high dose region was the slowest. On the other hand, the tissue dose at the largest studied distance from the PTV was the highest for the 50% prescription IDL plan. These findings were in accordance with the observations from Figure 3.
Figure 3.
Dose distribution outside the planning target volume (PTV) for an example patient (Patient 2) for plans with the prescription isodose level at 90%, 80%, 70%, 60% and 50%. The plotted isodose lines are 20, 18, 16, 14, 12, 10, 6 and 3 Gy from inside to outside of the PTV.
Figure 4.
The dose distribution outside the planning target volume (PTV), calculated from the average doses in the rind structures, as a function of the distance from the PTV surface for the five plans is shown in Figure 3 (Patient 2).
To quantify the observations from Figure 4, Equation (1) was used to fit the dose distribution, and the results are provided in Table 2. The conformity index, defined as the ratio of the prescription dose-covered volume to the PTV, is also given in Table 2 for all plans. It was clear that a similar conformity was achieved across different prescription plans for the patient. Because the first rind in the data extraction was so close to the PTV (1 mm from the surface of the PTV) that its average dose was more often affected by the minute differences in plan conformity, we chose to exclude this point from the fitting, which led to the fitted coefficients shown in Rows 2–5. The total monitor units (MUs) for all plans are also provided in Table 2. It is interesting to note that the DDS was found to be optimal (the highest) in the 70% plan. For other patients not shown, the DDS was found to be optimal either in the 70% or the 60% plan. The exact optimal percentage IDL may depend on the PTV, location and other factors, although all eight patients showed a plateaued DDS peak at around 60–70%. The other observation is that for a lower IDL, the MU number is also increased and this is understandable. For a lower IDL, the maximum dose inside the PTV increases, thus the corresponding MU also increases. The numbers of MU of the plans with different IDLs are almost inversely proportional to the IDLs. For example, the MU ratio for the plans at 50% and 90% IDL is 1.838, which is almost the same as the inverse ratio of the two IDLs that is 1.8. We need to point out that in addition to the higher dose heterogeneity inside the PTV, the higher MU at the lower IDL may also lead to the slightly broader low dose region, although our DDS study concentrates on the more clinically relevant region of medium-to-high dose.
Table 2.
The plan conformity indexes, all fitting parameters from Equation (1), and the total number of monitor units (MUs) for the stereotactic radiosurgery plans with 90–50% prescription isodose levels (IDLs) for an example patient (Patient 2)
| IDL | 90% | 80% | 70% | 60% | 50% |
|---|---|---|---|---|---|
| CI | 1.230 | 1.230 | 1.230 | 1.221 | 1.230 |
| a1 | 15.720 | 11.000 | 10.181 | 9.940 | 9.760 |
| b1 | 0.136 | 0.239 | 0.280 | 0.276 | 0.260 |
| a2 | 3.506 | 8.248 | 9.032 | 9.437 | 9.315 |
| b2 | 0.0371 | 0.0620 | 0.0651 | 0.0648 | 0.0634 |
| Total MU | 2465 | 2792 | 3200 | 3755 | 4531 |
CI, conformity index.
For this patient, the plan with 70% IDL achieved both the greatest dose-dropping speed (b1), and the greatest b2, the smaller exponential decay coefficient in equation (1) characterizing the dose drop-off in the low dose region.
The DDS values of different prescription IDL plans of all eight patients are presented in Figure 5. From the plot, it is clear that the DDS was always the lowest in the 90% IDL plan, and it increased with lower IDL plans until it plateaued at about 60–70% prescription IDLs. The ratios of the highest DDSs to that in the 90% cases were between 1.18 and 2.10. The mean ratio was 1.65 ± 0.33 (one standard deviation). An analysis of variance indicated that the DDS difference was significant between the optimal plans (60% or 70%) and the 90% plans with p < 0.01.
Figure 5.
A plot of the dose-dropping speed (DDS) vs the corresponding prescription isodose level for all patients, obtained from all 40 plans.
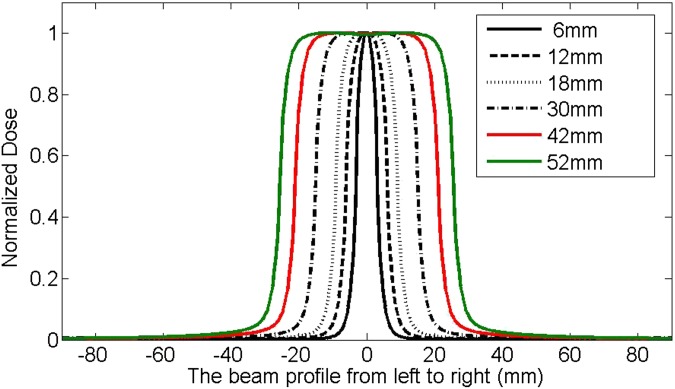
In exploring the beam profiles, the observed DDS trend in the clinical cases was found to correlate with the beam profiles in the following ways. The beam aperture size or MLC block margin is different when we prescribe at the 90% IDL vs the 70% IDL. In general, the lower the prescription IDL, the smaller the beam aperture sizes are for the same case. To understand the observations of the effects of prescription IDL on the DDS, our investigation on the beam profiles for different field sizes are presented here.
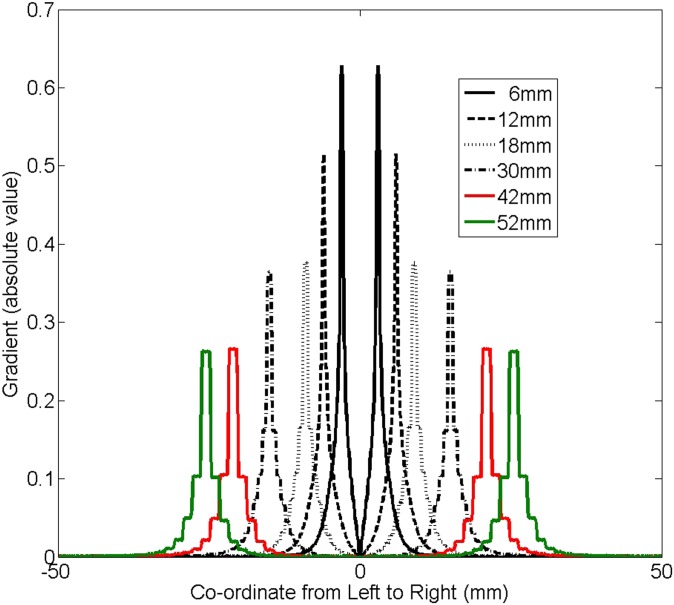
Figure 6 plots the beam profiles for different MLC-defined square field sizes with varying sizes from 6 × 6 to 52 × 52 mm. It is apparent that the beam profile became narrower and dropped faster around the penumbra region when the field size was smaller. To more clearly appreciate this, the absolute value of the gradient, calculated using the first-order derivative of the profiles, as a function of the distance from the central axis (CAX) is plotted in Figure 7. It is interesting to note that the gradient was larger as the field size got smaller.
Figure 6.
The beam profiles for multileaf collimator-defined square fields with various sizes, generated from iPlan (Brainlab AG, Feldkirchen, Germany) based on beam models for a source axis distance (=100 cm) set-up at 5-cm depth. The plotted field sizes are 6 × 6, 12 × 12, 18 × 18, 30 × 30, 42 × 42 and 52 × 52 mm.
Figure 7.
The absolute gradients for the beam profiles shown in Figure 5, calculated using the first-order derivatives. The corresponding multileaf collimator-defined square field sizes are 6 × 6, 12 × 12, 18 × 18, 30 × 30, 42 × 42 and 52 × 52 mm.
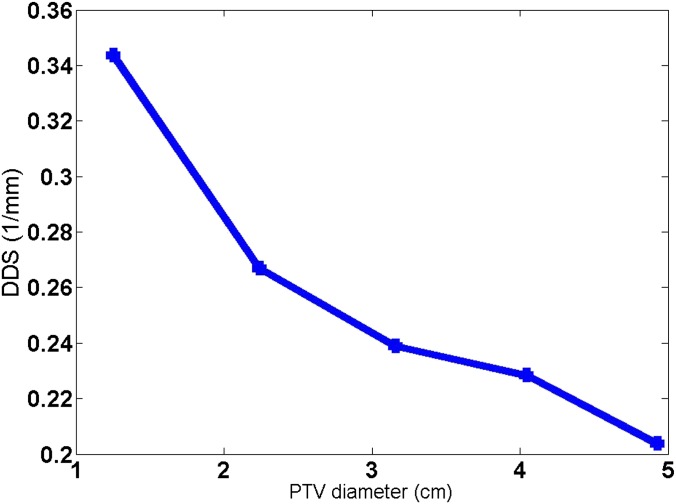
A target size dependence was found for the DDS from the simulated phantom study. The DDS of the 80% IDL plan was compared for a simulated spherical target of varying diameters. In Figure 8, the DDS as a function of the target diameter is plotted. It is clear that when the target became smaller, the DDS became larger.
Figure 8.
The dose-dropping speed (DDS) trend with the planning target volume (PTV) diameter, obtained from the phantom study on a simulated spherical target. The spherical target in each simulated case had a diameter of 4.90, 4.05, 3.20, 2.30 and 1.20 cm, respectively. The centroid location of the varying sized targets was kept the same, and the prescription isodose level was fixed at 80%.
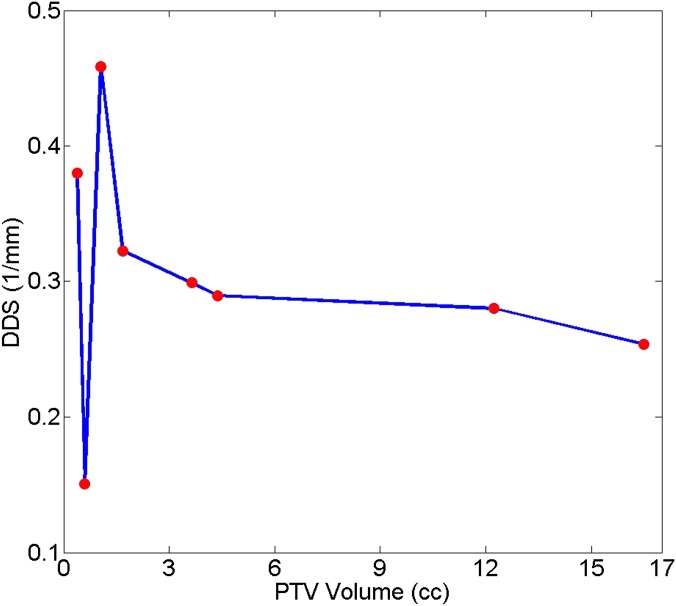
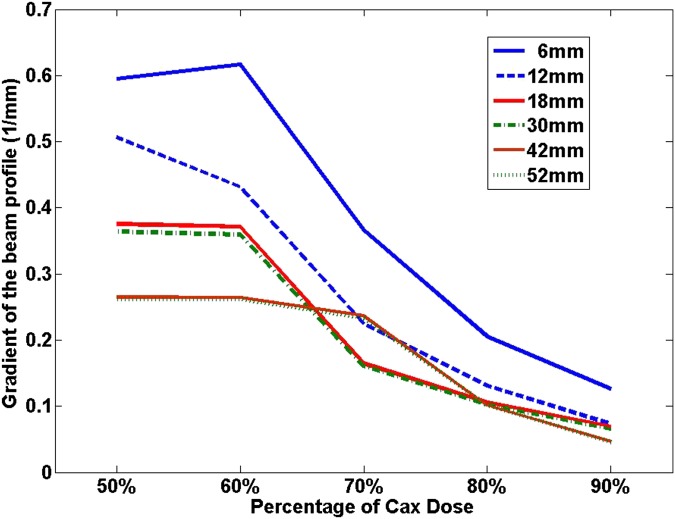
A similar trend with varying target sizes was also seen for all but two patient cases. Figure 9 plots the optimal (maximum) DDS from all five plans with different prescription IDLs for each patient as a function of the corresponding PTV. Except Patients 7 and 8 who had PTVs <1 cm3, for the larger PTVs, the DDS decreased as the PTV increased. This trend as seen in the six patients with larger PTVs and in the simulated target study could be owing to the similar volume (field size) dependence of the calculated slope of the beam profiles (using the first-order derivatives) as a function of percentage dose of the CAX values as plotted in Figure 10. For the two small PTVs that did not follow the trend, one was very close to the surface of the head (Patient 8) and the other was an acoustic neuroma sitting inside bony structures (Patient 7). For the acoustic neuroma case, the target location was quite different from the others. Therefore, the DDS might have also depended on the target location and its distinct surrounding structures. For Patient 8 for whom the target was close to the surface of the head, in addition to the beam profile effects described above, the effects of the beam depth dose contribution should also be considered.
Figure 9.
The maximum dose-dropping speed (DDS) as a function of the planning target volume (PTV) for all eight patients. For each patient, the maximum DDS value was chosen, regardless of the prescription isodose level that the value was achieved with.
Figure 10.
The gradients of the beam profile calculated as the first-order derivatives at 50%, 60%, 70%, 80% and 90% of the central axis (Cox) dose values, for multileaf collimator-defined square fields with varying field sizes ranging from 6 × 6 to 52 × 52 mm. The source axis distance and depth of measurement were the same as those in Figures 6 and 7.
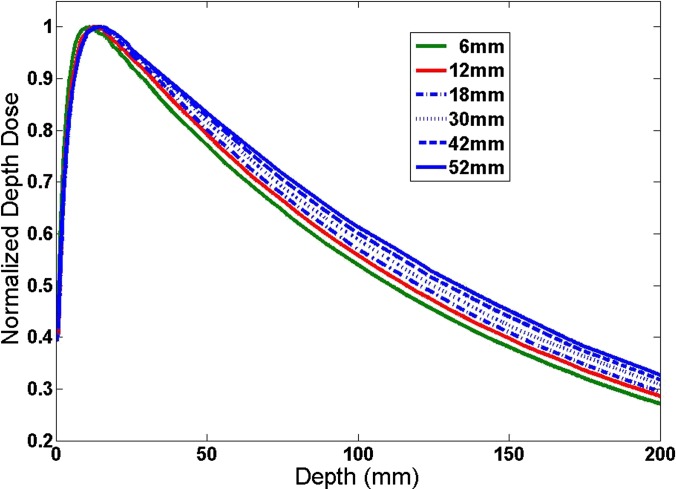
The beam depth dose curves for different field sizes are given in Figure 11. From this figure, one can also observe the field size dependence of the dose drop-off. The dose drop-off was faster when the field size was smaller. For example, we could use:
| (2) |
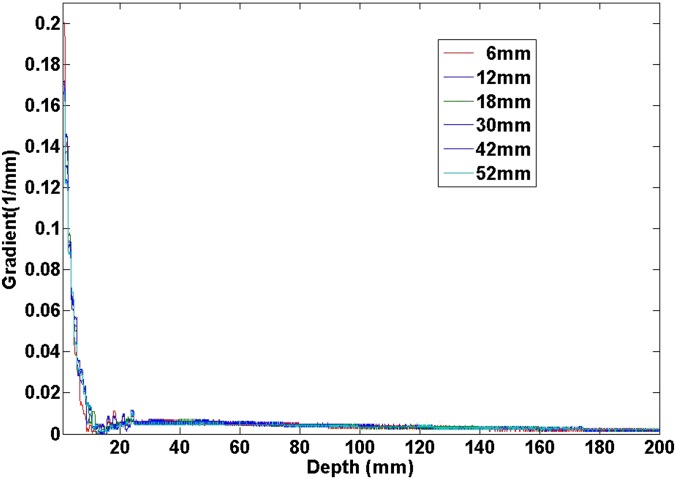
to fit the percent depth dose (PDD) curve for the depth larger than the dmax, where x is the depth. It is interesting to observe that µ = 0.006702 (mm−1) at the field size of 6 × 6 mm and µ = 0.005935 (mm−1) at the field size of 52 × 52 mm. It was clear that the ratio was around 1.13. But the absolute values were about two orders of magnitude smaller than the DDS shown in Figure 8. The absolute value of the gradient (i.e. the first-order derivative) as a function of the depth is given in Figure 12 for different field sizes. It was clear that the gradient of PDD was almost zero at depths >1.5 cm for all field sizes. Thus, the effect was negligible with a target deeper in the head. For targets close to the surface of the head, this will affect the dose distribution, such as in the case of Patient 7. Therefore, the general trend shall still hold; the DDS is larger for smaller targets or lower prescription IDLs, when the target is at an effective depth from the head surface much larger than the dmax of the beam.
Figure 11.
Percent depth dose as a function of depth for different square field sizes. The field sizes as well as the 95 cm source surface distance were the same as those in Figures 6, 7 and 10.
Figure 12.
The absolute value of the percent depth dose (PDD) gradient (the first-order derivative) as a function of depth for varying square field sizes. The gradients were calculated from the corresponding PDD curves shown in Figure 11.
DISCUSSION
In our work, a new variable DDS was proposed to evaluate the dose drop-off in the medium-to-high dose region outside the PTV in brain SRS. The DDS was extracted from a double exponential decay fit of the relationship between the average dose in concentric shells outside the PTV and their distances from the PTV surface. Because in the double exponential decay fit the second term is much smaller than the first one by definition, one could also use the following function:
| (3) |
to fit the dose distribution outside the PTV. In fact, as shown in Table 2, for the double exponential decay fit, b2 was usually much smaller than our defined DDS b1. In the single exponential function discussed here, a newly defined DDS alternative, b3, shall exhibit similar dependence on prescription IDL as b1 in the double exponential decay fit. It should be noted that the absolute value of the DDS depends on the plan quality. But the discovered trend that the DDS increases as the prescription IDL decreases from 90% to the lower prescription IDLs seems to be independent of the specific plans as long as the plan qualities are consistent with each other for plans with different prescription IDLs. One small precaution that we have exercised in the work to decrease the effects of small plan quality fluctuations was excluding the first data point immediately outside the PTV from the fitting, which was proven effective. Additionally, the DDS may also depend on the target location and its surrounding structures, effects that were touched on but were not studied extensively in this article. These effects are not expected to change the discovered DDS vs prescription IDL relationship demonstrated in Figure 5. The reason is that the relationship is closely related to the gradients of beam profiles of different field sizes as plotted in Figure 10.
In understanding the normal tissue dose using DDS, a few considerations need to be noted. First to point out is that the average dose in the shells (or rinds) was used in our analysis. Therefore, it ignored the anisotropic dependence in the relationship. However, in contrast to the DVH, which completely ignores the spatial information, this simple analysis still retains the spatial information along the radial direction and can provide overall information about the dose distribution outside the PTV. But one should keep in mind that for two different plans, even when the average dose within a rind for a plan is higher than that for another plan, point doses inside the rind can behave differently for those two plans. Secondly, although our results showed that prescription IDLs <90% led to faster dose drop-off in the normal tissue near the target and hence to better OAR sparing, there is one possible exception. When the PTV overlaps with an OAR, changing prescription IDL from a higher IDL to a lower one could increase the maximum dose to the OAR. This is because with a lower prescription IDL, the dose heterogeneity inside the PTV increases and therefore the portion of the OAR that is inside the PTV may likely get a higher dose. Thus, one needs to be careful to change the prescription IDL when the PTV overlaps with an OAR, and the maximum dose of the OAR is a constraint. For example, for Patient 5 in our study, part of the brainstem is within the PTV. It was found that although the mean dose in the brainstem was the largest for the 90% IDL plan, following the trend discovered by our DDS study, the maximum dose on the other hand was the lowest compared with that in all other plans prescribed to lower IDLs.
The plans with 60–70% prescription IDLs achieved the highest (optimal) DDS for all patients. Whilst this result indicates an advantageous normal tissue sparing in the medium-to-high dose region outside the PTV at such prescription IDLs, a few other considerations also need to be noted. Firstly and most importantly, it is well known that the probability of necrosis is higher with a higher dose. As has been studied by Blonigen et al,18 when V10Gy >10.5 cm3 or V12Gy >7.9 cm3 for normal brain tissue, hypofractionated rather than single fraction treatment should be considered to minimize the risk of brain radionecrosis. Despite the small amount of normal brain tissue contained in the SRS PTV, the higher probability of radionecrosis needs to be considered when choosing lower prescription IDLs, as the hot spots within the PTV would be considerably hotter than when a high prescription IDL is chosen instead. This potential trade-off should always be kept in mind when determining an appropriate prescription IDL. Secondly, as can be seen from the more spread-out lower isodose lines for the 50% IDL plan in Figure 3, because a plan with a lower prescription IDL requires higher MUs than a higher IDL plan, the integral dose may be higher, which may lead to a broader low dose spillage owing to MLC and machine leakage, in addition to the higher absolute dose and higher dose heterogeneity inside the target. Although as we chose to focus on in the current study, the high dose region is much more critical than the low dose region in SRS cases. Lastly, the intention of this work is not to propose a practice pattern change to favour lower prescription IDLs in brain SRS based on our findings. Rather, the goal is to demonstrate the normal tissue dose effect of varying prescription IDLs and to explore its physical reasons. This way, a physician could weigh all possible advantages and disadvantages to make an educated decision when choosing what IDL to prescribe for a specific case.
Our analysis shows general trends of dose distribution outside the PTV, as the dose drops radially. Equation (1) is a fitting function that describes the dose distribution outside the PTV for the whole imaged anatomy. This radial co-ordinate dependence is usually ignored in previous measures. Therefore, the DDS can be used as a complementary measure to the previous measures. Previous measures such as maximum dose and V50% are measures of special cases such as at a particular dose level, therefore, could not provide the global behaviour as provided in Equation (1). Of course, these measures can always be used in conjunction with our new measure to confirm the findings. For the 40 plans in our study, we also calculated V50% and compared among different prescription IDLs. The results are listed in Table 3. It is clear that the same conclusion was reached based on V50%, as based on our proposed DDS, that the optimal sparing as indicated by the lowest V50% was achieved by 70% or 60% IDL plans. Yet we need to point out again, even though the same conclusion could be drawn from both measures in this study, whilst this selection of the dose level in V50% is arbitrary and local, Equation (1) is a global fitting and the DDS extracted from it therefore provides a quantitative measure of a much broader dose range.
Table 3.
The volume that receives at least 50% of the prescription dose (V50%) (cm3) calculated from the different isodose level (IDL) plans for all patients
| IDL | 90% | 80% | 70% | 60% | 50% |
|---|---|---|---|---|---|
| Patient 1 | 25.088 | 24.896 | 24.448 | 25.536 | 33.856 |
| Patient 2 | 26.752 | 20.160 | 19.392 | 20.480 | 22.400 |
| Patient 3 | 16.640 | 13.248 | 10.880 | 10.240 | 11.392 |
| Patient 4 | 13.952 | 8.256 | 7.360 | 7.232 | 7.238 |
| Patient 5 | 5.888 | 4.244 | 3.392 | 4.480 | 3.904 |
| Patient 6 | 4.416 | 2.816 | 2.624 | 2.240 | 2.560 |
| Patient 7 | 3.264 | 2.752 | 1.984 | 1.856 | 1.920 |
| Patient 8 | 2.112 | 1.280 | 1.216 | 1.152 | 1.216 |
CONCLUSIONS
A double exponential decay function was proposed to fit the dose distribution outside the PTV, from which the decay coefficient corresponding to the dose drop-off in the medium-to-high dose region was named the DDS. This new variable as an indication for normal tissue sparing was used to evaluate brain SRS plans planned with the prescription IDL from 50% to 90%. The DDS was found to increase with decreasing prescription IDLs and reach a plateau at 70% or 60% IDL. The DDS was also found to be target size dependent, smaller with larger PTVs. Both discovered effects can be explained by the corresponding beam profiles.
FUNDING
This study was funded by the Radiation Oncology Department of the University of Nebraska Medical Center, NE, USA.
REFERENCES
- 1.Suh JH, Barnett GH, Regine WF. Brain metastases. In: Chin LS, Regine WF, eds. Principles and practice of stereotactic radiosurgery. New York, NY: Springer; 2008. pp. 181–91. [Google Scholar]
- 2.Schell M, Bova F, Larson D, Leavitt D, Lutz W, Podgorsak E, et al. Stereotactic radiosurgery. AAPM Report No. 54. Madison, WI: Medical Physics Publication; 1995. [Google Scholar]
- 3.Minniti G, Scaringi C, Clarke E, Valeriani M, Osti M, Enrici RM. Frameless linac-based stereotactic radiosurgery (SRS) for brain metastases: analysis of patient repositioning using a mask fixation system and clinical outcomes. Radiat Oncol 2011; 6: 158. doi: 10.1186/1748-717X-6-158 [DOI] [PMC free article] [PubMed] [Google Scholar]
- 4.Fuss M, Salter BJ, Cheek D, Sadeghi A, Hevezi J, Herman TS. Repositioning accuracy of a commercially available thermoplastic mask system. Radiother Oncol 2004; 71: 339–45. [DOI] [PubMed] [Google Scholar]
- 5.Solberg TD, Medin PM, Mullins J, Li S. Quality assurance of immobilization and target localization system for frameless stereotactic cranial and extracranial hypofractionated radiotherapy. Int J Radiat Oncol Biol Phys 2008; 71(Suppl. 1): S131–5. doi: 10.1016/j.ijrobp.2007.05.097 [DOI] [PubMed] [Google Scholar]
- 6.Cerviño LI, Pawlicki T, Lawson JD, Jiang SB. Frame-less and mask-less cranial stereotactic radiosurgery: a feasibility study. Phys Med Biol 2010; 55: 1863–73. doi: 10.1088/0031-9155/55/7/005 [DOI] [PubMed] [Google Scholar]
- 7.Cerviño LI, Detorie N, Taylor M, Lawson J, Harry T, Murphy KT, et al. Initial clinical experience with a frameless and maskless stereotactic radiosurgery treatment. Pract Radiat Oncol 2012; 2: 54–62. doi: 10.1016/j.prro.2011.04.005 [DOI] [PubMed] [Google Scholar]
- 8.Pan H, Cerviño LI, Pawlicki T, Steve J, Alksne J, Detorie N, et al. Frameless, real-time, surface imaging-guided radiosurgery: clinical outcomes for brain metastases. Neurosurgery 2012; 71: 844–51. [DOI] [PubMed] [Google Scholar]
- 9.Zhang Q, Chan M, Song Y, Burman C. Three dimensional expansion of margins for single fraction treatments: stereotactic radiosurgery brain cases. Int J Med Phys Clin Eng Radiat Oncol 2012; 1: 15–22. [Google Scholar]
- 10.Zhang Q, Chan MF, Burman C, Song Y, Zhang M. Three independent one dimensional margins for single fraction treatments: stereotactic radiosurgery brain cases. Med Phys 2013; 40: 121715. doi: 10.1118/1.4829517 [DOI] [PMC free article] [PubMed] [Google Scholar]
- 11.Zhang Q, Song Y, Chan M, Burman C, Yamada Y. Feasibility study of real time planning for stereotactic. Med Phys 2013; 40: 031711. doi: 10.1118/1.4792637 [DOI] [PMC free article] [PubMed] [Google Scholar]
- 12.Shaw E, Scott C, Souhami L, Dinapoli R, Bahary JP, Kline R, et al. Radiosurgery for the treatment of previously irradiated recurrent primary brain tumors and brain metastases: initial report of radiation therapy oncology protocol (90-05). Int J Radiat Oncol Biol Phys 1996; 34: 647–54. [DOI] [PubMed] [Google Scholar]
- 13.Shaw E, Scott C, Souhami L, Dinapoli R, Kline R, Loeffler J, et al. Single dose radiosurgical treatment of recurrent previously irradiated primary brain tumors and brain metastases: final report of RTOG protocol 90-05. Int J Radiat Oncol Biol Phys 2000; 47: 291–8. [DOI] [PubMed] [Google Scholar]
- 14.Souhami L, Seiferheld W, Brachman D, Podgorsak EB, Werner-Wasik M, Lustig R, et al. Randomized comparison of stereotactic radiosurgery followed by conventional radiotherapy with carmustine to conventional radiotherapy with carmustine for pateints with glioblastoma multiforme: report of Radiation Therapy Oncology Group 93-05 protocol. Int J Radiat Oncol Biol Phys 2004; 60: 853–60. [DOI] [PubMed] [Google Scholar]
- 15.Andrews DW, Scott CB, Sperduto PW, Flanders AE, Gaspar LE, Schell MC, et al. Whole brain radiation therapy with or without stereotactic radiosurgery boost for patients with one to three brain metastases: Phase III results of the RTOG9508 randomised trail. Lancet 2004; 363: 1665–72. [DOI] [PubMed] [Google Scholar]
- 16.Ohtakara K, Hayashi S, Tanaka H, Hoshi H. Consideration of optimal isodose surface selection for target coverage in micro-multileaf collimator-based stereotactic radiotherapy for large cystic brain metastases: comparison of 90, 80 and 70% isodose surface-based planning. Br J Radiol 2012; 85: e640–6. doi: 10.1259/bjr/21015703 [DOI] [PMC free article] [PubMed] [Google Scholar]
- 17.Minniti G, Clarke E, Lanzetta G, Osti MF, Trasimeni G, Bozzao A, et al. Stereotactic radiosurgery for brain metastases: analysis of outcome and risk of brain radionecrosis. Radiat Oncol 2011; 6: 48. doi: 10.1186/1748-717X-6-48 [DOI] [PMC free article] [PubMed] [Google Scholar]
- 18.Blonigen B, Steinmetz R, Levin L, Lamba M, Warnick R, Breneman J. Irradiated volume as a predictor of brain radionecrosis after linear accelerator stereotactic radiosurgery. Int J Radiat Oncol Biol Phys 2010; 77: 996–1001. [DOI] [PubMed] [Google Scholar]
- 19.Varlotto JM, Flickinger JC, Niranjan A, Bhatnagar AK, Kondziolka D, Lunsford LD. Analysis of tumor control and toxicity in patients who have survived at least one year after radiosurgery for brain metastases. Int J Radiat Oncol Biol Phys 2003; 57: 452–64. [DOI] [PubMed] [Google Scholar]
- 20.Voges J, Treuer H, Sturm V, Büchner C, Lehrke R, Kocher M, et al. Risk analysis of linear accelerator radiosurgery. Int J Radiat Oncol Biol Phys 1996; 36: 1055–63. [DOI] [PubMed] [Google Scholar]


