Abstract
Objective:
The objective of this study was to assess the efficacy of diffusion-weighted MRI (DWI) in monitoring response to radiotherapy in high-risk prostate cancer (PC).
Methods:
This retrospective study included 78 patients with high-risk PC undergoing 3.0-T MRI (supplemented by DWI) before and after intensity-modulated radiotherapy (IMRT). Based on follow-up clinical examinations, patients were divided into two groups: the recurrence group (patients who suffered biochemical/clinical recurrence within 3 years, n = 13) and the non-recurrence group (patients who were recurrence free for over 3 years, n = 65). The apparent diffusion coefficient (ADC) values before and after IMRT were compared between these two groups. The receiver-operating characteristics (ROC) analysis was carried out to investigate the discriminatory capability for pre- and post-IMRT ADC values.
Results:
The overall ADC values were 1.04 ± 0.18 × 10⁻³ mm2 s−1 for PCs before IMRT and 1.45 ± 0.15 × 10⁻³ mm2 s−1 after IMRT (p < 0.001). A statistically significant difference in post-IMRT ADC values was noted between patients with and without recurrence (1.27 ± 0.14 × 10⁻³ mm2 s−1 vs 1.49 ± 0.12 × 10⁻³mm2 s−1; p < 0.001), although there was no statistical difference between them in pre-IMRT ADC values (1.00 ± 0.17 × 10⁻³ mm2 s−1 vs 1.05 ± 0.18 × 10⁻³ mm2 s−1; p = 0.31). The ROC curve analysis revealed that the post-IMRT ADC values could help identify patients suffering recurrences (area under the curve, 0.88; p < 0.001).
Conclusion:
Marked increase in ADC values was observed in PC after radiotherapy, especially in good responders. DWI is a valuable tool for monitoring the response to radiotherapy.
Advances in knowledge:
This study examined the relationship between ADC changes and tumour response to treatment of PC.
Prostate cancer (PC) is the most common cancer in elderly males in Western Europe and North America.1 Although China is considered to have low incidence, the trend appears to be on the rise. According to the 2002 database of the International Agency for Research on Cancer, the mortality-to-incidence rate ratio (MR/IR) of PC in China is 0.63, which was found to be higher than the average in Asia (MR/IR = 0.57) and much higher than that in North America (MR/IR = 0.13).2,3 These data indicated that, in China, most PCs were at the advanced stage at the time of diagnosis, and patients had a short survival time thereafter. As such, it will be prudent to address this rising challenge by developing a method for an early detection of PC and for a reliable measure of tumour response to therapy, thereby improving the MR/IR of PC in China.
Currently, clinical research in diffusion-weighted MRI (DWI) is undergoing rapid expansion to depict biological changes in humans, and it has been shown that early changes in apparent diffusion coefficient (ADC) values following anti-cancer treatment may hold promise to serve as an early surrogate for long-term response in various diseases such as metastatic liver tumours, breast cancers and bone sarcomas.4–7 However, there are relatively few reports systematically examining the relationship between ADC changes and tumour response to treatment of PC.
As such, the objective of the present study was to investigate the changes in ADC values after radiotherapy, in patients with high-risk PC who showed various degrees of response. It is hoped that this investigation can contribute to better evaluation of DWI in monitoring the response to radiotherapy in PC.
METHODS AND MATERIALS
Patients
This was a retrospective single-institution study approved by our Committee on Human Research with waiver of informed consent. The study was compliant with the requirements of the Health Insurance Portability and Accountability Act.
We retrospectively identified and enrolled in this study, through a cross-correlated and computerized search of our medical and radiology information systems, all patients who met the following inclusion criteria:
(1) clinically defined high-risk PC with intensity-modulated radiotherapy (IMRT)
(2) pre-IMRT 3.0-T MRI of the prostate performed within 3 months before the start of radiation therapy
(3) post-IMRT 3.0-T MRI of the prostate performed within 4 months after the completion of radiotherapy
(4) with over 3 years of clinical follow-up.
The patients were identified according to the most current guidelines, which define high-risk PC as patients with clinical stage T3a disease, and/or Gleason score of 8–10, and/or prostate-specific antigen (PSA) level >20 ng ml−1, and those with clinical stage T3b and T4 disease without evidence of nodal or metastatic involvement are also defined as very high-risk patients.8
Between June 2007 and December 2010, 78 patients (median age, 67 years; age range, 46–81 years) met these criteria. The clinical information was redacted for blind review.
All patients underwent transrectal sonography-guided biopsy, and pre-IMRT MRIs were performed 21–59 days (mean, 36.8 days) after the biopsy.
The IMRT was applied, and the radiation portal included prostate and seminal vesicles with a dose of 3.0 Gy in a single irradiation for 5 consecutive days in a week. The treatment lasted 5 weeks with a total prescription dose of 75 Gy over this period. For the pelvic portal, the dose was 2 Gy in a single irradiation for 5 consecutive days during the week and the treatment lasted 5 weeks with the total prescription dose of 50 Gy. All patients received simultaneous androgen deprivation therapy (ADT).
The mean interval from the initial MRI to the start of radiation therapy was 4.8 weeks (range, 1–11 weeks). The mean interval between post-IMRT MRI and the completion of radiotherapy was 8.7 weeks (range, 5–17 weeks); there was no significant difference between the recurrence group and the non-recurrence group in the time interval between the completion of radiotherapy and post-IMRT MRI (8.7 ± 2.9 weeks vs 8.7 ± 3.2 weeks; p = 0.36).
Patient follow-up
The median duration of follow-up was 40 months (range, 36–48 months). Among 78 patients, 13 patients suffered recurrence within 3 years (12 with biopsy-proved local recurrence, 3 accompanied with distant recurrences and 1 with biochemical recurrence) and 65 patients were recurrence free for over 3 years. The median time to recurrence was 18 months (range, 9–30 months). The characteristics of the studied patients are summarized in Table 1 (non-recurrence group) and Table 2 (recurrence group).
Table 1.
Clinical information of patients in non-recurrence group
| Prognostic indicators | No. of patients (n = 65) |
|---|---|
| Gleason score | |
| 6 | 7 |
| 7 | 32 |
| 8 | 13 |
| 9 | 7 |
| 10 | 6 |
| T staging | |
| T2b | 7 |
| T2c | 9 |
| T3a | 31 |
| T3b | 13 |
| T4 | 5 |
| Pre-treatment prostate-specific antigen (ng ml−1) | |
| ≤10 | 1 |
| 10–20 | 9 |
| >20 | 55 |
Table 2.
Clinical information of patients in recurrence group
| Prognostic indicators | No. of patients (n = 13) |
|---|---|
| Gleason score | |
| 6 | 0 |
| 7 | 4 |
| 8 | 2 |
| 9 | 4 |
| 10 | 3 |
| T staging | |
| T2b | 1 |
| T2c | 2 |
| T3a | 4 |
| T3b | 3 |
| T4 | 3 |
| Pre-treatment prostate-specific antigen (ng ml−1) | |
| ≤10 | 1 |
| 10–20 | 2 |
| >20 | 10 |
MRI examinations
MRI examinations were performed on a 3.0-T whole-body MRI scanner (Signa® Excite HD; GE Medical Systems, Milwaukee, WI) with a phased-array external coil. Before each MRI examination, intestine preparations were performed in patients to mitigate the movement of the intestine and artefacts caused by intestinal gas. Transverse T1 weighted images [repetition time (TR), 460–570 ms; echo time (TE), minimum-full; slice thickness, 6 mm; interslice gap, 0.6 mm; field of view (FOV), 40 × 40 cm2; matrix, 320 × 224 pixels] and transverse T2 weighted fast recovery fast-spin echo (FRFSE) images [TR, 4500–5900 ms; TE, 100–140 ms; echo train length, 19–25; slice thickness, 4 mm; interslice gap, 0.4 mm; FOV, 26 × 26 cm2; matrix, 320 × 256 pixels] of the prostate and seminal vesicles were obtained. Owing to its thinner slice and smaller FOV, the transverse FRFSE T2 weighted images (slice thickness, 4 mm; interslice gap, 0.4 mm; FOV, 26 × 26 cm2) produced a more clear and detailed image of the prostate.
Transverse T2 weighted fat-saturated fast-spin echo (FSE) images (slice thickness, 6 mm; gap, 0.6 mm; FOV, 40 × 40 cm2; matrix, 320 × 256 pixels), coronal T2 weighted fat-saturated FRFSE (slice thickness, 5 mm; gap, 0.5 mm; FOV, 40 × 40 cm2; matrix, 288 × 224 pixels), as well as sagittal T2 weighted FSE images (slice thickness, 5 mm; gap, 0.5 mm; FOV, 28 × 28 cm2; matrix, 288 × 224 pixels) of the pelvis were also acquired.
DWI was performed using single-shot spin-echo echo-planar imaging sequence with bipolar gradient pulses along three orthogonal axes. The imaging parameters were as follows: matrix size, 128 × 128 pixels; slice thickness, 6 mm; gap, 0.6 mm; b-values, 0 and 800 s mm−2; optimized TE (range, 55.1–66.2 ms) and TR (range, 2200–2225 ms); number of excitations, two; and FOV, 40 × 40 cm2. DWI acquisition time was approximately 44 s with 24 slices encompassing the prostate and seminal vesicles.
Image analysis
All images were retrospectively analysed in consensus by two radiologists with 18 and 10 years' of experience in genitourinary MRI diagnosis, respectively. The localization of PC was determined by consensus of these two readers based on a comparison of the pathological results of biopsies, and the presence of a focal low signal intensity area in the peripheral zone on ADC maps and T2 weighted images.
ADC maps were generated on a pixel-by-pixel basis using the onboard software (AW4.2 Functool; GE Healthcare, Milwaukee, WI). Before radiotherapy, regions of interest (ROIs) within tumours were drawn on ADC maps to include as much of the tumour as possible. ADC values in tumours were assessed twice at the same site, and the average value was determined. For tumours located across several slices, ADC values were measured in each slice, and the mean values were taken. In patients with multiple lesions, all lesions were measured, and the average was calculated. Upon completion of radiotherapy, ROIs were drawn in areas where the initial tumour was located by two radiologists in consensus. ADC values were obtained in the same manner. Pre- and post-IMRT transverse high-resolution T2 weighted images corresponding to the ADC maps were also used to confirm the ROIs after radiotherapy.
All ROIs were determined by taking great care to exclude the neurovascular bundle, the urethra and post-biopsy haemorrhage (if any) to reduce potential errors in ADC calculations.
For the measurement of ADC values in benign tissues, ROIs were selected in the biopsy-proven non-cancerous peripheral zone. In two consecutive slices of images, ADC values were measured by including the entire region of the peripheral zone, and the average was obtained before and after radiotherapy.
Data analysis
Statistical analysis was performed using the program SPSS® v. 17.0 (SPSS Inc., Chicago, IL). The paired samples t-test was used to compare ADC values of cancer and benign tissues before and after radiotherapy. The comparison of mean ADC values of patients with and without recurrence was performed using the independent samples t-test, with p < 0.05 considered statistically significant.
The receiver-operating characteristics (ROC) analysis with regard to the area under the curve (AUC) was carried out to investigate the discriminatory capability for pre- and post-IMRT ADC values. For determination of sensitivity, specificity and accuracy, equal weighting was given to sensitivity and specificity.
RESULTS
Results of diffusion-weighted image analysis
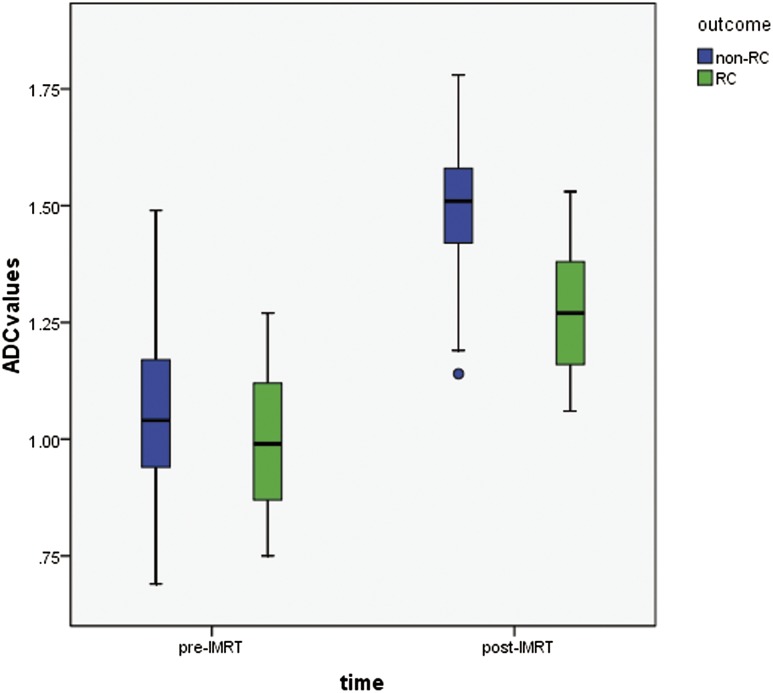
The overall ADC values were 1.04 ± 0.18 × 10⁻³ mm2 s−1 for PCs before IMRT and 1.45 ± 0.15 × 10⁻³ mm2 s−1 after IMRT (p < 0.001). The mean ADC value of the local recurrence group was significantly lower than that of the non-recurrence group after the completion of radiotherapy (1.27 ± 0.14 × 10⁻³ mm2 s−1 vs 1.49 ± 0.12 × 10⁻³ mm2 s−1; p < 0.001), but no statistical difference was noted between them in pre-IMRT ADC values (1.00 ± 0.17 × 10⁻³ mm2 s−1 vs 1.05 ± 0.18 × 10⁻³ mm2 s−1; p = 0.31) (Figure 1).
Figure 1.
Boxplot of apparent diffusion coefficient (ADC) values in recurrence group (RC) and non-recurrence group before and after radiotherapy. The circle indicates an outlier. IMRT, intensity-modulated radiotherapy.
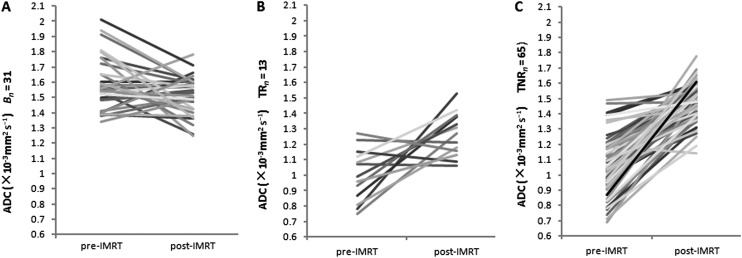
In all patients, 31 sides of peripheral zones were proven non-cancerous, and, as such, 31 ROIs were chosen in this study. ADC values were 1.59 ± 0.17 × 10⁻³ mm2 s−1 before and 1.51 ± 0.13 × 10⁻³ mm2 s−1 after IMRT for benign tissues, a significant difference was noted between them (p = 0.036). There was no significant difference, however, in ADC values between the tumours of recurrence-free patients and benign tissues after the completion of IMRT (1.49 ± 0.12 × 10⁻³ mm2 s−1 vs 1.51 ± 0.13 × 10⁻³ mm2 s−1; p = 0.47). Importantly, a significant difference was found between them in pre-IMRT ADC values (1.05 ± 0.18 × 10⁻³ mm2 s−1 vs 1.59 ± 0.17 × 10⁻³ mm2 s−1; p < 0.001) (Table 3, Figure 2).
Table 3.
Apparent diffusion coefficient (ADC) values of tumours and benign tissues before and after intensity-modulated radiotherapy (IMRT) (×10−3 mm2 s−1)
| Time of ADC measurement | ADC value × 10-3 mm2 s−1, mean ± standard deviation (range) |
|
|---|---|---|
| Tumours (n = 78) | Benign tissues (n = 31) | |
| Pre-IMRT overall | 1.04 ± 0.18 (0.69–1.49) | 1.59 ± 0.17 (1.34–2.01) |
| Non-recurrence group (n = 65) | 1.05 ± 0.18 (0.69–1.49) | |
| Recurrence group (n = 13) | 1.00 ± 0.17 (0.74–1.27) | |
| Post-IMRT overall | 1.45 ± 0.15 (1.06–1.78) | 1.51 ± 0.13 (1.25–1.78) |
| Non-recurrence group | 1.49 ± 0.12 (1.14–1.78) | |
| Recurrence group | 1.27 ± 0.14 (1.06–1.53) | |
Comparison of the mean ADC values of tumours: the mean post-IMRT ADC value of the recurrence group was significantly lower than that of the non-recurrence group; p < 0.001. After IMRT there was no significant difference in ADC values between the benign tissues and tumours of non-recurrence group; p = 0.47.
Figure 2.
Graph of change in apparent diffusion coefficient (ADC) values in benign tissues (A; Bn = 31), tumours of recurrence group (B; Tn 13) and tumours of non-recurrence group (C; Tn 65) from 53 prostate cancers patients after radiotherapy. IMRT, intensity-modulated radiotherapy; TNR, tumours of non-recurrence; TR, tumours of recurrence.
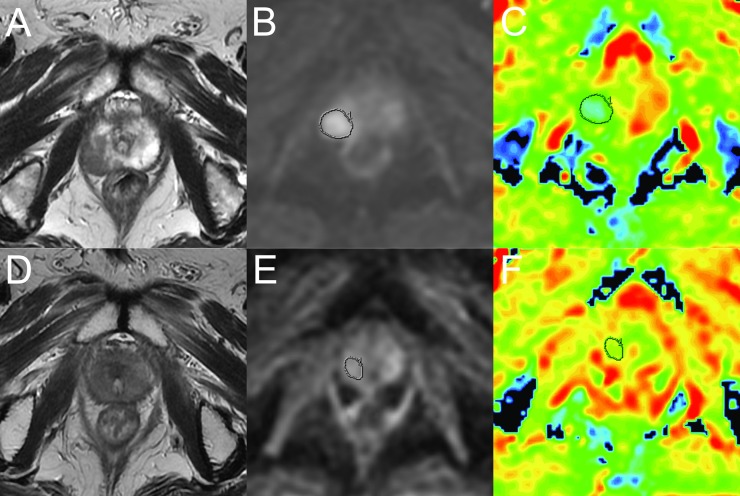
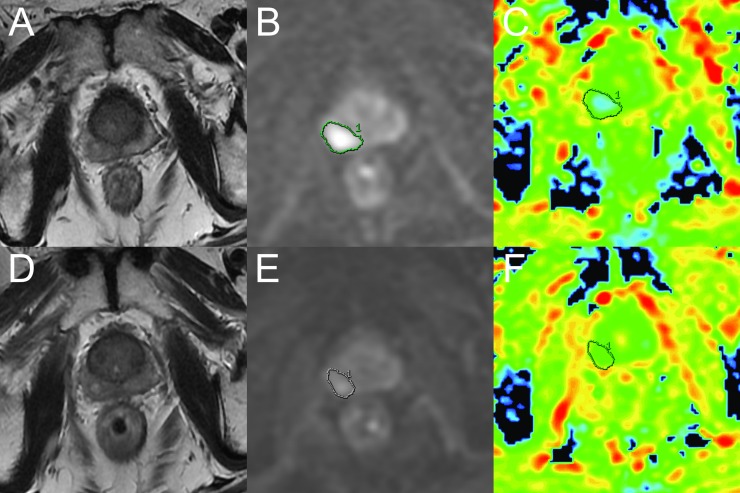
For graphic illustrations, Figure 3 shows the transverse FRFSE T2 weighted images and DWI change of a recurrence-free patient before and after radiotherapy, and Figure 4 shows the transverse FRFSE T2 weighted images and DWI change of a recurrence patient before and after radiotherapy.
Figure 3.
A recurrence-free patient with biopsy-proven prostate cancer in the right peripheral zone (Gleason score, 4 + 3; pre-treatment prostate-specific antigen, 25.87 ng ml−1). (a) Before radiotherapy, the tumour appears as low signal intensity in the right peripheral zone on a T2 weighted fast-recovery fast-spin echo (FRFSE) image [repetition time (TR)/echo time (TE), 5540/125 ms]. (b, c) Diffusion-weighted (DW) image (TR/TE, 2200/64.4 ms; b = 0 and 800 s mm−2) shows a diffusion-restricted area in the right lobe; mean apparent diffusion coefficient (ADC) value of the cancer was 0.93 × 10⁻³ mm2 standard deviation. (d) 4 months after the completion of intensity-modulated radiotherapy, axial T2 weighted FRFSE image (TR/TE, 4940/131 ms) shows an overall reduction in gland volume; T2 signal reduction in both peripheral zones compromises distinction of the tumour margins. (e, f) DW image (TR/TE, 2200/64.4 ms; b = 0 and 800 s mm−2) shows no obvious diffusion-restricted area in the right lobe. Mean ADC value of the area where the tumour was located in pre-treatment was 1.48 × 10⁻³mm2 s−1.
Figure 4.
A 65-year-old male with biopsy proven prostate cancer in the right peripheral zone (Gleason score, 5 + 3; pre-treatment prostate-specific antigen, 27.42 ng ml−1) who had received 8-week androgen deprivation therapy before the start of intensity-modulated radiotherapy (IMRT). This patient suffered local and distant recurrence 18 months after the completion of IMRT. (a) Before IMRT, the axial T2 weighted fast recovery fast-spin echo (FRFSE) image [repetition time (TR)/ echo time (TE), 5440/122 ms] shows prostate cancer of low signal intensity in the right peripheral zone. The T2 signal reduction is in the normal peripheral zone because of androgen deprivation therapy. (b, c) Pre-IMRT diffusion-weighted (DW) image (TR/TE, 2200/64.4 ms; b = 0 and 800 s mm−2) shows a diffusion-restricted area in the right lobe; the mean apparent diffusion coefficient (ADC) value of the cancer was 0.99 × 10⁻³ mm2 standard deviation. (d) 9 weeks after the completion of radiotherapy, the axial T2 weighted FRFSE image (TR/TE, 5440/121 ms) shows that the lesion was diffusely ill defined. (e, f) Post-IMRT DW image (TR/TE, 2200/64.4 ms; b = 0 and 800 s mm−2) shows a slightly diffusion restricted area in the right peripheral zone. The mean ADC value of the region of interest was 1.24 × 10⁻³ mm2 s−1.
Receiver-operating characteristic analysis
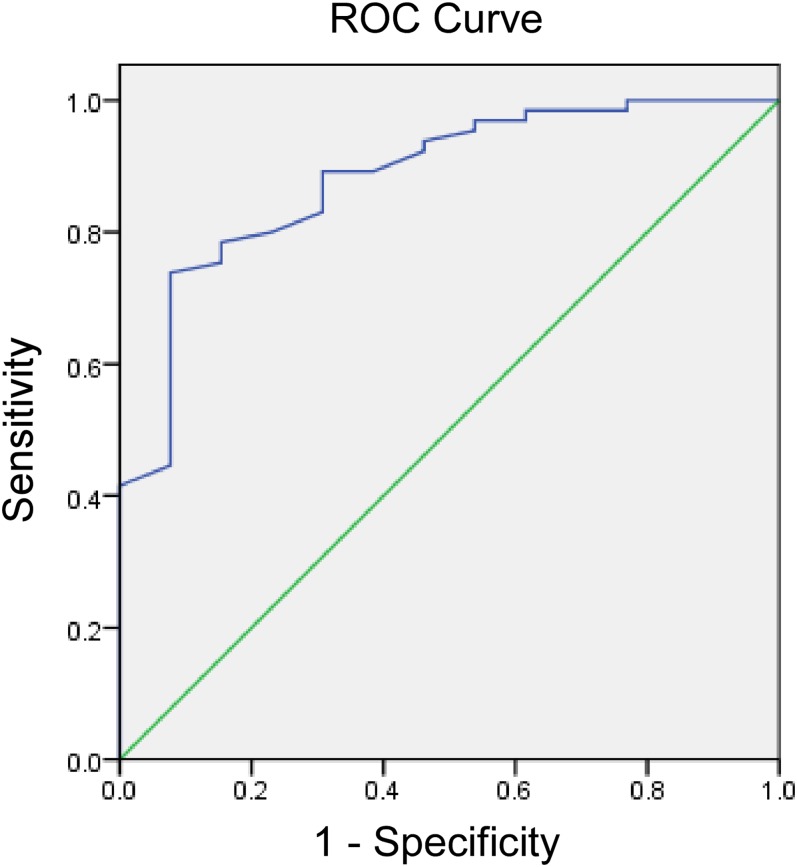
ROC curve analysis revealed that the post-IMRT ADC values could help identify patients suffering recurrences (AUC, 0.88; p < 0.001) with a threshold value for the post-IMRT ADC value <1.34 × 10⁻³ mm2 s−1 (sensitivity, 69.2%; specificity, 89.2%) (Figure 5). When 1.34 × 10⁻³ mm2 s−1 was chosen as the threshold, the true-positive rate was 69.2% (9/13) and the true-negative rate was 89.2% (58/65) in this group of patients. Furthermore, 27 patients had a repeat post-IMRT MR DWI exam (2–6 months after the first post-IMRT MR exam), 3 of them showed an obvious increase in ADC values. When these new data were analysed the true-negative value became 93.8% and the true-positive rate was still 69.2% (9/13).
Figure 5.
Receiver-operating characteristic (ROC) curves show the diagnostic performance of post-intensity-modulated radiotherapy (IMRT) apparent diffusion coefficient (ADC) values for predicting recurrent cancer after radiation therapy. Area under the ROC curve is 0.88 (p < 0.001) with a threshold value for the post-IMRT ADC value <1.34 × 10⁻³ mm2 s−1 (sensitivity, 69.2%; specificity, 89.2%).
The pre-IMRT ADC values were considered non-indicative in identifying patients with recurrence (AUC, 0.57; p = 0.43).
Prostate-specific antigen change
The PSA change was also recorded in the recurrence and non-recurrence groups between pre-treatment and post-treatment. The descriptions of PSA were median ± interquartile range, because of the non-normally distributed data, and were compared using the Mann–Whitney U-test. The pre-treatment PSA was 45.99 ± 47.79 ng ml−1 in the recurrence group and 36.58 ± 18.63 ng ml−1 in the non-recurrence group (p = 0.27). However, it was 0.80 ± 1.29 ng ml−1 in the recurrence group and 0.28 ± 0.38 ng ml−1 in the non-recurrence group 4 months after the completion of radiotherapy (p = 0.04).
DISCUSSION
Traditionally, patients with high-risk PC have a significant likelihood of treatment failure and PC-specific mortality even when advances in local treatments such as dose-escalated radiotherapy have demonstrated benefits in these patients.9–11 Three major pre-therapy prognostic indicators are widely used to assess the risk of PC recurrence. These are the T stage, the biopsy Gleason score and the serum PSA level.12 Sometimes, subjectivity is associated with T-stage determination and the Gleason score, making these two variables less robust when a multivariate analysis is used.12
Patients undergoing radiation therapy need to be followed up indefinitely for treatment failure. Among several routine examinations, PSA levels are used to potentially serve as a surrogate in follow-up treatments; although, it has been shown to have a limited role in defining a cancer cure within the first 5 years after radiotherapy.13
Imaging techniques can generate additional major indicators in clinical follow-up examinations.14 Being capable of non-invasive characterizations of biological tissues based on its water diffusion properties, DWI has long been used to detect subtle, early changes indicative of disease processes, often at times well before any visible abnormality can be seen on conventional morphological imaging.15–18
It is reported that following radiotherapy, ADCs may rapidly decrease over several hours owing to cell swelling, followed by an increase over several days with concurrent cell death.19,20 When compared with baseline, the greatest early increase in tumour mean ADC values was seen during the first week of radiotherapy. Others have reported an increase in ADC as early as 4–11 days after treatment.18,21,22
While an increase in ADC values following treatment likely indicates the alterations in cell density owing to necrosis and apoptotic-induced cell death, a non-increase or even decrease in ADC values after radiotherapy results from sustained high density or continued proliferation of tumour cells and probably indicates a poor response to radiotherapy. As such, persistent low ADC values after treatment may be an indicator of poor outcome. In this study, the mean post-IMRT ADC value of patients who suffered recurrence within 3 years was found to be significantly lower than that of patients who were recurrence free for over 3 years. Furthermore, the ROC curve analysis revealed that the post-IMRT ADC values could help identify patients with recurrence with high specificity, and that repeat MR DWI examinations after radiotherapy can improve the specificity ulteriorly. This once again confirms that DWI has the potential to monitor the treatment response in some tumours.23,24
It has been found that, in this group of patients, the post-IMRT ADC values were slightly lower than those reported in previous reports.25 We hypothesized that the main reason may be because patients received ADT in conjunction with radiotherapy. ADT induces acinar atrophy, fibrosis and basal cell hyperplasia. This atrophy and compression of the glandular lumina reduces the available space and thus acts to restrict diffusion.26 Combination therapy with radiation and long-term ADT has been a standard of care for males with high-risk PC, demonstrating a significant survival benefit over radiotherapy alone.27 Barrett et al28 proved that there was no significant change in ADC values in tumours after 3 months of ADT, whereas ADC values significantly decreased in areas of the normal-appearing peripheral zone, from 1.78 × 10⁻³ to 1.56 × 10⁻³ mm2 s−1.
In this study, benign prostate tissue showed a mild reduction in ADC values after radiotherapy, and there were no significant differences between benign tissues and tumours in recurrence-free patients in the post-IMRT ADC values. Pathology findings revealed that normal prostate tissues also reacted to external beam radiation and showed different degrees of vascular damage, gland atrophy and fibrosis.29
It should be noted that there are several limitations in this study. For example, the number of patients in the recurrence group is relatively small and most patients only take one time-point MR examination in the first year after radiotherapy. Furthermore, we used the high b-value of 800 initially since 2007 in this study, and kept its use for keeping the consistency of examination till 2011; however, in recent years, higher b-values of 1000 or 1200 are often recommended. So, larger and more definitive studies with clinical end points and pre-therapeutic prediction for treatment failure should be carried out to further address these issues.
CONCLUSIONS
In conclusion, this preliminary study revealed a correlation between early changes in ADC values after radiotherapy and later tumour response/outcome in patients with high-risk PC. In tumour regions, lower ADC values after radiotherapy would be associated with an increased chance of clinical recurrence. It is thus anticipated that DWI may have the potential to monitor the treatment response and predict the treatment outcome in high-risk PC early.
REFERENCES
- 1.Jemal A, Murray T, Ward E, Samuels A, Tiwari RC, Ghafoor A, et al. Cancer statistics. CA Cancer J Clin 2005; 55: 10–30. doi: 10.3322/caac.20073 [DOI] [PubMed] [Google Scholar]
- 2.Zhang L, Wu S, Guo LR, Zhao XJ. Diagnostic strategies and the incidence of prostate cancer: reasons for the low reported incidence of prostate cancer in China. Asian J Androl 2009; 11: 9–13. doi: 10.1038/aja.2008.21 [DOI] [PMC free article] [PubMed] [Google Scholar]
- 3.Collin SM, Martin RM, Metcalfe C, Gunnell D, Albertsen PC, Neal D, et al. Prostate-cancer mortality in the USA and UK in 1975–2004: an ecological study. Lancet Oncol 2008; 9: 445–52. doi: 10.1016/S1470-2045(08)70104-9 [DOI] [PMC free article] [PubMed] [Google Scholar]
- 4.Dudeck O, Zeile M, Wybranski C, Schulmeister A, Fischbach F, Pech M, et al. Early prediction of anticancer effects with diffusion-weighted MR imaging in patients with colorectal liver metastases following selective internal radiotherapy. Eur Radiol 2010; 20: 2699–706. doi: 10.1007/s00330-010-1846-z [DOI] [PubMed] [Google Scholar]
- 5.Wybranski C, Zeile M, Löwenthal D, Fischbach F, Pech M, Röhl FW, et al. Value of diffusion weighted MR imaging as an early surrogate parameter for evaluation of tumor response to high-dose-rate brachytherapy of colorectal liver metastases. Radiat Oncol 2011; 6: 43. doi: 10.1186/1748-717X-6-43 [DOI] [PMC free article] [PubMed] [Google Scholar]
- 6.Pickles MD, Gibbs P, Lowry M, Turnbull LW. Diffusion changes precede size reduction in neoadjuvant treatment of breast cancer. Magn Reson Imaging 2006; 24: 843–7. [DOI] [PubMed] [Google Scholar]
- 7.Hamstra DA, Rehemtulla A, Ross BD. Diffusion magnetic resonance imaging: a biomarker for treatment response in oncology. J Clin Oncol 2007; 25: 4104–9. [DOI] [PubMed] [Google Scholar]
- 8.Mohler J, Bahnson RR, Boston B, Busby JE, D'Amico A, Eastham JA, et al. NCCN clinical practice guidelines in oncology: prostate cancer. J Natl Compr Canc Netw 2010; 8: 162–200. [DOI] [PubMed] [Google Scholar]
- 9.Marciscano AE, Hardee ME, Sanfilippo N. Management of high-risk localized prostate cancer. Adv Urol 2012; 2012: 641689. doi: 10.1155/2012/641689 [DOI] [PMC free article] [PubMed] [Google Scholar]
- 10.Bastian PJ, Boorjian SA, Bossi A, Briganti A, Heidenreich A, Freedland SJ, et al. High-risk prostate cancer: from definition to contemporary management. Eur Urol 2012; 61: 1096–106. doi: 10.1016/j.eururo.2012.02.031 [DOI] [PubMed] [Google Scholar]
- 11.Stenmark MH, Blas K, Halverson S, Sandler HM, Feng FY, Hamstra DA. Continued benefit to androgen deprivation therapy for prostate cancer patients treated with dose-escalated radiation therapy across multiple definitions of high-risk disease. Int J Radiat Oncol Phys 2011; 81: e335–44. doi: 10.1016/j.ijrobp.2011.04.037 [DOI] [PubMed] [Google Scholar]
- 12.Brawer MK. Radiation therapy failure in prostate cancer patients: risk factors and methods of detection. Rev Urol 2002; 4: S2–11. [PMC free article] [PubMed] [Google Scholar]
- 13.Roach M, 3rd, Hanks G, Thames H, Jr, Schellhammer P, Shipley WU, Sokol GH, et al. Defining biochemical failure following radiotherapy with or without hormonal therapy in men with clinically localized prostate cancer: recommendations of the RTOG-ASTRO Phoenix Consensus Conference. Int J Radiat Oncol Biol Phys 2006; 65: 965–74. [DOI] [PubMed] [Google Scholar]
- 14.Padhani AR. Functional MRI for anticancer therapy assessment. Eur J Cancer 2002; 38: 2116–27. [DOI] [PubMed] [Google Scholar]
- 15.Hein P, Kremser C, Judmaier W, Griebel J, Pfeiffer KP, Kreczy A, et al. Diffusion-weighted magnetic resonance imaging for monitoring diffusion changes in rectal carcinoma during combined, preoperative chemoradiation: preliminary results of a prospective study. Eur J Radiol 2003; 45: 214–22. [DOI] [PubMed] [Google Scholar]
- 16.Koh DM, Collins DJ. Diffusion-weighted MRI in the body: applications and challenges in oncology. AJR Am J Roentgenol 2007; 188: 1622–35. [DOI] [PubMed] [Google Scholar]
- 17.Theilmann RJ, Borders R, Trouard TP, Xia G, Outwater E, Ranger-Moore J, et al. Changes in water mobility measured by diffusion MRI predict response of metastatic breast cancer to chemotherapy. Neoplasia 2004; 6: 831–7. [DOI] [PMC free article] [PubMed] [Google Scholar]
- 18.Eccles CL, Haider EA, Haider MA, Fung S, Lockwood G, Dawson LA. Change in diffusion weighted MRI during liver cancer radiotherapy: preliminary observations. Acta Oncol 2009; 48: 1034–43. doi: 10.1080/02841860903099972 [DOI] [PubMed] [Google Scholar]
- 19.Herneth AM, Guccione S, Bednarski M. Apparent diffusion coefficient: a quantitative parameter for in vivo tumor characterization. Eur J Radiol 2003; 45: 208–13. [DOI] [PubMed] [Google Scholar]
- 20.Afaq A, Andreou A, Koh DM. Diffusion-weighted magnetic resonance imaging for tumor response assessment: why, when and how? Cancer Imaging 2010; 10 Spec no A: S179–88. doi: 10.1102/1470-7330.2010.9032 [DOI] [PMC free article] [PubMed] [Google Scholar]
- 21.Zhao M, Pipe JG, Bonnett J, Evelhoch JL. Early detection of treatment response by diffusion-weighted 1H-NMR spectroscopy in a murine tumor in vivo. Br J Cancer 1996; 73: 61–4. [DOI] [PMC free article] [PubMed] [Google Scholar]
- 22.Kim CK, Park BK, Lee HM. Prediction of locally recurrent prostate cancer after radiation therapy: incremental value of 3T diffusion-weighted MRI. J Magn Reson Imaging 2009; 29: 391–7. doi: 10.1002/jmri.21645 [DOI] [PubMed] [Google Scholar]
- 23.Harry VN, Semple SI, Gilbert FJ, Parkin DE. Diffusion-weighted magnetic resonance imaging in the early detection of response to chemoradiation in cervical cancer. Gynecol Oncol 2008; 111: 213–20. doi: 10.1016/j.ygyno.2008.07.048 [DOI] [PubMed] [Google Scholar]
- 24.Wieduwilt MJ, Valles F, Issa S, Behler CM, Hwang J, McDermott M, et al. Immunochemotherapy with intensive consolidation for primary CNS lymphoma: a pilot study and prognostic assessment by diffusion-weighted MRI. Clin Cancer Res 2012; 18: 1146–55. doi: 10.1158/1078-0432.CCR-11-0625. [DOI] [PMC free article] [PubMed] [Google Scholar]
- 25.Song I, Kim CK, Park BK, Park W. Assessment of response to radiotherapy for prostate cancer: value of diffusion-weighted MRI at 3 T. AJR Am J Roentgenol 2010; 194: W477–82. doi: 10.2214/AJR.09.3557 [DOI] [PubMed] [Google Scholar]
- 26.Roznovanu SL, Rădulescu D, Novac C, Stolnicu S. The morphologic changes induced by hormone and radiation therapy on prostate carcinoma. Rev Med Chir Soc Med Nat Iasi 2005; 109: 337–42. [PubMed] [Google Scholar]
- 27.D'Amico AV, Chen MH, Renshaw AA, Loffredo M, Kantoff PW. Androgen suppression and radiation vs radiation alone for prostate cancer: a randomized trial. JAMA 2008; 299: 289–95. doi: 10.1001/jama.299.3.289 [DOI] [PubMed] [Google Scholar]
- 28.Barrett T, Gill AB, Kataoka MY, Priest AN, Joubert I, McLean MA, et al. DCE and DW MRI in monitoring response to androgen deprivation therapy in patients with prostate cancer: a feasibility study. Magn Reson Med 2012; 67: 778–85. doi: 10.1002/mrm.23062 [DOI] [PubMed] [Google Scholar]
- 29.Petraki CD, Sfikas CP. Histopathological changes induced by therapies in the benign prostate and prostate adenocarcinoma. Histol Histopathol 2007; 22: 107–18. [DOI] [PubMed] [Google Scholar]


