

Abstract
OBJECTIVE
In the U.S., an astonishing 12.5 million children and adolescents are now obese, predisposing 17% of our nation’s youth to metabolic complications of obesity, such as type 2 diabetes (T2D). Adolescent obesity has tripled over the last three decades in the setting of food advertising directed at children. Obese adults exhibit increased brain responses to food images in motivation-reward pathways. These neural alterations may be attributed to obesity-related metabolic changes, which promote food craving and high-calorie food (HCF) consumption. It is not known whether these metabolic changes affect neural responses in the adolescent brain during a crucial period for establishing healthy eating behaviors.
RESEARCH DESIGN AND METHODS
Twenty-five obese (BMI 34.4 kg/m2, age 15.7 years) and fifteen lean (BMI 20.96 kg/m2, age 15.5 years) adolescents underwent functional MRI during exposure to HCF, low-calorie food (LCF), and nonfood (NF) visual stimuli 2 h after isocaloric meal consumption.
RESULTS
Brain responses to HCF relative to NF cues increased in obese versus lean adolescents in striatal-limbic regions (i.e., putamen/caudate, insula, amygdala) (P < 0.05, family-wise error [FWE]), involved in motivation-reward and emotion processing. Higher endogenous leptin levels correlated with increased neural activation to HCF images in all subjects (P < 0.05, FWE).
CONCLUSIONS
This significant association between higher circulating leptin and hyperresponsiveness of brain motivation-reward regions to HCF images suggests that dysfunctional leptin signaling may contribute to the risk of overconsumption of these foods, thus further predisposing adolescents to the development of obesity and T2D.
Introduction
During the last three decades, adolescent obesity has dramatically increased, predisposing 17% of youth in the U.S. (1) to increased risk of a variety of metabolic disorders, including prediabetes and type 2 diabetes (T2D) (2,3). This is of particular concern, since the incidence of prediabetes/diabetes in this population has tripled (4), progression from prediabetes to diabetes generally occurs more rapidly in youth (in just 21 months) (5), and current clinical care for T2D in youth has been relatively ineffective, as demonstrated in the Treatment Options for Type 2 Diabetes in Adolescents and Youth (TODAY) trial (6). Given the short window of opportunity for effective therapeutic intervention in this specific diabetes population, it is essential to gain a better understanding of the complex mechanisms that drive obesity and overeating if we are to diminish the appearance of T2DM in adolescence (7).
Accumulating evidence supports the critical role of the neuroendocrine system in weight homeostasis and the development of obesity (7–9). Neuroimaging studies examining obesity have begun to assess the functional integrity of brain reward and motivational pathways (10) and neural responses to visual food cues (9,11,12) such as those depicted in commonly encountered food advertising including fast food, sugar-sweetened cereals, soda, snacks, and candy (13). Notably, studies have shown that viewing food-related advertisements on television increases food intake in children (14,15), and childhood overweight has been linked to advertising of energy-dense foods (16). While a growing number of neuroimaging studies reveal exaggerated responses in brain motivation-reward and emotion regions in response to food images in obese adults and adolescents (11,17), as well as relatively less prefrontal cortex response (to food logos) in obese children (18), the contribution of obesity-related metabolic and hormonal changes to these altered neural responses remains uncertain. Both preclinical and clinical research has shown that both leptin (19,20) and insulin (21–23) act in the central nervous system (7,19,21) to alter brain pathways that influence food intake (7,19,21). Both insulin and leptin receptors are expressed in homeostatic brain regions, such as the hypothalamus (24,25), as well as in motivation-reward regions linked to food-related behaviors, including the substantia nigra (SN) (26–28) and ventral tegmental area (VTA) (27,28), that relay signals via dopaminergic neurons to cortical, limbic, and striatal brain regions involved in motivational and behavioral responses to rewarding food stimuli (29). In obesity, changes in these peripheral hormone levels or resistance to these hormones may have differential effects on the brain’s response to visual food cues and eating behavior (7,30,31). We previously reported that insulin resistance in obese adults is positively correlated with craving for desired favorite foods and that this relationship is statistically mediated by neural responses in the thalamus and the VTA (17). Moreover, leptin administration in patients with congenital leptin deficiency decreases activation in the caudate and nucleus accumbens (NAc), suggesting that leptin may be associated with striatal brain activation during reward processing and food motivation (20). It is not known whether obesity-related changes in endogenous insulin and leptin levels or their actions in adolescent obesity are associated with responses to visual food cues in brain circuits involved in food motivation and reward. To address this question, we used functional MRI (fMRI) to examine neural responses to high-calorie food (HCF), low-calorie food (LCF), and nonfood (NF) visual cues in a cohort of obese and lean adolescents well characterized with regard to insulin sensitivity (32), fasting insulin, and leptin levels. We hypothesized that obese compared with lean adolescents would display exaggerated responses in neural circuits that encompass sensory and somatic integration-interoception (cortical), emotion-memory (limbic), and motivation-reward (striatal) processes during exposure to HCF and LCF relative to NF pictures. We further hypothesized that obesity-related alterations in endogenous leptin, insulin levels, and insulin sensitivity would be associated with brain responses to HCF images.
Research Design and Methods
Subjects
Adolescents aged 12–17 years with a BMI >25th to <75th percentile (lean group) or BMI >95th percentile (obese group) (based on Centers for Disease Control and Prevention BMI growth charts), but otherwise healthy, were recruited from the Yale Pediatric Obesity Clinic or by local advertisement. Mean Tanner stage of pubertal development was 4.6 in the lean group and 4.1 in the obese group (P = 0.28). Exclusion criteria included chronic medical conditions, including diabetes, psychiatric disorders, pregnancy, smoking, metal in the body incompatible with MRI, or taking any medication that might affect glucose and lipid metabolism. A maintenance diet of the same percent macronutrient composition was provided to each participant by the study dietitian (M.S.), and all participants were weight stable and were asked not to participate in any strenuous physical activity for 2 weeks prior to the study. At study enrollment, we asked the adolescents to summit a 3-day food record. Similar to other studies (33), we found no statistically significant difference in reported kilocalories consumed per day between lean and obese participants (P = 0.17). The study was approved by the Yale Human Investigation Committee. All subjects provided assent, and their parents signed informed consent.
Anthropometric Measures and Frequently Sampled Oral Glucose Tolerance Test
On a day separate from the fMRI session, a frequently-sampled oral glucose tolerance test (OGTT) (details below), fasting blood draw, and anthropometric measures were performed including weight, percent fat mass, and total fat mass (measured with a Tanita Body Fat Analyzer) and height (measured with a stadiometer). At 8:00 a.m. after an overnight fast, an intravenous catheter was placed for blood samples during a 3-h frequently sampled OGTT using Glucola (dose: 1.75 gm/kg glucose, maximum dose 75 g). Plasma glucose and insulin were measured at −15, 0, 10, 20, 30, 60, 90, 120, 150, and 180 min. Glucose was measured using glucose oxidase (YSI, Yellow Springs, OH), and plasma insulin was measured using a double-antibody radioimmunoassay (Millipore). In addition, a fasting blood sample for leptin was obtained and measured by radioimmunoassay (Millipore). For assessment of insulin resistance, whole-body insulin sensitivity index (WBISI) was calculated using the following formula: WBISI = 10,000/√[(FPG × fasting plasma insulin) × (mean OGTT glucose concentration × mean OGTT insulin concentration)] (34). BMI was calculated as weight in kilograms divided by the square of height in meters. A urine pregnancy test was performed on all female subjects.
fMRI Session
Adolescents presented for the fMRI scanning day at 12:00 p.m. So that we could ensure that the adolescents were neither hungry nor full during the fMRI scanning session, 2 h prior to the fMRI they were served a standard mixed meal prepared by the Yale Center for Clinical Investigation Metabolic Kitchen consisting of a turkey sandwich, sliced apple, and milk (500 kcal). Each adolescent underwent prescanning training of the visual food (picture) task that included demonstration of the liking and wanting rating scales and completion of a block of 15 practice trials of the visual food task (described below). Two hours after completing the meal, each adolescent was acclimated in a testing room to the specific aspects of the fMRI study procedures, positioned in the MRI scanner, and underwent a 60-min fMRI session using a 3-Tesla Siemens Trio scanner (Siemens Medical Systems) with imaging parameters as previously described (35).
Visual Food (Picture) Task
The visual food (picture) task, previously validated for fMRI (35), was used in an event-related design. Briefly, a series of 126 pictures (42 HCF, e.g., ice cream, pizza; 42 LCF, e.g., salads, fruits; and 42 NF pictures, e.g., book, bicycle) were presented in random trials across six runs during the fMRI session (Fig. 1). Each run consists of 21 trials (7 HCF, 7 LCF, 7 NF) and lasted 6.4 min. Each picture was presented only once for each adolescent, and stimuli were counterbalanced across participants. Each picture appeared for 6 s, and participants were instructed to view the picture and then asked to rate their liking and wanting of the item on a 9-point Likert scale using a four-key button box. At the end of each trial, a fixation cross appeared with a jittered intertrial interval (mean 6 s [range 3–9]) during which the participants relaxed until the start of the next trial.
Figure 1.

Visual food (picture) task procedure during fMRI. A series of 126 pictures (42 HCF, e.g., ice cream, pizza; 42 LCF, e.g., salads, fruits; and 42 NF, e.g., book, bicycle) was presented in random trials across six runs during the fMRI session, with each run consisting of 21 trials (7 trials per each condition).
fMRI Data Analyses
A standard whole-brain template (Montreal Neurological Institute, 1 mm) was used for participant spacial normalization of the individual data. The Montreal Neurological Institute whole-brain template has been used in previous studies of adolescents (36–38). Participant integration and registration were carried out using the BioimageSuite software package (http://www.bioimagesuite.org/) for the images obtained for the HCF, LCF, and NF trials.
See Supplementary Data for details regarding fMRI data acquisition, preprocessing, and image registration.
Group Analyses
Composite average β-maps for both subject groups (obese and lean) were generated for each condition (HCF, LCF, NF, HCF-NF, and LCF-NF). Two-sample t tests (for unequal size groups) were used to compare each condition across groups. Data were whole-brain corrected for multiple comparisons by spatial extent of contiguous suprathresholded individual voxels at an experiment-wise P < 0.05. In a Monte Carlo simulation within the AFNI software package (39) (afni.nimh.nih.gov) and using a smoothing kernel of 6 mm and a connection radius of 6.296 mm on 3.44 mm × 3.44 mm × 4 mm voxels, it was determined that an activation volume of 130 original voxels (6,146 µL) satisfied the P < 0.05 threshold, and effect size for significant results was also calculated (Supplementary Table 1). Regions of interest (ROIs) were extracted from significant clusters observed in the whole-brain analyses that were family-wise error (FWE)-corrected P < 0.05 two-sample t tests in reference space. Larger regions containing more than one area of interest were separated into individual regions. These individual regions were warped back to individual subject space through the inverse of the transformations discussed in Supplementary Data. Mean regional generalized linear model β-weights were extracted for each subject within each region to illustrate results of the whole-brain group comparisons and correlation scatterplots.
Whole-Brain Correlation Analysis With Leptin and Insulin
Whole-brain correlation analyses were conducted within BioImageSuite that calculated the correlation value of each pixel with the individual's fasting leptin and insulin levels and WBISI. Correlation values were then converted to P values, and the AFNI AlphaSim FWE correction was applied for multiple comparison correction.
Results
Group Demographics and Metabolic Parameters
Obese adolescents (n = 25) had an average BMI of 34.4 kg/m2, BMI z score >95th percentile, average age 15.7 years, and WBISI of 2.2, and lean adolescents (n = 15) had an average BMI of 21.0 kg/m2, average age 15.5 years, and WBISI of 3.87 (Table 1). The obese group exhibited reduced insulin sensitivity (WBISI, P < 0.002) and increased fasting leptin levels (P < 0.0001) compared with the lean group (Table 1 and Supplementary Fig. 1). There were also significant differences between the two groups for fasting insulin (P < 0.001), fasting plasma glucose (P < 0.0001), and homeostasis model assessment of insulin resistance (P < 0.0001). Based on the median of the distribution of the WBISI (WBISI 50th: 1.62) in our large cohort of adolescents previously reported (40), the obese adolescents were further categorized as insulin resistant (IR) or insulin sensitive (IS): 14 were obese-IR, and 11 were obese-IS. One lean adolescent was left-handed, and two obese adolescents were left-handed.
Table 1.
Demographic and metabolic measures
| Lean | Obese | P | |
|---|---|---|---|
| N | 15 | 25 | |
| Sex, % male (male/female) | 67 (10/5) | 40 (10/15) | 0.191‡ |
| Race, AA/C/H | 5/5/5 | 9/8/8 | 0.985‡‡ |
| Age at fMRI (years) | 15.50 ± 1.38 | 15.69 ± 1.77 | 0.712 |
| Height (cm) | 169.60 ± 10.28 | 165.28 ± 9.99 | 0.198 |
| Weight (kg) | 60.43 ± 8.91 | 93.64 ± 12.84 | 0.0001 |
| BMI (kg/m2) | 20.96 ± 1.87 | 34.41 ± 4.81 | 0.0001 |
| BMI z score | 0.21 ± 0.46 | 2.19 ± 0.34 | 0.0001 |
| % body fat | 17.50 ± 6.28 | 42.33 ± 6.60 | 0.0001 |
| Fasting leptin (ng/mL) | 4.82 ± 3.66 | 38.96 ± 17.17 | 0.0001 |
| Fasting insulin (μU/mL) | 15.67 ± 8.71 | 32.98 ± 15.03 | 0.0001 |
| Fasting glucose (mg/dL) | 82.83 ± 4.90 | 89.35 ± 3.89 | 0.0001 |
| WBISI | 3.87 ± 1.43 | 2.20 ± 1.49 | 0.002 |
| HOMA-IR | 3.20 ± 1.69 | 7.32 ± 3.47 | 0.0001 |
Data are means ± SD unless otherwise indicated. Independent-sample t test. Bold P values indicate significant difference between the lean and obese groups. AA, African American; C, Caucasian (non-Hispanic white); H, Hispanic; HOMA-IR, homeostasis model assessment of insulin resistance.
‡Fisher test.
‡‡χ2.
Behavioral Response: Wanting and Liking
There were statistically significant differences in wanting and liking responses (P < 0.01) between visual stimulus conditions, with both groups wanting and liking HCF the most and NF the least. No significant differences were seen between the two adolescent groups in liking or wanting of each food type (Supplementary Fig. 2).
Brain Responses to HCF, LCF, and NF Visual Images in Obese and Lean Groups
Whole-brain responses of obese compared with lean subjects in the HCF versus NF brain images revealed markedly greater neural responses in the striatal (NAc, caudate, and putamen), limbic (amygdala, hypothalamus, and thalamus), and cortical (anterior/posterior insula and posterior parietal cortical region) regions at moderate-to-large effect sizes in the range of 0.49–0.59 (Fig. 2) (P < 0.05, whole-brain corrected) (Supplementary Table 1). Brain responses of obese compared with lean in the LCF versus NF brain maps also showed greater activation in striatal (caudate, VTA/SN) and limbic (thalamus, hippocampus, hypothalamus) regions but in fewer regions of the striatal-limbic network, with effect size ranging from 0.48 to 0.51 (Supplementary Fig. 3 and Supplementary Table 1). We conducted secondary analyses covarying for sex, age, and race and found the results to be largely the same; the amygdala and insula were no longer statistically significant, but all other regions remained significant (Supplementary Fig. 4). There was also no significant effect of Tanner stage of pubertal development on brain activation in regions responding to HCF versus NF.
Figure 2.

Neural response differences in cue condition contrasts. Axial brain slices of neural activation differences in HCF versus NF in obese (A), lean (B), and obese compared with lean (C) adolescents (threshold of P < 0.05, FWE corrected). Obese versus lean individuals show increased activation in the amygdala, ventral striatum, hypothalamus, thalamus, caudate, putamen, and insula. The color scale provides t values of the functional activity. Talairach z levels indicated. IFG, inferior frontal gyrus; IPL, inferior parietal lobe; L, left; R, right.
Within each group, the whole-brain comparisons between conditions HCF versus NF showed that the obese adolescents demonstrated increased activation in visual and striatal-limbic regions (amygdala, caudate, thalamus, insula), whereas the lean group showed increased activation in visual regions and decreased activation in the putamen, insula, and parahippocampus (Fig. 2 and Supplementary Table 1). Within each group, the whole-brain comparisons between conditions for LCF versus NF showed that obese adolescents demonstrated increased activation in the caudate, insula, thalamus, VTA/SN, and amygdala, whereas the lean adolescents demonstrated decreased activation in the fusiform gyrus, posterior cingulate, and parahippocampus. In condition contrast brain maps of HCF versus LCF, both obese and lean adolescents demonstrated increased activation in the hippocampus, parahippocampus, and fusiform gyrus. Additionally, obese adolescents exhibited increased activation in the amygdala and lean adolescents had increased activation in the hypothalamus, but there was no statistically significant difference when we compared these responses in the obese versus lean contrast map (Supplementary Table 1).
Effects of Insulin Resistance
Subgroup analysis revealed that the obese-IR and obese-IS were not significantly different in whole-brain comparisons of HCF versus NF or LCF versus NF brain maps. To illustrate the similarities between obese-IR and obese-IS subgroups, we extracted the blood oxygen level–dependent (BOLD) signal (β-weights) from the significant ROIs shown in Fig. 2C (obese vs. lean HCF vs. NF brain maps) and found that both subgroups exhibited similar increases in activation in each of the ROIs (P = ns), whereas in lean adolescents the BOLD signal response was significantly reduced compared with the obese-IR and the obese-IS adolescents (Supplementary Fig. 5).
Whole-Brain Correlation With Leptin, Insulin, and Fat Mass
For examination of the relationship between neural response and metabolic factors, correlations between neural responses in the HCF versus NF and the LCF versus NF brain maps and fasting leptin and insulin levels were analyzed and WBISI was performed. Greater BOLD signal response to HCF relative to NF was significantly correlated with higher plasma leptin levels in the hypothalamus, putamen, caudate, thalamus, amygdala, hippocampus, parahippocampus, posterior cingulate, angular gyrus, and anterior and posterior insula (P < 0.05, FWE corrected) (Fig. 3 and Supplementary Table 2).
Figure 3.
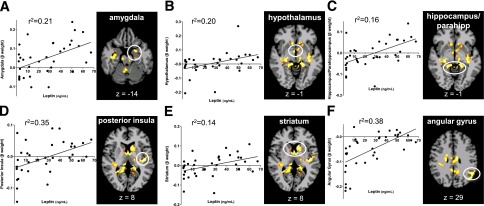
Whole-brain, voxel-based correlation analyses with leptin. Scatterplot shows the correlation between neural activation (β-weights) (HCF vs. NF) and fasting leptin in all subjects in ROIs and brain maps of correlation regions: amygdala (A), hypothalamus (B), hippocampus/parahippocampus (C), posterior insula (D), striatum (E), and angular gyrus (F) (P < 0.05, FWE corrected). β-Weight values are depicted on the x-axis.
Because leptin levels may differ depending on pubertal stage of development, in secondary analyses we examined whether Tanner stage correlated with neural activation in the brain (ROI) regions that correlated with leptin as shown in Fig. 3. Brain regions that correlated with leptin did not correlate with Tanner stage, except in the posterior cingulate; thus, the correlation with leptin and neural activation in the posterior cingulate was no long significant after controlling for Tanner stage. No correlation was found with neural response to LCF with leptin that met whole-brain correction.
To examine whether fat mass was playing a role in the correlations with leptin, we conducted secondary analyses examining whole-brain correlations of leptin/fat mass with neural activation with HCF versus NF in all subjects. The regions correlating with leptin/fat mass remained largely the same as those correlating with leptin alone and in addition also included the anterior cingulate cortex and right amygdala. We also conducted whole-brain correlation with the same condition contrast maps with percent fat mass and found that percent fat mass was not correlated with neural activation to HCF versus NF. Additionally, there were no significant correlations of fasting insulin or WBISI with neural responses to HCF versus NF and LCF versus NF brain maps that met whole-brain correction.
Conclusions
In this study, obese adolescents displayed exaggerated neural responses in reward-motivation (striatal) and emotion (limbic) pathways upon exposure to HCF versus NF images as well as LC relative to NF images, suggesting that they are more responsive in brain emotion and reward-motivation regions than lean adolescents to visual food stimuli, such as those commonly depicted in food advertising. Notably, this is the first study to show that neural responses were correlated with endogenous leptin levels in every region of increased activation identified in the HCF versus NF group contrast map, suggesting that increased leptin levels, possibly due to leptin resistance or altered leptin signaling, contribute to the exaggerated brain responses in motivation-reward pathways to HCF and, in turn, increase the risk of overconsumption of HCF in obese adolescents. These results are particularly concerning given that obese children/adolescents with prediabetes can progress to develop diabetes rapidly, in just 21 months (5), and are then faced with limited and relatively ineffective treatment options for T2D (6).
Circulating leptin is generated in adipose tissue and delivered to the central nervous system, where it acts via leptin receptors to regulate feeding behavior (19). Leptin receptors are located in many hypothalamic nuclei (25) that when activated stimulate the Janus kinase–signal transducer and activator of transcription pathway, suppressing neuropeptide Y and agouti-related protein and regulating food intake (41). However, in the context of increased adiposity and chronically high leptin, leptin receptors may be vulnerable to desensitization that may contribute to central leptin resistance. Thus, desensitizing of leptin receptors and/or central leptin resistance may reduce satiety signaling, thereby maintaining brain signaling of food motivation. Leptin receptors have also been identified in the SN (26–28) and VTA (27,28) as well as the hippocampus, cortex, and midbrain (26). However, leptin’s role in these brain regions has not been definitively clarified. Acute exogenous leptin administration in patients with congenital leptin deficiency decreases activation in the NAc and caudate, suggesting that leptin plays a role in reducing brain reward and motivation signals in the ventral and dorsal striatum (20). The current data correlating increased endogenous leptin with greater neural activation in striatal regions in adolescents are consistent with the view of aberrant satiety signaling in the context of high leptin. It is intriguing to speculate that leptin resistance, or altered leptin signaling, may reduce satiety signaling in these brain regions of obese children, thereby contributing to hyperactivation of reward-motivation regions to food, and increasing risk of rewarding/desired HCF food intake. Alternatively, as the groups were given a standard lunch meal, not adjusted for body weight, it is possible that the obese group was not satiated, and this may have contributed to exaggerated emotion and reward responses in the obese compared with the lean group. Other regions that correlated with leptin levels included the insula, implicated in gustatory signaling and interoception (42); the thalamus, important for relaying of peripheral sensory information to the cortex (43); the angular gyrus, important for giving meaning to multisensory information (44) and responsive to hunger/satiety and food cues (45,46); and the hippocampus and parahippocampus, implicated in memory coding and context of a given stimuli (47). Although leptin receptors have not been identified in these specific brain regions, leptin might affect these neural pathways by way of downstream signaling from other limbic-striatal regions.
Since insulin is ubiquitous in the brain and its receptors are present in many neural regions including the hypothalamus (24), striatum, hippocampus, amygdala, thalamus (48), ventral tegmental area (27), and cerebral cortex (including the prefrontal cortex) (48), we examined the influence of fasting insulin levels and insulin resistance on neural responses. Unlike previous findings reported in adults (17), we found no association between peripheral insulin levels and brain motivation-reward responses to food images. Although previous studies in adults have also suggested that insulin resistance may be an important factor contributing to altered responses to food in motivation-reward pathways (17,49), in our cohort of adolescents neural responses in the obese-IR and obese-IS groups were indistinguishable (Supplementary Fig. 5). This difference between adults and adolescents may be due to the younger age of our subject cohort, the relatively shorter duration of obesity (compared with adults), or disparate changes in insulin blood-brain-barrier transport (50,51).
It is noteworthy that although there were striking differences in neural responses in reward-motivation (striatal) and emotion (limbic) pathways, there was no statistically significant difference in liking and wanting ratings between the obese and lean adolescents. Surprisingly, we also found no significant correlations between prefrontal brain response to HCF versus NF and liking and wanting ratings. Thus, the way the brain responds to images of food was different between the two groups, but subjectively the adolescents reported similar desire for food regardless of BMI. We speculate that the subjective rating may be influenced by expected social and cultural norms, which are under conscious control, whereas neural responses in reward-motivation and emotion-regulating regions are for the most part not under conscious control. Future research could benefit from assessing potential altered prefrontal cortex responses in adolescent obesity using alternative neuroimaging paradigms. Nonetheless, the current results suggest that obese compared with lean adolescents may be particularly vulnerable to increase food intake when confronting visual food stimuli, such as in food-related advertising, as shown in previous work (14,15).
The current findings may have significant implications for public health. In an environment inundated with advertising promoting consumption of HCF (13), children may be more vulnerable to such cues, as their brains, particularly prefrontal cortices involved in inhibiting and regulating desires and emotions, are not fully developed (52). Reversing such changes before they become chronic may be vital in preventing progression to T2D from obesity. Preclinical studies have shown that leptin resistance may occur rapidly but may also be reversed quickly (53). Rats fed ad libitum chow, sucrose, and lard ate more and developed peripheral and central leptin resistance within 16 days (53), whereas when the sucrose and lard were removed, food intake markedly decreased and leptin resistance rapidly reversed resulting in fat loss (53). Thus, altering diet for a relatively short period could conceivably be more beneficial in the early stages of childhood obesity. Perhaps promoting interventions to reverse leptin resistance may be helpful in reversing neuroendocrine dysregulation associated with adolescent obesity, thus helping to prevent progression to T2D.
Limitations of this clinical study include lack of assessment of the influence of socioeconomic status and the larger number of boys in the lean group and girls in the obese group. Although the sex differences were not statistically significant, sex effects on hormones, such as leptin and menstrual cycle phase, may have influenced our results. It is possible that the isocaloric meal provided to obese adolescents was inadequate, which may in turn have led to a greater effect on motivation brain regions. However, the hunger ratings did not differ between the two groups prior to or after the scanning session, suggesting adequate meal quantity for each group. Of note, we specifically chose to study participants in a partially satiated state; had they been fasting, neural responses would likely have been different. Furthermore, while we show neural changes and relate them to obesity-related biology, it is important to note that this is a cross-sectional study and behavioral measures of food intake were not obtained during the scanning day. Future studies would benefit from linking neural changes to food cue –induced ad libitum eating and follow-up measures of food intake. Despite these caveats and limitations, we show striking differences observed between the obese and lean groups, with robust effect sizes observed in the whole-brain analyses.
In summary, our data suggest that obese adolescents exhibit exaggerated neural responses in striatal-limbic regions to images of HCFs that are associated with circulating leptin elevations. Dysregulation of brain regions influencing reward motivation and emotion may increase the drive to eat HCFs and decrease control over consumption of such foods, particularly in obese adolescents who may be particularly vulnerable to food cues. Given the significant rise in childhood T2D and the limited and relatively ineffective treatment options (6), these findings underscore the critical need for better understanding of the pathophysiological factors that may contribute to dysregulated neural control of eating, thereby perpetuating obesity and predisposing adolescents to prediabetes and rapid progression to T2D.
Supplementary Material
Article Information
Funding. This work was supported by National Institutes of Health (NIH) grant 1R01DK085577-01 (principal investigator [PI]: S.C., co-PIs: R.S.S. and R.S.), Diabetes Research Center P30-DK045735, R37-DK20495, RO1-DK099039, the NIH Roadmap for Medical Research Common Fund grants UL1-DE019586, Clinical and Translational Science Award UL1-RR024139 (PI: R.S.S.), K12DK094714-02 (PI: W. Tamborlane, Yale University School of Medicine, New Haven, CT), an Endocrine Fellows Foundation grant, and the Yale Center for Clinical Investigation.
Duality of Interest. A.M.J. provided assistance to Atrium Staffing for the New Haven Pfizer Clinical Research Unit. R.S.S. consulted or served on data safety monitoring boards within the last year for Bristol-Myers Squibb, Janssen, Lilly, Novo Nordisk, MannKind, Merck, and Novartis. No other potential conflicts of interest relevant to this article were reported.
Author Contributions. A.M.J. conducted data analysis, contributed to interpretation of data, and wrote the manuscript. C.L. conducted data analysis. D.S. was responsible for the fMRI task design. J.K., C.G., and M.S. were responsible for data collection. M.A.V.N. conducted data analysis. R.T.C. contributed to interpretation of data. R.S.S. was responsible for the study design and funding, contributed to interpretation of data, and wrote the manuscript. S.C. was responsible for the study design and funding and for data collection, contributed to interpretation of data, and wrote the manuscript. R.S. was responsible for the study design and funding, for the fMRI task design, and for data collection; contributed to the interpretation of data; and wrote the manuscript. S.C. and R.S. are the guarantors of this work and, as such, had full access to all the data in the study and take responsibility for the integrity of the data and the accuracy of the data analysis.
Prior Presentation. Parts of this study were presented in abstract form at the 73rd Scientific Sessions of the American Diabetes Association, Chicago, IL, 21–25 June 2013.
Footnotes
Clinical trial reg. no. NCT01808846, clinicaltrials.gov.
This article contains Supplementary Data online at http://care.diabetesjournals.org/lookup/suppl/doi:10.2337/dc14-0525/-/DC1.
A slide set summarizing this article is available online.
S.C. and R.S. contributed equally and served as joint senior authors.
References
- 1.Ogden CL, Carroll MD, Curtin LR, Lamb MM, Flegal KM. Prevalence of high body mass index in US children and adolescents, 2007-2008. JAMA 2010;303:242–249 [DOI] [PubMed] [Google Scholar]
- 2.Weiss R, Dziura J, Burgert TS, et al. Obesity and the metabolic syndrome in children and adolescents. N Engl J Med 2004;350:2362–2374 [DOI] [PubMed] [Google Scholar]
- 3.Williams DE, Cadwell BL, Cheng YJ, et al. Prevalence of impaired fasting glucose and its relationship with cardiovascular disease risk factors in US adolescents, 1999-2000. Pediatrics 2005;116:1122–1126 [DOI] [PubMed] [Google Scholar]
- 4.May AL, Kuklina EV, Yoon PW. Prevalence of cardiovascular disease risk factors among US adolescents, 1999-2008. Pediatrics 2012;129:1035–1041 [DOI] [PubMed] [Google Scholar]
- 5.D’Adamo E, Caprio S. Type 2 diabetes in youth: epidemiology and pathophysiology. Diabetes Care 2011;34(Suppl. 2):S161–S165 [DOI] [PMC free article] [PubMed] [Google Scholar]
- 6.Zeitler P, Hirst K, Pyle L, et al. TODAY Study Group . A clinical trial to maintain glycemic control in youth with type 2 diabetes. N Engl J Med 2012;366:2247–2256 [DOI] [PMC free article] [PubMed] [Google Scholar]
- 7.Schwartz MW, Woods SC, Porte D, Jr, Seeley RJ, Baskin DG. Central nervous system control of food intake. Nature 2000;404:661–671 [DOI] [PubMed] [Google Scholar]
- 8.Figlewicz DP, Woods SC. Adiposity signals and brain reward mechanisms. Trends Pharmacol Sci 2000;21:235–236 [DOI] [PubMed] [Google Scholar]
- 9.Carnell S, Gibson C, Benson L, Ochner CN, Geliebter A. Neuroimaging and obesity: current knowledge and future directions. Obes Rev 2012;13:43–56 [DOI] [PMC free article] [PubMed] [Google Scholar]
- 10.Wang GJ, Volkow ND, Logan J, et al. Brain dopamine and obesity. Lancet 2001;357:354–357 [DOI] [PubMed] [Google Scholar]
- 11.Martin LE, Holsen LM, Chambers RJ, et al. Neural mechanisms associated with food motivation in obese and healthy weight adults. Obesity (Silver Spring) 2010;18:254–260 [DOI] [PubMed] [Google Scholar]
- 12.Simmons WK, Martin A, Barsalou LW. Pictures of appetizing foods activate gustatory cortices for taste and reward. Cereb Cortex 2005;15:1602–1608 [DOI] [PubMed] [Google Scholar]
- 13.Brownell KD, Horgen KB. Food Fight: The Inside Story of the Food Industry, America's Obesity Crisis, and What We Can Do About It. Chicago, Contemporary Books, 2004 [Google Scholar]
- 14.Halford JC, Boyland EJ, Hughes G, Oliveira LP, Dovey TM. Beyond-brand effect of television (TV) food advertisements/commercials on caloric intake and food choice of 5-7-year-old children. Appetite 2007;49:263–267 [DOI] [PubMed] [Google Scholar]
- 15.Halford JC, Gillespie J, Brown V, Pontin EE, Dovey TM. Effect of television advertisements for foods on food consumption in children. Appetite 2004;42:221–225 [DOI] [PubMed] [Google Scholar]
- 16.Lobstein T, Dibb S. Evidence of a possible link between obesogenic food advertising and child overweight. Obes Rev 2005;6:203–208 [DOI] [PubMed] [Google Scholar]
- 17.Jastreboff AM, Sinha R, Lacadie C, Small DM, Sherwin RS, Potenza MN. Neural correlates of stress- and food cue-induced food craving in obesity: association with insulin levels. Diabetes Care 2013;36:394–402 [DOI] [PMC free article] [PubMed] [Google Scholar]
- 18.Bruce AS, Lepping RJ, Bruce JM, et al. Brain responses to food logos in obese and healthy weight children. J Pediatr 2013;162:759–764.e2 [DOI] [PubMed]
- 19.Gautron L, Elmquist JK. Sixteen years and counting: an update on leptin in energy balance. J Clin Invest 2011;121:2087–2093 [DOI] [PMC free article] [PubMed] [Google Scholar]
- 20.Farooqi IS, Bullmore E, Keogh J, Gillard J, O’Rahilly S, Fletcher PC. Leptin regulates striatal regions and human eating behavior. Science 2007;317:1355. [DOI] [PMC free article] [PubMed] [Google Scholar]
- 21.Plum L, Belgardt BF, Brüning JC. Central insulin action in energy and glucose homeostasis. J Clin Invest 2006;116:1761–1766 [DOI] [PMC free article] [PubMed] [Google Scholar]
- 22.Jauch-Chara K, Friedrich A, Rezmer M, et al. Intranasal insulin suppresses food intake via enhancement of brain energy levels in humans. Diabetes 2012;61:2261–2268 [DOI] [PMC free article] [PubMed] [Google Scholar]
- 23.Hallschmid M, Benedict C, Schultes B, Fehm HL, Born J, Kern W. Intranasal insulin reduces body fat in men but not in women. Diabetes 2004;53:3024–3029 [DOI] [PubMed] [Google Scholar]
- 24.Schwartz MW. Biomedicine. Staying slim with insulin in mind. Science 2000;289:2066–2067 [DOI] [PubMed] [Google Scholar]
- 25.Friedman JM, Halaas JL. Leptin and the regulation of body weight in mammals. Nature 1998;395:763–770 [DOI] [PubMed] [Google Scholar]
- 26.Elmquist JK, Bjørbaek C, Ahima RS, Flier JS, Saper CB. Distributions of leptin receptor mRNA isoforms in the rat brain. J Comp Neurol 1998;395:535–547 [PubMed] [Google Scholar]
- 27.Figlewicz DP, Evans SB, Murphy J, Hoen M, Baskin DG. Expression of receptors for insulin and leptin in the ventral tegmental area/substantia nigra (VTA/SN) of the rat. Brain Res 2003;964:107–115 [DOI] [PubMed] [Google Scholar]
- 28.Hommel JD, Trinko R, Sears RM, et al. Leptin receptor signaling in midbrain dopamine neurons regulates feeding. Neuron 2006;51:801–810 [DOI] [PubMed] [Google Scholar]
- 29.Redgrave P, Coizet V. Brainstem interactions with the basal ganglia. Parkinsonism Relat Disord 2007;13(Suppl. 3):S301–S305 [DOI] [PubMed] [Google Scholar]
- 30.Malik S, McGlone F, Bedrossian D, Dagher A. Ghrelin modulates brain activity in areas that control appetitive behavior. Cell Metab 2008;7:400–409 [DOI] [PubMed] [Google Scholar]
- 31.Batterham RL, ffytche DH, Rosenthal JM, et al. PYY modulation of cortical and hypothalamic brain areas predicts feeding behaviour in humans. Nature 2007;450:106–109 [DOI] [PubMed] [Google Scholar]
- 32.Breda E, Cavaghan MK, Toffolo G, Polonsky KS, Cobelli C. Oral glucose tolerance test minimal model indexes of beta-cell function and insulin sensitivity. Diabetes 2001;50:150–158 [DOI] [PubMed] [Google Scholar]
- 33.Fisher JO, Johnson RK, Lindquist C, Birch LL, Goran MI. Influence of body composition on the accuracy of reported energy intake in children. Obes Res 2000;8:597–603 [DOI] [PubMed] [Google Scholar]
- 34.Matsuda M, DeFronzo RA. Insulin sensitivity indices obtained from oral glucose tolerance testing: comparison with the euglycemic insulin clamp. Diabetes Care 1999;22:1462–1470 [DOI] [PubMed] [Google Scholar]
- 35.Page KA, Seo D, Belfort-DeAguiar R, et al. Circulating glucose levels modulate neural control of desire for high-calorie foods in humans. J Clin Invest 2011;121:4161–4169 [DOI] [PMC free article] [PubMed] [Google Scholar]
- 36.Hommer RE, Seo D, Lacadie CM, et al. Neural correlates of stress and favorite-food cue exposure in adolescents: a functional magnetic resonance imaging study. Hum Brain Mapp 2013;34:2561–2573 [DOI] [PMC free article] [PubMed] [Google Scholar]
- 37.Lubsen J, Vohr B, Myers E, et al. Microstructural and functional connectivity in the developing preterm brain. Semin Perinatol 2011;35:34–43 [DOI] [PMC free article] [PubMed] [Google Scholar]
- 38.Myers EH, Hampson M, Vohr B, et al. Functional connectivity to a right hemisphere language center in prematurely born adolescents. Neuroimage 2010;51:1445–1452 [DOI] [PMC free article] [PubMed] [Google Scholar]
- 39.Cox RW. AFNI: software for analysis and visualization of functional magnetic resonance neuroimages. Comput Biomed Res 1996;29:162–173 [DOI] [PubMed] [Google Scholar]
- 40.Giannini C, Weiss R, Cali A, et al. Evidence for early defects in insulin sensitivity and secretion before the onset of glucose dysregulation in obese youths: a longitudinal study. Diabetes 2012;61:606–614 [DOI] [PMC free article] [PubMed] [Google Scholar]
- 41.Ahima RS. Revisiting leptin’s role in obesity and weight loss. J Clin Invest 2008;118:2380–2383 [DOI] [PMC free article] [PubMed] [Google Scholar]
- 42.Simon SA, de Araujo IE, Gutierrez R, Nicolelis MA. The neural mechanisms of gustation: a distributed processing code. Nat Rev Neurosci 2006;7:890–901 [DOI] [PubMed] [Google Scholar]
- 43.Sherman SM. The thalamus is more than just a relay. Curr Opin Neurobiol 2007;17:417–422 [DOI] [PMC free article] [PubMed] [Google Scholar]
- 44.Seghier ML. The angular gyrus: multiple functions and multiple subdivisions. Neuroscientist 2013;19:43–61 [DOI] [PMC free article] [PubMed]
- 45.Gautier JF, Del Parigi A, Chen K, et al. Effect of satiation on brain activity in obese and lean women. Obes Res 2001;9:676–684 [DOI] [PubMed] [Google Scholar]
- 46.Tataranni PA, Gautier JF, Chen K, et al. Neuroanatomical correlates of hunger and satiation in humans using positron emission tomography. Proc Natl Acad Sci USA 1999;96:4569–4574 [DOI] [PMC free article] [PubMed] [Google Scholar]
- 47.Burgess N, Maguire EA, O’Keefe J. The human hippocampus and spatial and episodic memory. Neuron 2002;35:625–641 [DOI] [PubMed] [Google Scholar]
- 48.Havrankova J, Roth J, Brownstein M. Insulin receptors are widely distributed in the central nervous system of the rat. Nature 1978;272:827–829 [DOI] [PubMed] [Google Scholar]
- 49.Anthony K, Reed LJ, Dunn JT, et al. Attenuation of insulin-evoked responses in brain networks controlling appetite and reward in insulin resistance: the cerebral basis for impaired control of food intake in metabolic syndrome? Diabetes 2006;55:2986–2992 [DOI] [PubMed] [Google Scholar]
- 50.Pagotto U. Where does insulin resistance start? The brain. Diabetes Care 2009;32(Suppl. 2):S174–S177 [DOI] [PMC free article] [PubMed] [Google Scholar]
- 51.Woods SC, Seeley RJ, Baskin DG, Schwartz MW. Insulin and the blood-brain barrier. Curr Pharm Des 2003;9:795–800 [DOI] [PubMed] [Google Scholar]
- 52.Casey BJ, Jones RM. Neurobiology of the adolescent brain and behavior: implications for substance use disorders. J Am Acad Child Adolesc Psychiatry 2010;49:1189–1201; quiz 1285 [DOI] [PMC free article] [PubMed] [Google Scholar]
- 53.Apolzan JW, Harris RB. Rapid onset and reversal of peripheral and central leptin resistance in rats offered chow, sucrose solution, and lard. Appetite 2013;60:65–73 [DOI] [PMC free article] [PubMed] [Google Scholar]
Associated Data
This section collects any data citations, data availability statements, or supplementary materials included in this article.