

Abstract
Mass spectrometry based glycoproteomics has become a major means of identifying and characterizing previously N-linked glycan attached loci (glycosites). In the bottom-up approach, several factors which include but not limited to sample preparation, mass spectrometry analyses, and protein sequence database searches result in previously N-linked peptide spectrum matches (PSMs) of varying lengths. Given that multiple PSM scan map to a glycosite, we reason that identified PSMs are varying length peptide species of a unique set of glycosites. Because associated spectra of these PSMs are typically summed separately, true glycosite associated spectra counts are lost or complicated. Also, these varying length peptide species complicate protein inference as smaller sized peptide sequences are more likely to map to more proteins than larger sized peptides or actual glycosite sequences. Here, we present XGlycScan. XGlycScan maps varying length peptide species to glycosites to facilitate an accurate quantification of glycosite associated spectra counts. We observed that this reduced the variability in reported identifications of mass spectrometry technical replicates of our sample dataset. We also observed that mapping identified peptides to glycosites provided an assessment of search-engine identification. Inherently, XGlycScan reported glycosites reduce the complexity in protein inference. We implemented XGlycScan in the platform independent Java programing language and have made it available as open source. XGlycScan's source code is freely available at https://bitbucket.org/paiyetan/xglycscan/src and its compiled binaries and documentation can be freely downloaded at https://bitbucket.org/paiyetan/xglycscan/downloads. The graphical user interface version can also be found at https://bitbucket.org/paiyetan/xglycscangui/src and https://bitbucket.org/paiyetan/xglycscangui/downloads respectively.
Keywords: Bioinformatics, Peptide, Glycopeptide, Glycosite, Protein identification, Proteomics, Quality assessment
Introduction
Glycoproteins play major roles in many biological systems1-4. They are synthesized as products of the cotranslational and posttranslational modification processes known as glycosylation5. Of the major glycosylation processes observed in humans, the N-linked type is the most predominant5. N-linked glycosylation is the transfer of oligosaccharides onto an Asparagine (N) residue in an N-x-[ST] sequence motif of nascent polypeptides6. Characterizing the sequences of these polypeptides (or peptides), glycopeptides, and glycoproteins in complex biological mixtures has evolved to primarily entail shotgun approaches7-13. This involves, but not limited to, sample preparation, mass spectrometry, protein database search, and protein inference14. The shotgun approach is of the premise that the presence of a protein in a complex biological mixture can be inferred from mass spectrometry identified peptide sequences. The effects of these processes in addition to physicochemical properties of peptides and proteins on reported identifications are well noted and documented. As a significant consequence, Peptide Spectrum Matches (PSMs) of varying length about specific glycosites are typically reported as identified. Given the fact that varying length PSM species map to a glycosite, we reason that identified PSMs are peptide species of a unique set of glycosites. With multiple peptides of varying length mapping to a glycosite is the fact that the actual spectra count of such a glycosite is distributed across these peptide species (Figure 1Aii). This complicates true quantification of referenced glycosite. Also, with varying length peptide species of a glycosite is the attending increase in the number of possibly mapped proteins. This as well complicates protein inference15,16 (Figure 1B).
Figure 1.
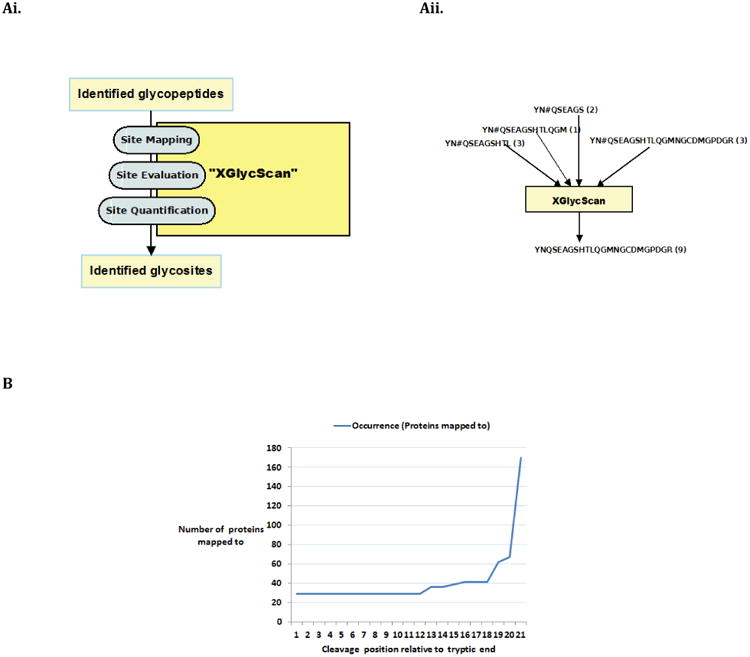
(A) i. The core sequential steps in XGlycScan. Filtered mass spectrometry Peptide Spectrum Matches (glycopeptides) are mapped to putative N-linked glycosites of database searched. These glycosite mapped peptides are evaluated to select a best representation of mapped loci. And, true site quantification (in terms of spectra count) is then re-computed.
II. An illustration of the distribution of associated spectra counts of a putative N-linked glycosite YNQSEAGSHTLQGMNGCDMGPDGR. In a typical database search identification and spectra count estimation, the true quantification of this glycosite may be complicated as it is distributed among site-mapped reported varying length peptide species (YN#QSEAGSHTL – 3, YN#QSEAGSHTLQGM – 1, YN#QSEAGS – 2, and YN#QSEAGSHTLQGMNGCDMGPDGR – 3). XGlycScan associates or maps these PSMs to the glycosite, evaluates these PSMs for the best representation of the glycosite, and re-computes an actual spectra count to derive YNQSEAGSHTLQGMNGCDMGPDGR with a true spectra count of 9 (3 + 1 + 2 + 3). The # sign denotes previously attached N-glycan site.
(B) Line plot of number of mapped proteins as a function of peptide length. The Figure shows the number of proteins to which possible digest products of an HLA Class I Histocompatibility antigen, alpha Chain glycosite (YN#QSEAGSHTLQGMNGCDMGPDGR) maps. The x-axis indicates the theoretical enzyme cleavage position relative to the canonical downstream tryptic cleavage site. The y-axis indicates the number of proteins to which derived peptide sequences map to. This shows that the number of database (NCBI, RefSeq) proteins to which digest peptides map can vary by many orders of magnitude depending on the length. With increase in possible proteins is the associated increase in the complexity of a correct protein inference.
XGlycScan focuses on the identified peptide sequences of attached glycans as opposed to other yet inadequate tools for automated glycopeptide analysis17. Many of these predominantly focus on the structural composition of attached glycans17-27. Although some others tend to characterize the peptide sequence with attach glycans together28-44, very few to none of these tools describe glycopeptide sequences (which typically are peptide species of varying lengths) within the context of ‘peptide species of a set of unique glycosites’.
XGlycScan Implementation
We first introduced a concept of XGlycScan in Unipep45 as non-redundant N-linked glycopeptide generation. Here, we present XGlycScan as a platform independent, open-source, and freely available (recommended attributes of an ideal automated glycopeptide analysis tool17) analytical tool to resolve the glycosites to which mass spectrometry identified PSMs map and to accurately quantify the abundance of such.
Algorithmically, for every input mzIdentML46 peptide identification report file,
XGlycScan computes the false discovery rate, FDR of identified PSMs using Elias and Gygi's method47;
At user specified filtering FDR, XGlyScan filters PSMs.
Filtered PSMs (that is, PSMs that pass specified cutoff) are mapped to protein sequence database reference glycosites.
- XGlycScan evaluates all PSMs mapped to a glycosite for a PSM that best represent the referenced locus (Figure 1Ai). Glycosite-mapped-PSMs are evaluated based on:
- number of tryptic ends,
- number of missed cleavages, and
- user specified PSM scoring metric which by default in this implementation is the SEQUEST XCorr48.
Thereafter, XGlycScan computes a true spectra count of mapped glycosites (Figure 1Aii) and other computations as described below.
We have used SEQUEST XCorr in this implementation of XGlycScan as a place-holder for one of the many possible scoring metric options we plan to incorporate with subsequent software iteration. In anticipation of foreseen situations where input mzIdentML files are generated from different search engines, we did implement the Elias and Gygi's FDR computation to provide a uniform method for FDR estimation across input files. However, to allow for some flexibility, users are presented with an option of specifying whether to compute FDR or not on input PSM identifications. We shall possibly consider presenting the option of using the specific search-engine derived FDR or not in subsequent software iteration. XGlycScan's computation results are reported in the “xGlycscan.tables” sub-directory in a user specified output location. These include:
spectraCount.matrix: In this tab-delimited file is reported the re-computed and actual spectra count for mapped glycosites in each input file. The rows in this spectra count table represent unique glycosites identified and the columns represent individual input file.
identification.indeces: Within this tab-delimited file is reported the total (Identified peptides) and unique (Unique peptides) number of peptide spectrum matches; total (Identified glycosites) and unique (Unique glycosites) glycosites for each input file. The specificity of identification in each input file is also reported in this file. By mapping back to reference glycosites, XGlycScan performs a quality assurance function as unsuccessfully mapped PSMs reported by database search-engine should raise the suspicion of spurious peptide to spectrum assignments or questionable antecedent processes. XGlycScan defines its search engine identified PSM quality metric (specificity) as a function of the ratio of mapped glycosites to total PSMs reported (Figure 2D) from database searches.
identification.coef: Within this tab-delimited file is reported the number of glycosites unique to each input file and the ratio of this to the total unique glycosites identified in all input files.
iDOverlapCount.matrix: In this tab-delimited square matrix file is reported the number of glycosites found in common in absolute number for all possible pair-wise comparison of input files.
iDOverlapPercent.matrix: Similar to the iDOverlapCount.matrix, in this tab-delimited square matrix file is reported all possible pair-wise comparison of input files. Herein is reported the number of glycosites found in common as a percentage of unique glycosites' union between the paired inputs.
Figure 2.
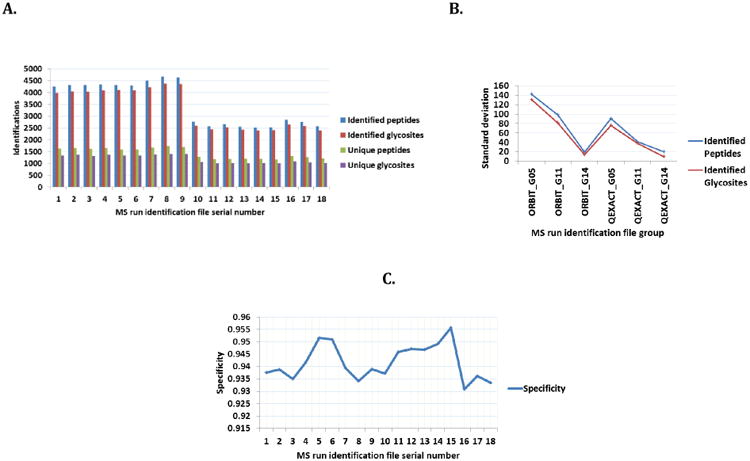
(A) Bar-chart of identifications.
Identified peptides (blue), identified glycosites (red), unique peptides (green), unique glycosites (purple). Identified peptides are total peptide spectrum matches, PSMs identified in an MSMS run passing user-specified filtering threshold. This defaults to less than or equal to 0.01, false discovery rate, FDR. Identified glycosites are total PSMs matching to predefined N-linked glycan attached loci (glycosite). Unique peptides and glycosites are as the names imply.
(B) Line plot of technical replicates identification variances.
There is observed a consistently lesser variation in glycosite quantitation within technical replicates than that observed in peptide (PSM) quantitation.
(C) Line plot of XglycScan defined specificities across input files.
This is defined as a function of the ratio of mapped glycosites to total PSMs reported in the respective input mzIdentML file.
Other computation results are reported in the following sub-subdirectories:
glycs: Contains tab-delimited outputs of identified peptides, associated mapped glycosites (N-Linked glycosylation site), modifications, search engine rank, charge, m/z and scan number found in each input mzid file.
gmaps: Reports the mapped protein accession, location, formatted glycosite sequence, number of tryptic ends, best peptide identification value, theoretical (unmodified peptide mass), and associated mass spectrometry scan id (of best PSM identification) derived from each mzIdentML input file. These are derived maps for PSMs better than user specified false discovery rate (FDR).
groups: An optional output that is only outputted when a phenotype input file is found provided. It contains a group-based computation of spectra counts (see spectraCount.matrix) and identification indeces (see identification.indeces). Groupings are based on associated group information provided in the optional input phenotype file. This is expected to be a 2-column tab-delimited file with a header line. The left column is expected to be the list of input mzIdentML (.mzid) file names and the right column is the group or phenotype to which respective file belong. In the group-based spectraCount.matrix output file in the “groups” output directory, the columns are the specified file groups while the rows are the identified unique glycosites. Likewise, in the group based identification.indeces tab-delimited file is reported the total (Identified peptides) and unique (Unique peptides) number of peptide spectrum matches; total (Identified glycosites) and unique (Unique glycosites) glycosites for each group.
values: Contains the computed P-value, FDR (False Discovery Rate) and Q-values for all peptide spectrum matches in each input mzIdentML file.
We implemented XGlycScan entirely in the Java programing language to ensure a wide range of operating system platform compatibility. Also to ensure compatibility with a wide range of search engine outputs, XGlycScan, by default, receives the proteomics community (PSI, Proteomics Standard Initiative) defined mzIdentML data format46,49 files as input. XGlycScan utilizes the jmzIdentML Java API50 in reading and accessing defined objects in input file(s). Result outputs are written to a tables' directory in user-specified output location. See documentation in the README file or at https://bitbucket.org/paiyetan/xglycscan/wiki/Home for details.
XGlycScan's current implementation define reference glycosites as peptide sequences about the canonical N-x-[ST] motif6 bounded within the immediate up and downstream trypsin cleavage sites. Given that some recent studies are beginning to provide evidences for glycosites not containing the canonical motif11, as part of future maintenance of XGlycScan and as evidences for such non-canonical motifs become stronger, we plan to integrate such information in defining reference glycosites.
Demonstrating Functionality
To demonstrate XGlycScan's functionalities, we searched sample tandem mass spectrometry derived glycoproteome profile. RAW files from two Thermo Scientific mass spectrometry instruments in Proteome Discoverer version 1.3. The mass spectrometers were Orbitrap Velos™ and QExactive™. The MSMS data were generated as part of the National Cancer Institute's (NCI), Clinical Proteomics Tumor Analysis Consortium (CPTAC), proteome characterization study. A full description of sample preparation and mass spectrometry protocols is publicly available and may be downloaded at the CPTAC data portal (https://cptac-data-portal.georgetown.edu/cptacPublic/). Also available for download are the sampled. RAW files from the Orbitrap Velos™ instrument. The QExactive™ instrument derived. RAW files are available on request.
We searched using Proteome Discoverer embedded SEQUEST48 search engine. We searched against the NCBI RefSeq protein database (September 16, 2013 version). We specified the following search parameters – a full tryptic digestion and a maximum missed cleavage of 1, a precursor mass tolerance of 10ppm and a fragment mass tolerance of 0.06 Da (Daltons), and ions series weight on b and y ions. We specified deamidation (+0.984016 Da) of Asparagine (N) as dynamic modification and oxidation (+15.994915 Da) of Methionine (M), modifications of peptide N-terminus with iTRAQ4plex (+144.102Da) of any residue, iTRAQ4plex modification (+144.102 Da) of Lysine (K) and carbamidomethylation (+57.021 Da) of Cysteine (C) as a static modifications. We allowed a maximum of 6 modifications per peptide. We converted our search result MSF files to the proteomics community defined mzIdentML standard format files using M2Lite51. Table I list the respective files and associated sample group information.
Table I. Samples Group Information.
| Serial number |
File Name | Sample Group |
Sample | Instrument |
|---|---|---|---|---|
| 1 | 061413_TCGA_G11_1.mzid | QEXACT_G11 | G11 | QExactive™ |
| 2 | 061413_TCGA_G11_2.mzid | QEXACT_G11 | G11 | QExactive™ |
| 3 | 061413_TCGA_G11_3.mzid | QEXACT_G11 | G11 | QExactive™ |
| 4 | 061413_TCGA_G14_1.mzid | QEXACT_G14 | G14 | QExactive™ |
| 5 | 061413_TCGA_G14_2.mzid | QEXACT_G14 | G14 | QExactive™ |
| 6 | 061413_TCGA_G14_3.mzid | QEXACT_G14 | G14 | QExactive™ |
| 7 | 061413_TCGA_G5_1.mzid | QEXACT_G05 | G05 | QExactive™ |
| 8 | 061413_TCGA_G5_2.mzid | QEXACT_G05 | G05 | QExactive™ |
| 9 | 061413_TCGA_G5_3.mzid | QEXACT_G05 | G05 | QExactive™ |
| 10 | TCGA_114C_24-1436-01A-01_13-2061-01A-02_36-2537-01A-01_G_JHUZ_20130228_RUN1_NOFRACTION_130408174702.mzid | ORBIT_G11 | G11 | Orbitrap Velos™ |
| 11 | TCGA_114C_24-1436-01A-01_13-2061-01A-02_36-2537-01A-01_G_JHUZ_20130228_RUN2_NOFRACTION_130408192810.mzid | ORBIT_G11 | G11 | Orbitrap Velos™ |
| 12 | TCGA_114C_24-1436-01A-01_13-2061-01A-02_36-2537-01A-01_G_JHUZ_20130228_RUN3_NOFRACTION_130408210853.mzid | ORBIT_G11 | G11 | Orbitrap Velos™ |
| 13 | TCGA_114C_29-1696-01A-01_29-1771-01A-01_13-2066-01A-02_G_JHUZ_20130228_RUN1_NOFRACTION.mzid | ORBIT_G14 | G14 | Orbitrap Velos™ |
| 14 | TCGA_114C_29-1696-01A-01_29-1771-01A-01_13-2066-01A-02_G_JHUZ_20130228_RUN2_NOFRACTION.mzid | ORBIT_G14 | G14 | Orbitrap Velos™ |
| 15 | TCGA_114C_29-1696-01A-01_29-1771-01A-01_13-2066-01A-02_G_JHUZ_20130228_RUN3_NOFRACTION.mzid | ORBIT_G14 | G14 | Orbitrap Velos™ |
| 16 | TCGA_114C_OVARIAN-CONTROL_25-2396-01A-01_36-2545-01A-01_G_JHUZ_20130228_RUN1_NOFRACTION_130408112404.mzid | ORBIT_G05 | G05 | Orbitrap Velos™ |
| 17 | TCGA_114C_OVARIAN-CONTROL_25-2396-01A-01_36-2545-01A-01_G_JHUZ_20130228_RUN2_NOFRACTION_130408130450.mzid | ORBIT_G05 | G05 | Orbitrap Velos™ |
| 18 | TCGA_114C_OVARIAN-CONTROL_25-2396-01A-01_36-2545-01A-01_G_JHUZ_20130228_RUN3_NOFRACTION_130408144538.mzid | ORBIT_G05 | G05 | Orbitrap Velos™ |
As input parameters in XGlycScan's configuration file, we specified our input file type as “MZIDENTML”, quantification type as “SPECTRA_COUNT”, protein sequence search database type as “REFSEQ”, compute false discovery rate (FDR) as “TRUE”, FDR filter or cutoff as “0.01”, evaluation value type as “SEQUESTXCORR”, and use top ranked as “FALSE”. Please see documentation at https://bitbucket.org/paiyetan/xglycscan/wiki/Home for more details.
Figure 2A summarizes the glycosite identifications reported by XGlycScan. Interestingly, XGlycScan evaluation appears to reduce the variability in the number of PSMs identified across mass-spectrometry technical replicates (Figure 2B). We observed specificities between 93 and 96 percent across all input identification files (Figure 2C). Significantly low specificity in identifications should raise a concern in possibly any of the preceding steps – sample preparation, mass spectrometry analysis or database peptide assignment.
Ultimately, by reducing redundancy in N-linked glycan attached loci, XGlycScan is expected to reduce the complexity in protein identification as fewer and more precise glycopeptide sequences should map to fewer proteins as illustrated in Figure 1B.
Figure 3A shows a typical XGlycScan command-line session. Figure 3B shows a graphical user interface program initiation session.
Figure 3.
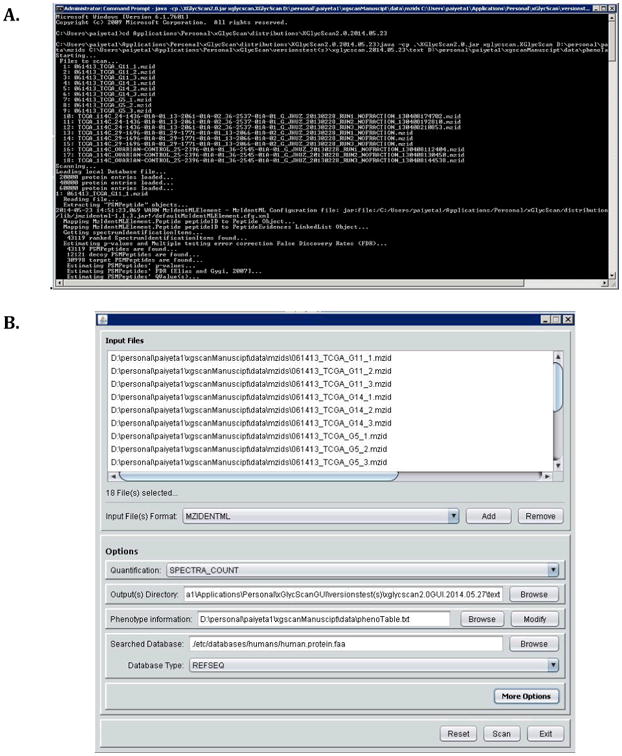
A. A typical XGlycScan command-line session.
B. A graphical user interface program initiation session.
Software Availability
XGlycScan's source codes are available as open-source at https://bitbucket.org/paiyetan/xglycscan/src and its compiled binaries and documentation can be freely downloaded at https://bitbucket.org/paiyetan/xglycscan/downloads. The user-friendly graphical user interface version can be found at https://bitbucket.org/paiyetan/xglycscangui/src and https://bitbucket.org/paiyetan/xglycscangui/downloads respectively. These are made available under the BSD 3-Clause open source license.
Acknowledgments
XGlycScan's development was supported by the National Institutes of Health, National Cancer Institute, Clinical Proteomic Tumor Analysis Consortium (CPTAC, U24CA160036) and the Early Detection Research Network (EDRN, U01CA152813), National Heart, Lung, and Blood Institute, Programs of Excellence in Glycosciences (PEG, P01HL107153). We do acknowledge members of the Center for Biomarker Discovery and Translation, Department of Pathology, Clinical Chemistry Division at the Johns Hopkins University School of Medicine.
Abbreviations
- PSM
Peptide Spectrum Matches
- FDR
False Discovery Rate
- HUPO
Human Proteome Organization
- PSI
Proteomics Standard Initiative
- iTRAQ
Isobaric Tag for Relative and Absolute Quantitation
Footnotes
The authors have declared no financial/commercial conflict of interest.
References
- 1.Montreuil J, Vliegenthart JFG, Schachter H. Glycoproteins II. 29b. Vol. 1997. Amsterdam; New York: Elsevier; p. 652. [Google Scholar]
- 2.Axford J, Zitzmann N, Scanlan MC, et al. 7th jenner glycobiology and medicine symposium. Adv Exp Med Biol. 2005;564 [PubMed] [Google Scholar]
- 3.Spiro RG. Protein glycosylation: Nature, distribution, enzymatic formation, and disease implications of glycopeptide bonds. Glycobiology. 2002;12(4):43R. doi: 10.1093/glycob/12.4.43r. [DOI] [PubMed] [Google Scholar]
- 4.Reihmane D, Dela F. Interleukin-6: Possible biological roles during exercise. European Journal of Sport Science. 2014;14(3):242. doi: 10.1080/17461391.2013.776640. [DOI] [PubMed] [Google Scholar]
- 5.Varki A, Cummings RD, Esko JD, et al. Essentials of glycobiology. 2009 [PubMed] [Google Scholar]
- 6.Hart GW. Glycosylation. Curr Opin Cell Biol. 1992;4(6):1017–1023. doi: 10.1016/0955-0674(92)90134-x. [DOI] [PubMed] [Google Scholar]
- 7.Y J, 3rd, Eng JK, McCormack AL. Mining genomes: Correlating tandem mass spectra of modified and unmodified peptides to sequences in nucleotide databases. Anal Chem. 1995;67(18):3202. doi: 10.1021/ac00114a016. [DOI] [PubMed] [Google Scholar]
- 8.Washburn MP, Wolters D, Yates JR. Large-scale analysis of the yeast proteome by multidimensional protein identification technology. Nat Biotechnol. 2001;19(3):242–247. doi: 10.1038/85686. [DOI] [PubMed] [Google Scholar]
- 9.Yates JR. Mass spectrometry and the age of the proteome. Journal of Mass Spectrometry. 1998;33(1):1–19. doi: 10.1002/(SICI)1096-9888(199801)33:1<1::AID-JMS624>3.0.CO;2-9. [DOI] [PubMed] [Google Scholar]
- 10.Zhang H, Li X, Martin DB, Aebersold R. Identification and quantification of N-linked glycoproteins using hydrazide chemistry, stable isotope labeling and mass spectrometry. Nat Biotechnol. 2003;21(6):660. doi: 10.1038/nbt827. [DOI] [PubMed] [Google Scholar]
- 11.Zielinska DF, Gnad F, Wiśniewski JR, Mann M. Precision mapping of an in vivo N-glycoproteome reveals rigid topological and sequence constraints. Cell. 2010;141(5):897–907. doi: 10.1016/j.cell.2010.04.012. [DOI] [PubMed] [Google Scholar]
- 12.Leitner A, Aebersold R. SnapShot: Mass spectrometry for protein and proteome analyses. Cell. 2013;154(1):252–252. e1. doi: 10.1016/j.cell.2013.06.025. [DOI] [PubMed] [Google Scholar]
- 13.Gygi SP, Aebersold R. Mass spectrometry and proteomics. Curr Opin Chem Biol. 2000;4(5):489–494. doi: 10.1016/s1367-5931(00)00121-6. [DOI] [PubMed] [Google Scholar]
- 14.Yates JR, Ruse CI, Nakorchevsky A. Proteomics by mass spectrometry: Approaches, advances, and applications. Annu Rev Biomed Eng. 2009;11:49–79. doi: 10.1146/annurev-bioeng-061008-124934. [DOI] [PubMed] [Google Scholar]
- 15.Huang T, Wang J, Yu W, He Z. Protein inference: A review. Briefings in Bioinformatics. 2012;13(5):586. doi: 10.1093/bib/bbs004. [DOI] [PubMed] [Google Scholar]
- 16.Nesvizhskii AI, Aebersold R. Interpretation of shotgun proteomic data: The protein inference problem. Molecular & Cellular Proteomics: MCP. 2005;4(10):1419. doi: 10.1074/mcp.R500012-MCP200. [DOI] [PubMed] [Google Scholar]
- 17.Dallas DC, Martin WF, Hua S, German JB. Automated glycopeptide analysis—review of current state and future directions. Briefings in Bioinformatics. 2013;14(3):361. doi: 10.1093/bib/bbs045. [DOI] [PMC free article] [PubMed] [Google Scholar]
- 18.Ceroni A, Maass K, Geyer H, Geyer R, Dell A, Haslam SM. GlycoWorkbench: A tool for the computer-assisted annotation of mass spectra of glycans. Journal Of Proteome Research. 2008;7(4):1650. doi: 10.1021/pr7008252. [DOI] [PubMed] [Google Scholar]
- 19.Vakhrushev SY, Dadimov D, Peter-Katalinić J. SysBioWare: Structure assignment tool for automated glycomics. Glyco-Bioinformatics, Postdam, Germany. 2009:141–161. [Google Scholar]
- 20.Albanese J, Glueckmann M, Lenz C. SimGlycan™ software*: A new predictive carbohydrate analysis tool for MS/MS data. Appl Biosystems. 2010 [Google Scholar]
- 21.Ethier M, Saba JA, Spearman M, et al. Application of the StrOligo algorithm for the automated structure assignment of complex n-linked glycans from glycoproteins using tandem mass spectrometry. Rapid communications in mass spectrometry. 2003;17(24):2713–2720. doi: 10.1002/rcm.1252. [DOI] [PubMed] [Google Scholar]
- 22.Gaucher SP, Morrow J, Leary JA. STAT: A saccharide topology analysis tool used in combination with tandem mass spectrometry. Anal Chem. 2000;72(11):2331–2336. doi: 10.1021/ac000096f. [DOI] [PubMed] [Google Scholar]
- 23.Goldberg D, Sutton-Smith M, Paulson J, Dell A. Automatic annotation of matrix-assisted laser desorption/ionization n-glycan spectra. Proteomics. 2005;5(4):865–875. doi: 10.1002/pmic.200401071. [DOI] [PubMed] [Google Scholar]
- 24.Joshi HJ, Harrison MJ, Schulz BL, Cooper CA, Packer NH, Karlsson NG. Development of a mass fingerprinting tool for automated interpretation of oligosaccharide fragmentation data. Proteomics. 2004;4(6):1650–1664. doi: 10.1002/pmic.200300784. [DOI] [PubMed] [Google Scholar]
- 25.Lapadula AJ, Hatcher PJ, Hanneman AJ, Ashline DJ, Zhang H, Reinhold VN. Congruent strategies for carbohydrate sequencing. 3. OSCAR: An algorithm for assigning oligosaccharide topology from MS n data. Anal Chem. 2005;77(19):6271–6279. doi: 10.1021/ac050726j. [DOI] [PMC free article] [PubMed] [Google Scholar]
- 26.Lohmann KK, von der Lieth CW. GlycoFragment and GlycoSearchMS: Web tools to support the interpretation of mass spectra of complex carbohydrates. Nucleic Acids Res. 2004;32:W261. doi: 10.1093/nar/gkh392. [DOI] [PMC free article] [PubMed] [Google Scholar]
- 27.Tang H, Mechref Y, Novotny MV. Automated interpretation of MS/MS spectra of oligosaccharides. Bioinformatics. 2005;21(Suppl 1):i431. doi: 10.1093/bioinformatics/bti1038. [DOI] [PMC free article] [PubMed] [Google Scholar]
- 28.An HJ, Tillinghast JS, Woodruff DL, Rocke DM, Lebrilla CB. A new computer program (GlycoX) to determine simultaneously the glycosylation sites and oligosaccharide heterogeneity of glycoproteins. Journal of proteome research. 2006;5(10):2800–2808. doi: 10.1021/pr0602949. [DOI] [PubMed] [Google Scholar]
- 29.Clerens S, Van den Ende W, Verhaert P, Geenen L, Arckens L. Sweet substitute: A software tool for in silico fragmentation of peptide-linked n-glycans. Proteomics. 2004;4(3):629–632. doi: 10.1002/pmic.200300572. [DOI] [PubMed] [Google Scholar]
- 30.Cooper CA, Gasteiger E, Packer NH. GlycoMod–a software tool for determining glycosylation compositions from mass spectrometric data. Proteomics. 2001;1(2):340–349. doi: 10.1002/1615-9861(200102)1:2<340::AID-PROT340>3.0.CO;2-B. [DOI] [PubMed] [Google Scholar]
- 31.Deshpande N, Jensen PH, Packer NH, Kolarich D. GlycoSpectrumScan: Fishing glycopeptides from MS spectra of protease digests of human colostrum sIgA. Journal of proteome research. 2010;9(2):1063–1075. doi: 10.1021/pr900956x. [DOI] [PubMed] [Google Scholar]
- 32.Goldberg D, Bern M, Parry S, et al. Automated N-glycopeptide identification using a combination of single-and tandem-MS. Journal of proteome research. 2007;6(10):3995–4005. doi: 10.1021/pr070239f. [DOI] [PubMed] [Google Scholar]
- 33.Irungu J, Go EP, Dalpathado DS, Desaire H. Simplification of mass spectral analysis of acidic glycopeptides using GlycoPep ID. Anal Chem. 2007;79(8):3065–3074. doi: 10.1021/ac062100e. [DOI] [PubMed] [Google Scholar]
- 34.Joenväärä S, Ritamo I, Peltoniemi H, Renkonen R. N-glycoproteomics - an automated workflow approach. Glycobiology. 2008;18(4):339. doi: 10.1093/glycob/cwn013. [DOI] [PubMed] [Google Scholar]
- 35.Maass K, Ranzinger R, Geyer H, von der Lieth C, Geyer R. “Glyco-peakfinder”–de novo composition analysis of glycoconjugates. Proteomics. 2007;7(24):4435–4444. doi: 10.1002/pmic.200700253. [DOI] [PubMed] [Google Scholar]
- 36.Ozohanics O, Krenyacz J, Ludanyi K, Pollreisz F, Vekey K, Drahos L. GlycoMiner: A new software tool to elucidate glycopeptide composition. Rapid Communications in Mass Spectrometry. 2008;22(20):3245–3254. doi: 10.1002/rcm.3731. [DOI] [PubMed] [Google Scholar]
- 37.Peltoniemi H, Joenväärä S, Renkonen R. De novo glycan structure search with the CID MS/MS spectra of native N-glycopeptides. Glycobiology. 2009;19(7):707. doi: 10.1093/glycob/cwp034. [DOI] [PubMed] [Google Scholar]
- 38.Ren JM, Rejtar T, Li L, Karger BL. N-glycan structure annotation of glycopeptides using a linearized glycan structure database (GlyDB) Journal of proteome research. 2007;6(8):3162–3173. doi: 10.1021/pr070111y. [DOI] [PMC free article] [PubMed] [Google Scholar]
- 39.Shan B, Zhang K, Ma B, Zhang C, Lajoie G. GlycoMaster-A software for interpretation of glycopeptides from MS/MS spectra. 2004 [Google Scholar]
- 40.Shan B. Implementation and application of automata. Springer; 2005. [Accessed 5/28/2014 3:17:16 PM]. Stochastic context-free graph grammars for glycoprotein modelling; pp. 247–258. [Google Scholar]
- 41.Woodin CL, Hua D, Maxon M, Rebecchi KR, Go EP, Desaire H. GlycoPep grader: A web-based utility for assigning the composition of N-linked glycopeptides. Anal Chem. 2012;84(11):4821–4829. doi: 10.1021/ac300393t. [DOI] [PMC free article] [PubMed] [Google Scholar]
- 42.Wu Y, Mechref Y, Klouckova I, Mayampurath A, Novotny MV, Tang H. Mapping site-specific protein n-glycosylations through liquid chromatography/mass spectrometry and targeted tandem mass spectrometry. Rapid Communications in Mass Spectrometry. 2010;24(7):965–972. doi: 10.1002/rcm.4474. [DOI] [PubMed] [Google Scholar]
- 43.Nwosu CC, Seipert RR, Strum JS, et al. Simultaneous and extensive site-specific N-and O-glycosylation analysis in protein mixtures. Journal of proteome research. 2011;10(5):2612–2624. doi: 10.1021/pr2001429. [DOI] [PMC free article] [PubMed] [Google Scholar]
- 44.Hua S, Nwosu CC, Strum JS, et al. Site-specific protein glycosylation analysis with glycan isomer differentiation. Analytical and bioanalytical chemistry. 2012;403(5):1291–1302. doi: 10.1007/s00216-011-5109-x. [DOI] [PubMed] [Google Scholar]
- 45.Zhang H, Loriaux P, Eng J, et al. UniPep--a database for human N-linked glycosites: A resource for biomarker discovery. Genome Biol. 2006;7(8):R73. doi: 10.1186/gb-2006-7-8-r73. [DOI] [PMC free article] [PubMed] [Google Scholar]
- 46.Jones AR, Eisenacher M, Mayer G, et al. The mzIdentML data standard for mass spectrometry-based proteomics results. Molecular & Cellular Proteomics: MCP. 2012;11(7):M111.014381. doi: 10.1074/mcp.M111.014381. [DOI] [PMC free article] [PubMed] [Google Scholar]
- 47.Elias JE, Gygi SP. Target-decoy search strategy for increased confidence in large-scale protein identifications by mass spectrometry. Nature Methods. 2007;4(3):207. doi: 10.1038/nmeth1019. [DOI] [PubMed] [Google Scholar]
- 48.Eng JK, McCormack AL, Yates JR., Iii An approach to correlate tandem mass spectral data of peptides with amino acid sequences in a protein database. J Am Soc Mass Spectrom. 1994;5(11):976–989. doi: 10.1016/1044-0305(94)80016-2. [DOI] [PubMed] [Google Scholar]
- 49.Mayer G, Montecchi-Palazzi L, Ovelleiro D, et al. The HUPO proteomics standards initiative- mass spectrometry controlled vocabulary. Database (Oxford) 2013;2013:bat009. doi: 10.1093/database/bat009. [DOI] [PMC free article] [PubMed] [Google Scholar]
- 50.Reisinger F, Krishna R, Ghali F, et al. jmzIdentML API: A java interface to the mzIdentML standard for peptide and protein identification data. Proteomics. 2012;12(6):790. doi: 10.1002/pmic.201100577. [DOI] [PMC free article] [PubMed] [Google Scholar]
- 51.Aiyetan P, Zhang B, Chen L, Zhang Z, Zhang H. M2Lite: An open-source, light-weight, pluggable and fast proteome discoverer MSF to mzIdentML tool. Journal of Bioinformatics. 2014;1(2):40–49. [PMC free article] [PubMed] [Google Scholar]