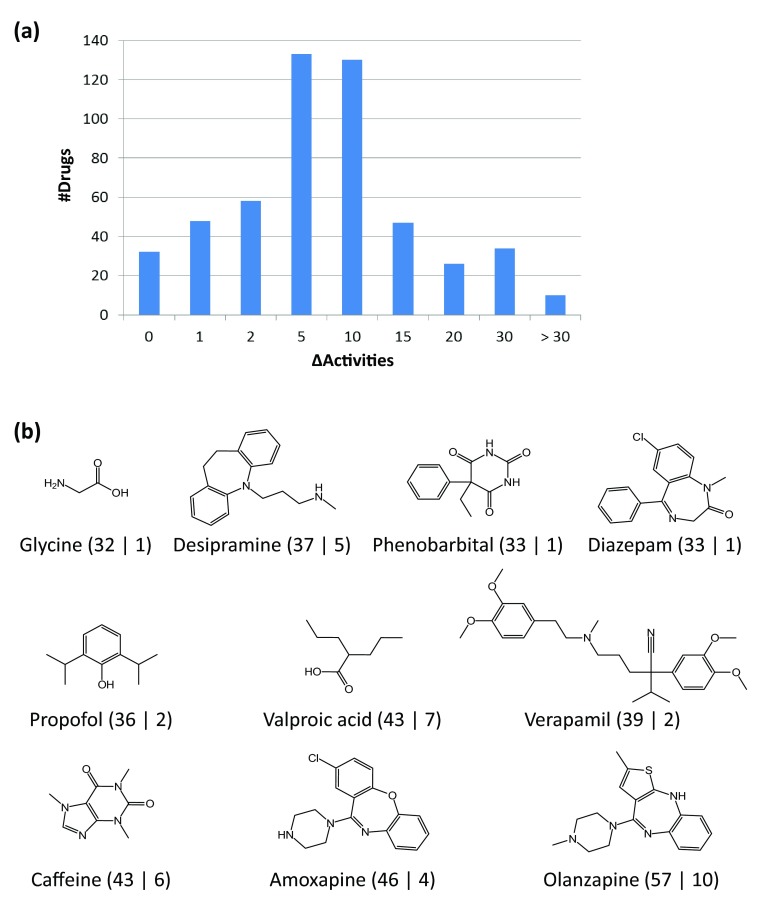
Figure 3. Promiscuity variation in DrugBank vs ChEMBL.
( a) Reported is the distribution of promiscuity differences (∆Activities) between DrugBank and ChEMBL for 518 drugs. ( b) Shown are 10 drugs with the largest difference in promiscuity (∆Activities > 30). Target annotations are represented according to Figure 2c and Figure 2d.

