

Abstract
It was hypothesized that expression profiling using gene arrays can be used to distinguish temporal patterns of changes in gene expression in response to a drug in vivo, and that these patterns can be used to identify groups of genes regulated by common mechanisms. A corticosteroid, methylprednisolone (MPL), was administered intravenously to a group of 47 rats (Rattus rattus) that were sacrificed at 17 timepoints over 72 h after MPL administration. Plasma drug concentrations and hepatic glucocorticoid receptors were measured from each animal. In addition, RNAs prepared from individual livers were used to query Affymetrix genechips for mRNA expression patterns. Statistical analyses using Affymetrix and GeneSpring software were applied to the results. Cluster analysis revealed six major temporal patterns containing 196 corticosteroid-responsive probe sets representing 153 different genes. Four clusters showed increased expression with differences in lag-time, onset rate, and/or duration of transcriptional effect. A fifth cluster showed rapid reduction persisting for 18 h. The final cluster identified showed decreased expression followed by an extended period of increased expression. These results lend new insights into the diverse hepatic genes involved in the physiologic, therapeutic, and adverse effects of corticosteroids and suggest that a limited array of control processes account for the dynamics of their pharmacogenomic effects.
Keywords: Corticosteroids, Glucocorticoids, Expression profiling, Cluster analysis
Introduction
Corticosteroids (synthetic glucocorticoids) are a common group of drugs used to treat a variety of pathologies and circumstances requiring anti-inflammatory or immunosuppressive intervention (Baxter 2000; Schimmer and Parker 1996). These conditions include organ transplantation, rheumatoid arthritis, inflammatory bowel disease, Crohn’s disease, lupus, multiple sclerosis, dermatomyositis, arthritis, leukemia, non-Hodgkin’s lymphoma, asthma, and glomerulonephritis. Both the efficacy and toxicity of corticosteroids arise from the pharmacological exaggeration of physiological effects of glucocorticoids on target tissues (Bialas and Routledge 1998; Frauman 1996). Beneficial effects deriving from inhibition of the immune system are accompanied by numerous side effects that include osteoporosis/osteopenia, muscle wasting, steroid diabetes, dyslipidemia, fatty liver, and an increased risk of atherosclerosis.
A major initiating mechanism of corticosteroid action involves ligand-glucocorticoid receptor binding followed by receptor-mediated transcriptional modulation of gene expression. A dimer of the hormone activated glucocorticoid receptor (GR) binds to glucocorticoid responsive elements (GRE) in the DNA and alters the transcription of specific genes (Adcock 2000; Evans 1988; Gustafsson et al. 1987). Virtually all tissues contain genes whose transcription are at least in part subject to regulation by the activated GR resulting in either enhanced or repressed expression of the mRNA. However, it is unlikely that to date all glucocorticoid regulated genes have been identified in any target tissue. Moreover, little information is available on the temporal patterns of changes in the expression of target genes in vivo in response to drug treatment.
In our previous work, quantitative Northern hybridization and quantitative rtPCR were used to discern the temporal patterns of changes in the expression of several individual mRNAs in two glucocorticoid responsive tissues, liver and skeletal muscle (Sun et al. 1998b, 1999). Two distinct profiles were observed following bolus dosing with methylprednisolone (MPL). Although markedly different in onset and duration, a common characteristic of both patterns is that they persist in time well after the drug has dissipated from the plasma (Almon et al. 2002). In addition the phenomenon of steroid tolerance, reflected as diminution in the responses to a subsequent dose of drug given 24 h after the first dose or during chronic infusion, was found (Ramakrishnan et al. 2002; Sun et al. 1998a). These variations in the response dynamics of different genes suggest that pharmacodynamic factors controlling steroid responses are complex and require assessment of drug kinetics, dose, regimen, tissues, multiple genes, and the combined intricacies of these and other factors that modulate their effects. A prerequisite to understanding such complexities of drug treatment is a broader identification of both the genes affected by steroid treatment and the temporal patterns of transcriptional changes that occur.
Changes in the expression of genes in the liver play a major role in both the efficacious and adverse effects of corticosteroids. With respect to efficacy, corticosteroids both enhance the expression of serum proteins that limit immune/inflammatory responses and suppress the expression of proteins that promote such responses (Almon et al. 2002; Pannen and Robotham 1995). In regard to adverse effects, the expression of liver enzymes involved in gluconeogenesis is enhanced while the use of glucose by the liver and other peripheral tissues is reduced resulting in steroid diabetes (McMahon et al. 1988). Similarly, expression of enzymes involved in liver fat metabolism and systemic fat distribution are altered causing dyslipidemia (Berdanier 1989). In addition, corticosteroids modify the metabolism of a large variety of endogenous and exogenous substrates such as drugs and xenobiotics (Prough et al. 1996).
In the present report we describe the use of gene arrays coupled with cluster analysis to develop a unique dataset that allows a broad evaluation of the temporal patterns of changes in the expression of clusters of genes in response to a single dose of MPL in liver tissue. This work is novel in that it provides an extensive gene array dataset describing the diverse nature in the time-dependence of the in vivo response of a tissue to a drug.
Materials and methods
Animal care
All protocols involving animals adhere to the “Principles of Laboratory Animal Care” (NIH publication no. 85-23, revised 1985). Male adrenalectomized (ADX) Wistar rats (Rattus rattus) weighing 225–250 g were obtained from Harlan Sprague-Dawley (Indianapolis, Ind.). Animals were allowed free access to rat chow (Agway, RMH 1000) and 0.9% NaCl drinking water. They were housed in a room with a 12 h light/12 h dark cycle, a constant temperature of 22° C and were allowed to acclimatize to this environment for at least 1 week. One day prior to the study, all rats were subjected to right external jugular vein cannulation under light ether anesthesia. Cannula patency was maintained with sterile 0.9% NaCl solution. Four animals were designated as controls (i.e., zero time samples) and received vehicle only. All remaining animals received a single 50 mg/kg dose of methylprednisolone sodium succinate (Pharmacia-Upjohn Company, Kalamazoo, Mich.) via the cannula over 30 s. Two or three rats were sacrificed by exsanguination under anesthesia at the following time points after MPL administration: 0.25, 0.5, 0.75, 1, 2, 4, 5, 5.5, 6, 7, 8, 12, 18, 30, 48, and 72 h. Approximately 5–10 ml of blood from each animal was drained from the abdominal aortic artery into a heparinized syringe. Blood samples were centrifuged immediately and plasma was harvested and frozen at −20° C until analysis. The livers were rapidly excised, flash frozen in liquid nitrogen, ground to a fine powder at liquid nitrogen temperatures, and stored at −80°C. Tissues from each individual animal were analyzed separately. Other tissues from these same animals have been harvested and maintained for future analysis and expansion of the dataset.
Drug assay
Plasma concentrations of MPL were determined by a high performance liquid chromatography (HPLC) method as previously described (Ebling et al., 1985). The limit of quantitation was 8 ng/ml and coefficients of variation (CV) were less than 10% (interday and intraday).
GR density
Liver cytosolic GR densities were determined by a 3H-DEX ligand binding method which utilizes Scatchard analyses of full isothermal association curves to determine numbers of binding sites as previously published (Sun et al. 1998b).
RNA preparation
Total RNA samples were prepared from aliquots of the powdered livers using TriZol reagent (InVitrogen Corp, Carlsbad, Calif.). RNA preparations were carried out according to manufacturer’s directions except that an additional round of phenol-chloroform extraction followed by a final chloroform extraction were included in the protocol. Total RNA was subjected to further purification on Qiagen RNeasy mini-columns according to manufacturer’s directions for RNA clean-up (Qiagen, Valencia, Calif.). RNA quantitaion was accomplished by triplicate determinations of absorbance at 260 nm. RNA integrity was verified by determination of absorbance ratios at 260/280 nm, and by formaldehyde gel electrophoresis.
Gene arrays
The syntheses of cDNA and biotinylated cRNA were done according to the protocols provided by the manufacturer (Affymetrix, Santa Clara, Calif.). Ten micrograms of fragmented biotinylated cRNA were hybridized to 47 individual RG_U34A Rat Genechips according to recommended protocols. Scanning was performed after biotin/avidin/phycoeythrin amplification.
Data analysis
Absolute analyses (average difference determinations for each probe set) were performed using Affymetrix Micro Array Suite 4.0 software. Each chip was normalized using a distribution of all genes around the 50th percentile. The results of these analyses were input into GeneSpring (Silicon Genetics, Redwood City, Calif., http://www.silicongenetics.com/cgi/SiG.cgi/Products/GeneSpring?index.smf) for temporal sequence analyses. Each individual gene was normalized to the four controls (i.e., zero time samples) by dividing the individual value at each of the 16 time points by the average of the four controls. The result was that each probe set has a value of 1 at zero time and increased over the time course if expression was enhanced, decreased over the time course if expression was repressed, or remained at 1 if the probe set was unaffected by the treatment. Affymetrix software allows for three possible determinations for each probe set at each time point: Present, Absent or Marginal, based on the relative intensities of the matched and mismatched probe sets for the sequence. The data set was scrubbed to retain only those genes that indicated at least four Present calls out of the 17 time points in the Affymetrix analysis. The absolute, non-normalized values for probes with a Present designation ranged from as low as 60 to as high as 20,000 providing an indication of the range of abundancies. The scrubbed data set was then used for cluster analysis with the GeneSpring software. Three approaches were used to define clusters of genes with similar temporal patterns: user defined patterns, self-organizing maps (SOM), and k-means clustering. These yielded six different temporal patterns with genes in each cluster having a correlation coefficient of at least 0.95 with each other.
Results
Figure 1A depicts the plasma concentration of MPL in the population of animals, showing a biexponential decline with a terminal half-life of 35 min. Also shown are the measured free GRs in hepatic cytosol (Fig. 1B) along with the calculated quantity of receptors bound to nuclear GREs (Fig. 1C). The latter [DR(N)] was generated using pharmacodynamic modeling in previous studies (Sun et al., 1998b). It is important to note that these data serve as the controlling or input component driving transcription of genes such as tyrosine aminotransferase (TAT) and perhaps most hepatic mRNA responses to corticosteroids.
Fig. 1.

A Plasma concentrations of methylprednisolone versus time after a 50 mg/kg methylprednisolone (MPL) i.v. bolus dose in rats. Data points are observed values and the solid line is the result of least-squares fitting (Sun et al. 1998b). B Free glucocorticoid receptors (GR) in hepatic cytosol as a function of time before and following MPL injection. Data points are observed values and dotted lines represent predicted values ± standard deviation from estimates of output error variance (Sun et al. 1998b). C Calculated amount of GR bound to glucocorticoid response elements in the nucleus [DR(N)] as a function of time following MPL injection (Sun et al. 1998b)
Isolated RNA from the livers of individual animals was used to prepare targets which were hybridized to 47 individual RG_U34A Affymetrix Genechips. GeneSpring software was applied to the Affymetrix output to reveal temporal patterns of changes in mRNA expression. GeneSpring analysis resulted in six clusters of genes exhibiting different patterns of temporal regulation (Fig. 2). For each panel in Fig. 2, mean normalized values from individual animals at each time point are plotted for each probe set in the cluster. All probe sets designated to be within a particular cluster have a correlation of 0.95 or higher. The line colors for individual probe sets used in this figure reflect the intensity of expression of that particular message, with blue representing genes expressed at relatively low levels and red representing genes expressed at relatively high levels in the tissue samples. For illustrative purposes, one gene in each cluster was chosen at random and is highlighted in white. Tables 1, 2, 3, 4, 5, 6 identify the probe sets present in each cluster by a common name along with their accession numbers. Affymetrix Genechips are designed with a degree of probe set redundancy in that in some cases multiple probe sets map to different regions of the same gene. Such redundant probe sets may match to the same or different accession numbers. The presence of two probe sets matching the same accession number are indicated on each table as necessary. A number of probe sets on the Affymetrix chips are currently listed as unidentified ESTs. We attempted to identify those ESTs which segregated to a particular cluster in our analysis using the BLASTn program available through NCBI (http://www.ncbi.nlm.nih.gov/). Those ESTs which we were able to identify by this means are also indicated in the relevant table.
Fig. 2.
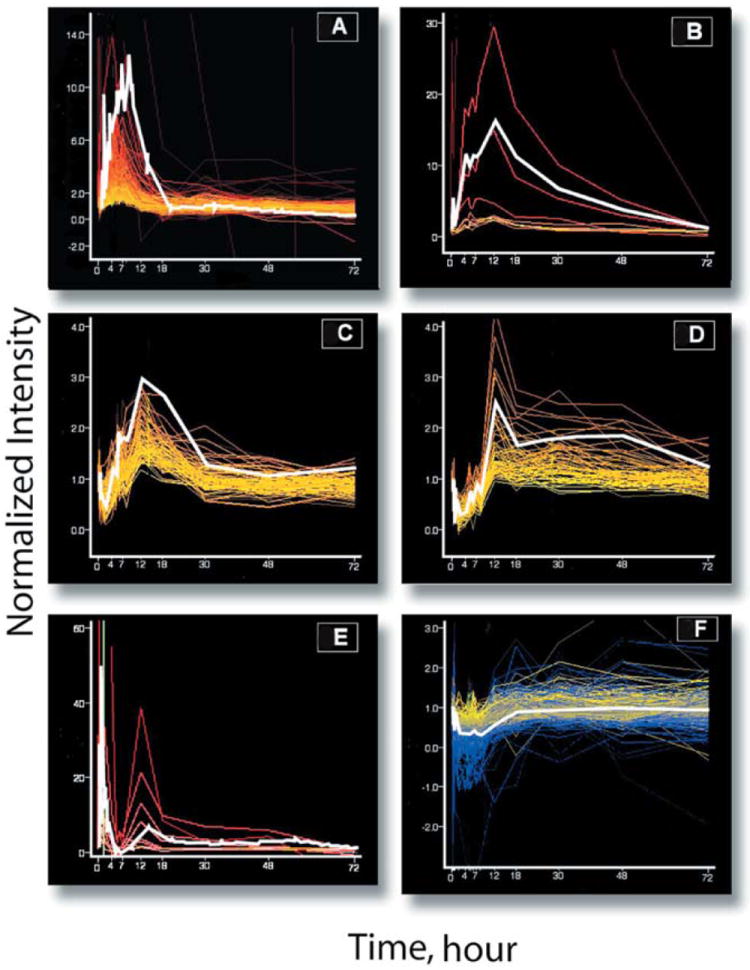
A–F Changes in mRNA levels of glucocorticoid regulated genes as a function of time before (time zero = 1) and following MPL administration measured by gene array analysis and identified by cluster analysis. A Cluster 1 (23 probe sets), ornithine decarboxylase is highlighted in white. B Cluster 2 (8 probe sets), α2-macroglobulin is highlighted in white. C Cluster 3 (21 probe sets), minoxidil sulfotransferase is highlighted in white. D Cluster 4 (66 probe sets), hydroxysteroid dehydrogenase is highlighted in white. E Cluster 5 (10 probe sets), Interleukin-1 alpha is highlighted in white. F Cluster 6 (68 probe sets), dihydropyrimidinase is highlighted in white. Colors reflect message abundance ranging from red (most abundant), orange, yellow, to blue (least abundant)
Table 1.
Cluster 1 probe sets. All probe sets have a minimum standard correlation of 0.95 or greater
| Gene name | Accession no. |
|---|---|
| Cyclin G | X70871 |
| a Diphosphoinositol polyphosphate phosphohydrolase (AF253473) | AA891107 |
| a GTPase-inhibitory protein (XM147220) | H31144 |
| a Hyaluronan receptor (AK004726) | AI639246 |
| IMP cyclohydrolase | D89514 |
| K-ras | U09793 |
| a Matrix Gla protein (NM012862) | AI012030 |
| Microtubule-associated proteins | U05784 |
| Mitochondrial precursor receptor | D63411 |
| Nucleolar phosphoprotein of 140 kDa, Nopp140 | M94287 |
| Nucleolar protein B23.2 | J04943 |
| Nucleolin | M55015 |
| a Nucleosome assembly protein (AK011301) | AA859920 |
| Ornithine decarboxylase | X07944 |
| Ornithine decarboxylase | J04791 |
| Ornithine decarboxylase | J04792 |
| Rat Y-box binding protein | D28557 |
| a Spingomyelin phosphodiesterase 3 (NM053605) | AI231007 |
| Survival motor neuron (smn) mRNA | AF044910 |
| Transfer RNA-Valine synthetase | M98327 |
| Unidentified EST | AA799531 |
| Unidentified EST | AI014163 |
| Unidentified EST | AI639158 |
Probe sets that were identified by Affymetrix as ESTs, but were identified from GenBank by a nucleotide BLAST
Table 2.
Cluster 2 probe sets. All probe sets have a minimum standard correlation of 0.95 or greater
| Gene name | Accession no. |
|---|---|
| Alpha-2-macroglobulin | X13983 |
| b Alpha-2-macroglobulin (2 probe sets) | M22670 |
| a Alpha-2-macroglobulin (NM012488) | AI113046 |
| 17-Beta-hydroxysteroid dehydrogenase | U81186 |
| Cyclophilin-like protein (XM129812) | AA892298 |
| Cytochrome b5, mitochondrial | Y12517 |
| EH domain binding protein epsin 2 | AF096269 |
| Fibronectin | X05831 |
Probe sets that were identified by Affymetrix as ESTs, but were identified from GenBank by a nucleotide BLAST
Multiple probe sets of different sequence which have identical accession numbers
Table 3.
Cluster 3 probe sets. All probe sets have a minimum standard correlation of 0.95 or greater
| Gene name | Accession no. |
|---|---|
| Adenosine kinase | U57042 |
| Arginase | J02720 |
| b 17-Beta-hydroxysteroid dehydrogenase type 3 (2 probe sets) | U81186 |
| a Butyrate induced transcript 1 (XM134992) | AA875148 |
| a Calpain (AK008970) | AA892921 |
| Carbamyl phosphate synthetase I | M11710 |
| a Cytochrome b5, mitochondrial | Y12517 |
| a Cytochrome c1 (NM025567) | AA799474 |
| Cytosolic epoxide hydrolase | X65083 |
| Fructose 1,6-biphosphatase | AJ005046 |
| Glutathione S-transferase | S83436 |
| Hormone sulfotransferase, ST1B1 | D89375 |
| b Minoxidil sulfotransferase (2 probe sets) | L19998 |
| a Nucleoside diphosphate kinase beta (AF033377) | AI233173 |
| Porphobilinogen deaminase | X06827 |
| RCL stimulated by c-myc | U82591 |
| S-Adenosyl-l-homocysteine hydrolase | M15185 |
| Uricase | X13098 |
| Uricase | J03959 |
Probe sets that were identified by Affymetrix as ESTs, but were identified from GenBank by a nucleotide BLAST
Multiple probe sets of different sequence which have identical accession numbers
Table 4.
Cluster 4 probe sets. All probe sets have a minimum standard correlation of 0.95 or greater
| Gene name | Accession no. |
|---|---|
| a N-Acetylglucosaminyl transferase I (NM030861) | AA957132 |
| b Aldo-keto reductase (NM134407) (2 probe sets) | AA892821 |
| Alpha 7A integrin | X74293 |
| Alpha-1B adrenergic receptor | M60655 |
| Calcium/calmodulin-dependent protein kinase I | L24907 |
| cAMP-dependent protein kinase | X57986 |
| Cathepsin H | M38135 |
| CTP:phosphoethanolamine cytidylyltransferase | AF080568 |
| Cytochrome c oxidase VIa | X72757 |
| a Cytochrome P450 IIB3 (M20406) | AI169735 |
| Cytochrome P450, CYP2B14P | U33540 |
| b Dihydropteridine reductase | J03481 |
| Estrogen sulfotransferase | M86758 |
| Estrogen sulfotransferase | S76489 |
| Farnesoid X activated receptor | U18374 |
| Fructosamine 3 kinase | AA891965 |
| GABA transporter GAT-2 | M95762 |
| b Glycogen storage disease type 1b protein (2 probe sets) | AF080468 |
| b 3-Hydroxyanthranilate 3,4-dioxygenase (2 probe sets) | D28339 |
| Hydroxysteroid sulfotransferase | D14988 |
| Hydroxysteroid sulfotransferase | D14987 |
| Hydroxysteroid sulfotransferase | D14989 |
| Hydroxysteroid sulfotransferase | M31363 |
| Hydroxysteroid sulfotransferase | X63410 |
| Hydroxysteroid sulfotransferase | M33329 |
| a Hydroxysteroid sulfotransferase (D14987) | AA818122 |
| a Hydroxysteroid sulfotransferase (D14989) | AI169695 |
| a Hydroxysteroid sulfotransferase (M31363) | AA817987 |
| a Hydroxysteroid sulfotransferase (X63410) | AA945050 |
| Immunophilin | AI136977 |
| a Immunophilin FKBP-52 (NM010219) | AI231547 |
| a Microsomal aldehyde dehydrogenase (NM03131) | AA996484 |
| Mitochondrial dicarboxylate carrier | AJ223355 |
| a Mitochondrial dicarboxylate carrier (NM031731) | AA859666 |
| Mitochondrial phosphoprotein 65 | AB000098 |
| NADH dehydrogenase (NM030861) | AI176491 |
| NF-1 like DNA-binding protein | X13167 |
| Non-specific lipid transfer protein (nsL-TP) | M58287 |
| Nuclear factor 1 | D78018 |
| Orphan receptor RLD-1 | U11685 |
| 2-Oxoglutarate carrier | U84727 |
| 5-Oxo-l-prolinase | U70825 |
| Phosphodiesterase I | D30649 |
| Potassium channel beta 2 subunit (U31908) | H33656 |
| Protoporphyrinogen oxidase (XM123566) | AA859700 |
| RAB8 GTP binding protein | M83675 |
| c-raf protooncogene mRNA | M15427 |
| b Retinoblastoma protein (2 probe sets) | D25233 |
| Solute carrier family 12 (XM122597) | AA799691 |
| a Spermatogenesis associated protein (U97667) | AI012802 |
| Squalene synthetase | M95591 |
| Syndecan | X60651 |
| a Type I iodothyronine deiodinase (NM021653) | AI639418 |
| UDP glucuronosyltransferase | J02589 |
| UDP-glucuronosyltransferase, phenobarbital-inducible | M13506 |
| Zinc finger protein Y1 | AF052042 |
| Zinc transporter ZnT-1 | U17133 |
| Unidentified EST | AA893658 |
| Unidentified EST | AA893905 |
| Unidentified EST | AA893289 |
| Unidentified EST | AA859933 |
Probe sets that were identified by Affymetrix as ESTs, but were identified from GenBank by a nucleotide BLAST
Multiple probe sets of different sequence which have identical accession numbers
Table 5.
Cluster 5 probe sets. All probe sets have a minimum standard correlation of 0.95 or greater
| Gene name | Accession no. |
|---|---|
| b immediate-early serum-responsive JE gene (2 probe sets) | X17053 |
| Interleukin 1-beta | E01884 |
| b Interleukin 1-beta (2 probe sets) | M98820 |
| b Interleukin-1 alpha (2 probe sets) | D00403 |
| Interleukin-1 alpha | E05489 |
| Macrophage inflammatory protein-1 beta | U06434 |
| Vascular adhesion molecule | M84488 |
Multiple probe sets of different sequence which have identical accession numbers
Table 6.
Cluster 6 probe sets. All probe sets have a minimum standard correlation of 0.95 or greater
| Gene name | Accession no. |
|---|---|
| Adipocyte hormone-sensitive cyclic AMP phosphodiesterase | Z22867 |
| a Aldo-keto reductase family 1, C12 (NM013777) | AI639418 |
| Aquaporin | AB013112 |
| a H, K-ATPase (J026491) | AA894338 |
| Beta-alanine oxoglutarate aminotransferase | D87839 |
| a CAAT box DNA BP (XM122083) | AA817843 |
| Calcium channel alpha-1 subunit | U14005 |
| a Caldesmon non-muscle COOH (NM013146) | AI180288 |
| cca2 mRNA | AB000199 |
| Cytochrome P450 4F4, CYP4F4 | U39206 |
| Cytochrome P450 IIA2 protein, CYP2A2 | J04187 |
| Cytochrome P450, CYP2B14P | U33540 |
| a Cytosolic NADP dependent isocitrate dehydrogenase (NM031510) | AA892353 |
| Delta 4–3-ketosteroid 5 beta-reductase | S80431 |
| Delta-4–3-ketosteroid 5-beta-reductase | D17309 |
| b Dihydropyrimidinase (probe sets) | D63704 |
| G-protein-coupled receptor LGR4 | AF061443 |
| Gamma-glutamylcysteine synthetase | S65555 |
| Glucagon receptor | M96674 |
| a Glyoxylate reductase (AY113690) | AA892799 |
| GTP cyclohydrolase I feedback regulatory protein | U85512 |
| Hepatic steroid hydroxylase IIA1, CYP2A1 | M33312 |
| Hepsin | X70900 |
| H-rev107 mRNA | X76453 |
| 3-Hydroxyanthranilate 3,4-dioxygenase | D28339 |
| a Insulin-like growth factor BP acid labile subunit (NM013146) | AA924289 |
| b Insulin-like growth factor BP acid-labile subunit (probe sets) | S46785 |
| K, Cl cotransporter solute carrier, family 12 member 7 | AA799691 |
| Kynurenine 3-hydroxylase | AF056031 |
| a Long chain acyl-CoA synthetase (D90109) | A893242 |
| a Long chain acyl-CoA synthetase (D90109) | AI044900 |
| Long-chain acyl-CoA synthetase | D90109 |
| L-type voltage-dependent calcium channel alpha 1 | D38101 |
| b Lysosomal acid lipase (probe sets) | S81497 |
| Matrin F/G | M64862 |
| b MG87 mRNA (probe sets) | AF095741 |
| Monoamine oxidase B | M23601 |
| NADH-cytochrome b5 reductase | D00636 |
| NADH-cytochrome b5 reductase | J03867 |
| Non-specific lipid transfer protein | M58287 |
| Non-specific lipid transfer protein | M62763 |
| Ornithine carbamoyltransferase | K03041 |
| Ornithine carbamoyltransferase | M11266 |
| Polymeric immunoglobulin receptor | L13025 |
| Polymeric immunoglobulin receptor | L14001 |
| a Protein kinase alpha II stress activated (L27112) | AI231354 |
| Regucalcin | D31662 |
| a Selenocysteine lyase (XM123708) | AA893032 |
| Sky | D37880 |
| Sodium/bile acid cotransporter | M77479 |
| a Sorbitol dehydrogenase (X74593) | AI030175 |
| a Thyroxine deiodinase type I (X57999) | AI639479 |
| Zn-peptidase aminopeptidase | M25073 |
| Unidentified EST | AA893080 |
| Unidentified EST | AA859663 |
| Unidentified EST | AA800797 |
| Unidentified EST | AA799762 |
| Unidentified EST | AA892773 |
| Unidentified EST | AA875639 |
| Unidentified EST | AA892314 |
| Unidentified EST | AI639108 |
| Unidentified EST | AA891774 |
| Unidentified EST | H33001 |
Probe sets that were identified by Affymetrix as ESTs, but were identified from GenBank by a nucleotide BLAST
Multiple probe sets of different sequence which have identical accession numbers
The first approach to cluster analysis employed a GeneSpring feature that allows for the dataset to be queried using a particular pattern. We input the temporal pattern exhibited by two enzymes, TAT in liver, and glutamine synthetase (GS) in skeletal muscle, which we had characterized previously (Sun et al. 1998b, 1999). These enzymes, involved in the gluconeogenic actions of corticosteroids, are related to adverse effects such as steroid diabetes (TAT) and muscle wasting (GS). Figure 2A shows the change in expression of genes that follow the same temporal pattern as TAT and GS. This cluster contained 23 probe sets representing 18 unique genes (Table 1). One of these 23 probe sets, ornithine decarboxylase (D63704) is highlighted in white as an illustration of the general pattern. The chip contained three separate probe sets for ornithine decarboxylase which all sorted to this first cluster. Three probe sets representing unidentified ESTs are also present in this cluster.
The remaining five clusters were found by using two additional techniques, SOM and k-means clustering. Both approaches to clustering are “supervised”, requiring an a priori decision as to how many unique patterns actually exist in the data set. In reality the chosen node structure is simply an “educated guess” as to possibilities. For SOM we used a 4,5 node structure yielding 20 possible clusters. For k-means we predicted 10 possible clusters. It should be pointed out that these techniques do not just segregate equal numbers of probe sets into putative clusters. Rather, both methods simply sort the probe sets into groups with similar patterns. For both SOM and k-means some of the putative clusters contained probe sets with time points reflecting random distributions around 1 with perhaps a single point or two deviating significantly from 1. Although such data outliers do not represent a rational pattern, both SOM and k-means would define these as a cluster pattern. Despite these limitations, the value of the two clustering methods is that they do also identify groups of probe sets with rational patterns. Therefore, the next step was to visually inspect each of the possible clusters for a rational pattern. We defined “rational patterns” as four to five consecutive time points that deviated in the same direction from 1.
We observed six rational patterns for the k-means clustering and six similar patterns from the SOM. We then selected a single gene from each of the six clusters that seemed to represent that cluster and used another feature of GeneSpring, “Find similar” and restricted the minimum correlation coefficient to 0.95. These series of steps defined clusters two to six. Cluster 2, containing nine probe sets which represented six different genes is illustrated in Fig. 2B. The profile of α2-macroglobulin (X13983) is highlighted. Two additional probe sets in this cluster also coded for α2-macroglobulin (Table 2). This pattern shows an increase in mRNA beginning, like the first cluster, at about 2 h, a peak at about 12 h, and a slow decline to baseline by about 48 h.
The third cluster contains 21 probe sets that code for 18 different genes (Fig. 2C). The pattern of minoxidil sulfotransferase (L19998) is highlighted. Three genes, minoxidil sulfotransferase, 17 β-hydroxysteroid dehydrogenase type 3, and uricase each have two probe sets that sorted to this cluster (Table 3). This pattern has similarities to both previous patterns except that the increase is delayed by about an hour, and the length of time that the mRNA is elevated is longer than the first cluster but shorter than the second cluster.
The fourth cluster contains 66 probe sets that code for 44 different genes (Fig. 2D). This cluster is demonstrated (highlighted) by D14988, one of the 10 probe sets sorted to this cluster that codes for hydroxysteroid sulfotransferase. This cluster also contains two probe sets for eight additional genes: 3-hydroxyanthranilate 3,4-dioxygenase, aldo-keto reductase, dicarboxylate carrier, dihydropteridine reductase, estrogen sulfotransferase, glucose-6-phosphate transporter, immunophilin, and the retinoblastoma gene. Four currently unidentified ESTs appear in cluster 4 (Table 4). This cluster shows an initial decline for about 8 h followed by even greater delay in enhanced expression of message which begins more than 8 h following dosing and lasts almost throughout the 72-h time period.
The fifth cluster contains 10 probe sets that code for five genes (Fig. 2E, Table 5). This cluster, highlighted by one of three probe sets for interleukin-1α (D00403), shows an immediate rise and a rapid return to baseline by 4 h.
The last cluster contains 67 probe sets (Fig. 2F). However, there are seven genes with two coding probe sets, two genes with three coding probe sets and 10 ESTs that cannot be identified using the BLAST program. This cluster therefore contains 45 identifiable genes (Table 6). This cluster is illustrated by dihydropyrimidinase and shows a transient decline in message that occurs rapidly within the first 2 h and persists until about 18 h following dosing.
Discussion
The work presented utilizes gene arrays coupled with cluster analysis to examine temporal patterns of transcriptional responses to corticosteroids in liver tissue in vivo. This is possibly the first extensive gene array data set describing the time-dependence of the in vivo tissue response to any drug. For the most part, published works with gene arrays usually compare samples from treated and untreated animals, which does not allow for evaluation of the dynamics of responses (e.g. Nadadur and Kodavant 2002; Parmentier-Batteur et al. 2002; Shalev et al. 2002). Virtually all previous time sequence gene array work has involved only in vitro studies (e.g. Burton et al. 2002; DePrimo et al. 2002; Moran et al. 2002).
The gene array chips used here contain 8,799 rat specific probes sets. Forty-seven individual gene chips were used to query mRNA expression in livers from 47 individual animals, reflecting 17 different time points following MPL administration. Since the 8,799 probe sets present on these chips are rat specific, not liver specific, the first step in analysis was to identify those probe sets expressed in liver. Affymetrix software was used to select those probe sets identified as “Present” based on the signal intensities obtained on each individual chip. Using GeneSpring software, this data set was further scrubbed to identify those probe sets that were “Present” on at least four chips in the entire 47 chip set. This reduced the number of probe sets from the initial 8,799 to 5,300.
Of the 5,300 probe sets found to be expressed in liver, most are not steroid responsive (i.e., levels of mRNA do not change in response to corticosteroids). To identify those messages regulated by corticosteroids, the scrubbed data set was input into GeneSpring, which can assess temporal sequences by three analysis tools. The first method involved identification of probe sets that reflected a user defined pattern. For this, we utilized previously identified TAT mRNA expression patterns in liver tissue and GS expression patterns in skeletal muscle. This pattern is defined as a transient increase in message expression beginning at around 2 h with a decline to baseline by about 12 h. This tool initially defined the probe sets designated here as cluster 1. Two other GeneSpring tools, SOM and k-means clustering, were then applied. Both tools divide probe sets into groups based on expression patterns. SOM has the additional benefit of providing an indication of the relationship between the clusters. Both tools defined fundamentally all of the same clusters including the pattern initially identified as cluster 1.
The Affymetrix and GeneSpring software allowed us to identify a total of 196 corticosteroid regulated probe sets from the 5,300 total. These 196 probe sets could be divided, based on temporal patterns of change in expression, into six individual clusters. However, these 196 probe sets actually reflect a change in 153 individual genes, due to redundancy in the Affymetrix chips which often contain multiple probe sets for a single gene. In total, probe set redundancy reduced the number of genes regulated by corticosteroids in this experiment from 196 to 153. However, an additional 17 probe sets represented ESTs which could not be identified using the BLASTn program. Therefore, a final tally of 136 different and identifiable steroid regulated genes were found in these experiments.
One can speculate that the six distinct patterns may reflect differences in mechanisms of regulation by corticosteroids. The first cluster contained several genes related to the metabolic actions of corticosteroids, as well as 10 genes reflecting increased transcription/translation such as nucleophosmin, Nopp140, Y-box Binding protein- a, K-ras, tRNA-Valine synthetase, and nucleosome assembly protein-1 (Table 1). Our previous data analysis and modeling suggests that the enhanced expression indicated by this pattern following the single i.v. dose of MPL is due to a transient stimulation of mRNA synthesis beginning about 2 h and the decline to baseline is due to termination of stimulated synthesis and a moderate rate of return of the mRNA to baseline. The second cluster, like cluster 1, showed increased expression beginning at about 2 h, but exhibited increased expression that was more long-lasting (Fig. 2B). These results suggest a mechanism of stimulated mRNA synthesis between 2 and 12 h and that the mRNAs in this cluster have slower rates of degradation than the first cluster producing the slower rate of return to baseline. The third cluster also shows an increased expression, but this occurs about an hour after the increases seen with clusters 1 and 2. The enhanced expression in cluster 3 is longer lasting than that in cluster 1 genes, but shorter than that seen in cluster 2 (Fig. 2C). A predominant mechanism of stimulated synthesis is likely. A variety of other enzymes such as arginase (urea cycle), carbamyl phosphate synthetase I (urea cycle), and fructose- 1,6-bisphosphatase (gluconeogenesis) are included in this cluster (Table 3).
The fourth cluster is characterized by an initial decline in expression followed by a much later phase of enhanced expression which lasted throughout the 72-h time period examined (Fig. 2D). Given that MPL is entirely cleared from the system and DR(N) is dissipated (Fig. 1) before the enhanced expression begins, the second phase of this cluster is most likely mediated by a product or products produced by earlier interactions of the activated receptor.
The fifth cluster is characterized by a rapid rise in expression followed by an early decline (Fig 2E). All genes in this cluster are cytokines except for one, which is a vascular adhesion molecule, Vcam-1 (Table 5). The fact that all genes in this cluster are related to the immune system suggests that their origin may not be hepatocytes but rather lymphoid cells pooled in liver and included in freezing the whole liver. The mechanism for this early rapid transient increase and decrease in these messages is unclear. One possibility is that MPL alters lymphocyte trafficking, with cells leaving the liver, accounting for the abrupt decrease (Ramakrishnan et al. 2002).
The final cluster exhibits a rapid decline in expression by 2 h which persists for at least 18 h (Fig. 2F). The genes in this cluster range from insulin-like growth factor binding protein acid-labile subunit to regucalcin, a Ca2+ binding protein involved in signal transduction (Table 6). The decline phase of the pattern is slower and longer than cluster 4. In a previous experiment using DNA spotted arrays to measure only the 5.5-h time point in a subset of these same samples, we observed that approximately 60% of the genes that changed showed a decline (Almon et al. 2002). Since both clusters 4 and 6 show a decline at 5.5 h, the percentage of genes in decline at this time is also approximately 60%. Using quantitative Northern hybridization to assess the full time series we observed a somewhat different response pattern of decline for GR, where the decline was faster and persisted even longer (Almon et al. 2002). One difficulty in quantifying declining patterns may be sensitivity. The concentration of GR mRNA in these livers is in the femtomolar/gram range while the concentration of genes such as TAT are in the picomolar/gram range. All genes in this cluster have low intensities.
It is interesting that the time-frame of enhanced or repressed expression of mRNAs in many of these clusters persists long after dosing with MPL. It should be noted (Fig. 1) that the drug is cleared from the system by 8 h, drug-receptor-nuclear binding is dissipated by approximately 10 h, yet some changes in expressed message persist for 72 h.
These results provide a clear indication of the temporal pattern of the cascade of events associated with some processes regulated by corticosteroids. For example, five genes involved in amino group metabolism were found in four different clusters: ornithine decarboxylase (cluster 1); arginase and carbamoyl phosphate synthase (cluster 3); dicarboxylate carrier (cluster 4); and ornithine transcarbamylase (cluster 6). Studies by others have shown that cycloheximide, an inhibitor of protein synthesis, blocks the enhanced expression of the two genes in cluster 3. A logical interpretation is that glucocorticoids first stimulate a separate gene (the primary response), which leads to increased mRNA/protein levels of this primary response product, which subsequently acts to increase transcription of both arginase and carbamoyl phosphate synthase. To identify possible candidates for the required protein intermediate, the genes of these enzymes have been sequenced and examined for sites of dyad symmetry. Such sites frequently bind dimeric regulatory proteins. Both genes include a binding site for C/EBP about 90 bp upstream of the start of the protein-coding region. C/EBP alpha (CAAT enhancer-binding protein) is a transcription factor whose own synthesis is enhanced by corticosteroids (Takiguchi and Mori 1985). Thus a rational and testable hypothesis for the delayed response of cluster 3 enzymes is that the corticosteroid and its receptor bind to genes coding for C/EBP, causing increased synthesis of C/EBP mRNA and ultimately more C/EBP protein. The increased C/EBP protein then binds to genes coding for arginase and carbamoyl phosphate synthase, causing increased (but delayed) synthesis of mRNA for those two enzymes.
It is probable that these six temporal clusters are not all that exist. Developments in software for analysis of arrays, new approaches to cluster analysis, and employment of more sensitive quantitation methods very likely will yield additional time profiles for corticosteroid effects in liver. The online publication of this dataset may provide a valuable resource for developing new approaches (http://microarray.cnmcresearch.org/pgadatatable.asp).
Several decades of research (usually examining specific messages, proteins, and physiological responses) have generated a massive literature which has led to improved insights into mechanisms and dynamics of the anti-inflammatory, immunosuppressive, and diverse effects of physiological and pharmacological doses of corticosteroids. Our pharmacokinetic and pharmacodynamic studies and models (Almon et al. 2002; Ramakrishnan et al. 2002; Sun et al. 1998a, 1998b, 1999) have sought to capture the major systems and rate-limiting steps controlling both rapid and receptor/gene-mediated in vivo effects of therapeutic corticosteroids in animals and/or man leading to the present analysis. The rationalization and utilization of these drugs remains inadequate owing to their low therapeutic index and incomplete knowledge of mechanisms, contributing factors, and interactions among processes and systems. The present microarray analysis provides an incredibly rich portrayal of the diversity of specific genomic effects of one steroid indicating marked changes in 196 out of 8,799 probe sets. Although the literature confirms that corticosteroids alter expression of many of these genes, these results provide a broad picture of the temporal patterns of change that will be important to understanding the cascade of events initiated by the drug. Of considerable interest are our observations that these profiles fall into discrete temporal clusters which suggest a limited number of control processes. While more sensitive bioanalytical and computational tools applied to a larger number of genes may expand these numbers and categories, it is tempting to speculate that perhaps the number may be limited with respect to drug/receptor control of these genomic effects. The similarities within the presently identified clusters are remarkable and further inspection of the altered genes will offer new perspectives on the dynamics of a major pharmacogenomic system.
Acknowledgments
We are indebted to Sara C. Hilmer and Eric P. Hoffman for the expert scientific input and critical manuscript review and Amanda S. Almon for graphics. This work was supported by Grant GM 24211 from the National Institute of General Medical Sciences, NIH. This dataset was developed under the auspices of a grant from the NHLBI/NIH Programs in Genomic Applications (A Functional Genomic Heart and Lung Development Program, U01 HL66614).
Contributor Information
Richard R. Almon, Email: almon@eng.buffalo.edu, Department of Biological Sciences, SUNY at Buffalo, 107 Hochstetter Hall, Buffalo, NY 14260, USA, Tel.: +1-716-6452363 ext 114, Fax: +1-716-6452975.
Debra C. DuBois, Department of Biological Sciences, SUNY at Buffalo, 107 Hochstetter Hall, Buffalo, NY 14260, USA, Tel.: +1-716-6452363 ext 114, Fax: +1-716-6452975
Keri E. Pearson, Research Center for Genetic Medicine, Children’s National Medical Research Center, Washington, DC 20010, USA
Dietrich A Stephan, Research Center for Genetic Medicine, Children’s National Medical Research Center, Washington, DC 20010, USA.
William J. Jusko, Department of Pharmaceutical Sciences, SUNY at Buffalo, Buffalo, NY 14260, USA
References
- Adcock I. Molecular mechanisms of glucocorticosteroid actions. Pulm Pharmacol Ther. 2000;13:115–126. doi: 10.1006/pupt.2000.0243. [DOI] [PubMed] [Google Scholar]
- Almon R, DuBois DC, Brandenburg E, Shi W, Zhang S, Straubinger RM, Jusko WJ. Pharmacodynamics and pharmacogenomics of diverse receptor-mediated effects of methylprednisolone in rats using microarray analysis. J Pharmacokin Pharmacodyn. 2002;29:103–129. doi: 10.1023/a:1019762323576. [DOI] [PubMed] [Google Scholar]
- Baxter J. Advances in glucocorticoid therapy. Adv Intern Med. 2000;45:317–349. [PubMed] [Google Scholar]
- Berdanier CD. Role of glucocorticoids in the regulation of lipogenesis. FASEB J. 1989;3:2179–2183. doi: 10.1096/fasebj.3.10.2666232. [DOI] [PubMed] [Google Scholar]
- Bialas MC, Routledge PA. Adverse effects of corticosteroids. Adverse Drug React Toxicol Rev. 1998;17:227–235. [PubMed] [Google Scholar]
- Burton G, Guan Y, Nagarajan R, McGehee R. Microarray analysis of gene expression during early adipocyte differentiation. Gene. 2002;293:21–31. doi: 10.1016/s0378-1119(02)00726-6. [DOI] [PubMed] [Google Scholar]
- DePrimo S, Diehn M, Nelson J, Reiter R, Matese J, Fero M, Tibshirani R, Brown P, Brooks J. Transcriptional programs activated by exposure of human prostate cancer cells to androgen. Genome Biol. 2002;3:32. doi: 10.1186/gb-2002-3-7-research0032. [DOI] [PMC free article] [PubMed] [Google Scholar]
- Ebling WF, Szefler SJ, Jusko WJ. Methylprednisolone disposition in rabbits: Analysis, prodrug conversion, reversible metabolism and comparison with man. Drug Metab Dispos. 1985;13:296–304. [PubMed] [Google Scholar]
- Evans R. The steroid and thyroid hormone superfamily. Science. 1988;240:889–895. doi: 10.1126/science.3283939. [DOI] [PMC free article] [PubMed] [Google Scholar]
- Frauman AG. An overview of the adverse reactions to adrenal corticosteroids. Adverse Drug React Toxicol Rev. 1996;15:203–206. [PubMed] [Google Scholar]
- Gustafsson J, Carlsteat-Duke J, Poellinger L, Okret S, Wikstrom AC, Bronnegard M, Gillner M, Dong Y, Fuxe K, Cintra A. Biochemistry, molecular biology, and physiology of the glucocorticoid receptor. Endocr Rev. 1987;8:185–234. doi: 10.1210/edrv-8-2-185. [DOI] [PubMed] [Google Scholar]
- McMahon M, Gerich J, Rizza R. Effects of glucocorticoids on carbohydrate metabolism. Diabetes Metabol Rev. 1988;4:17–30. doi: 10.1002/dmr.5610040105. [DOI] [PubMed] [Google Scholar]
- Moran J, Li Y, Hill A, Mounts W, Miller C. Gene expression changes during mouse skeletal myoblast differentiation revealed by transcriptional profiling. Physiol Genomics. 2002;10:103–111. doi: 10.1152/physiolgenomics.00011.2002. [DOI] [PubMed] [Google Scholar]
- Nadadur S, Kodavanti U. Altered gene expression profiles of rat lung in response to an emission particulate and its metal constituents. J Toxicol Environ Health Part A. 2002;65:1333–1350. doi: 10.1080/00984100290071559. [DOI] [PubMed] [Google Scholar]
- Pannen BH, Robotham JL. The acute-phase response. New Horizons. 1995;3:183–197. [PubMed] [Google Scholar]
- Parmentier-Batteur S, Jin K, Xie L, Mao X, Greenberg D. DNA microarray analysis of cannabinoid signaling in mouse brain in vivo. Mol Pharmacol. 2002;62:828–835. doi: 10.1124/mol.62.4.828. [DOI] [PubMed] [Google Scholar]
- Prough RA, Linder MW, Pinaire JA, Xiao GH, Falkner KC. Hormonal regulation of hepatic enzymes involved in foreign compound metabolism. FASEB J. 1996;10:1369–1377. doi: 10.1096/fasebj.10.12.8903507. [DOI] [PubMed] [Google Scholar]
- Ramakrishnan R, DuBois DC, Almon RR, Pyszczynski NA, Jusko WJ. Pharmacodynamics and pharmacogenomics of methylprednisolone during seven-day infusion in rats. J Pharmacol Exper Ther. 2002;300:245–256. doi: 10.1124/jpet.300.1.245. [DOI] [PubMed] [Google Scholar]
- Schimmer BP, Parker KL. Adrenocorticotrophic hormones; adrenocortical steroids and their synthetic analogs; inhibitors of the synthesis and actions of adrenocortical hormones. In: Hardman JG, Limbird LE, Molinoff PB, Ruddon RW, Goodman Gilman A, editors. Goodman & Gilman’s The pharmacological basis of therapeutics. McGraw Hill; New York: 1996. pp. 1459–1486. [Google Scholar]
- Shalev A, Pise-Masison C, Radonovich M, Hoffmann S, Hirshberg B, Brady J, Harlan D. Oligonucleotide microarray analysis of intact human pancreatic islets: Identification of glucose-responsive genes and a highly regulated TGFbeta signaling pathway. Endocrinology. 2002;143:3695–3698. doi: 10.1210/en.2002-220564. [DOI] [PubMed] [Google Scholar]
- Sun Y-N, DuBois DC, Almon RR, Pyszczynski NA, Jusko WJ. Dose-dependence and repeated-dose studies for receptor/gene-mediated pharmacodynamics of methylprednisolone on glucocorticoid receptor down-regulation and tyrosine aminotransferase induction in rat liver. J Pharmacokin Biopharm. 1998a;26:619–648. doi: 10.1023/a:1020746822634. [DOI] [PubMed] [Google Scholar]
- Sun Y-N, DuBois DC, Almon RR, Jusko WJ. Fourth-generation model for corticosteroid pharmacodynamics: A model for methylprednisolone effects on receptor/gene-mediated glucocorticoid receptor down-regulation and tyrosine aminotransferase induction in rat liver. J Pharmacokin Biopharm. 1998b;26:289–317. doi: 10.1023/a:1023233409550. [DOI] [PubMed] [Google Scholar]
- Sun Y-N, McKay LI, DuBois DC, Jusko WJ, Almon RR. Pharmacokinetic/pharmacodynamic models for corticosteroid receptor down-regulation and glutamine synthetase induction in rat skeletal muscle by a receptor/gene-mediated mechanism. J Pharmacol Exp Ther. 1999;288:720–728. [PubMed] [Google Scholar]
- Takiguchi M, Mori M. Transcriptional regulation of genes for ornithine cycle enzymes. Biochem J. 1985;312:649–659. doi: 10.1042/bj3120649. [DOI] [PMC free article] [PubMed] [Google Scholar]