Abstract
A two-compartment closed model was used to characterize the cell trafficking behavior of helper T cells in response to various single doses of methylprednisolone. Steroids are assumed to inhibit the circadian-determined cell return from extravascular sites to blood in a classic inhibitory pattern reflected by an IC50. The rate of cell efflux from tissues is modeled with a cosine function having a period of 24 hr and a maximum at about 1 AM. Nonlinear least-squares regression employing differential equations was used to analyze helper T-cell data from three human studies from our laboratory. The IC50 value of methylprednisolone of 12–19 ng/ml approximates receptor KD values. Simulations were performed to demonstrate the log-linear role of steroid dose or AUC on the integral of effect of helper T cells over a wide range of methylprednisolone doses. This pharmacodynamic model allows flexibility for characterizing any type of steroid dosing regimen and is relevent in describing complex response data for corticosteroid immunosuppressive effects
Keywords: methylprednisolone, helper T lymphocytes, pharmacodynamics, cell trafficking, chronopharmacology, immunosuppression
INTRODUCTION
Corticosteroids have profound effects on circulating immunocompetent cells and are therefore often used for their immune-modulating properties. Single doses of corticosteroids result in a transient lymphopenia, basopenia, and eosinopenia. The decrease in the number of lymphocytes is primarily due to redistribution of these cells out of the vasculature and into extravascular lymphoid tissues (1–3). Lymphocytes, however, are a heterogeneous population and the T lymphocytes are depleted to a greater extent than the B lymphocytes, with the helper T subset exhibiting the most pronounced reduction following a corticosteroid dose (1,4,5). This particular T cell subset is an integral component in a variety of pathophysiologic states and immunologic responses, including allograft rejection. Therefore, it is important to understand the dose- and time-response pattern of these cells following corticosteroid administration.
A pharmacodynamic model for basophil cell trafficking following corticosteroid administration was developed previously (6). In this paper, we extend the basophil model to incorporate the baseline circadian rhythm of helper T cells and to describe their disposition following an intravenous dose of methylprednisolone. This model extends and supercedes the helper T cell model previously developed in our laboratory (7,8). It provides a more mechanistic description of the circadian rhythm governing cell influx into blood and the use of differential equations allows greater flexibility for application of the model for any pharmacokinetic process describing drug input and disposition.
THEORETICAL
Numerous studies have demonstrated a circadian rhythm of helper T lymphocytes in the bloodstream, with peak cell counts occurring during the night and nadirs during the day (8–11). The cells equilibrate between the intravascular compartment and extravascular sites such as the thoracic duct lymph, certain areas of the spleen, lymph nodes, and bone marrow (2). If the extravascular sites are considered as one large homogeneous compartment, a two-compartment model (Fig. 1) adequately describes the physiologic movement of cells between the blood and the extravascular sites. Cell movement out of the bloodstream is directed by a first-order rate constant kt, and is directly proportional to the number of helper T cells in the blood (TH). Cell return to the blood is governed by a circadian rhythm, with the overall trafficking process described by
Fig. 1.
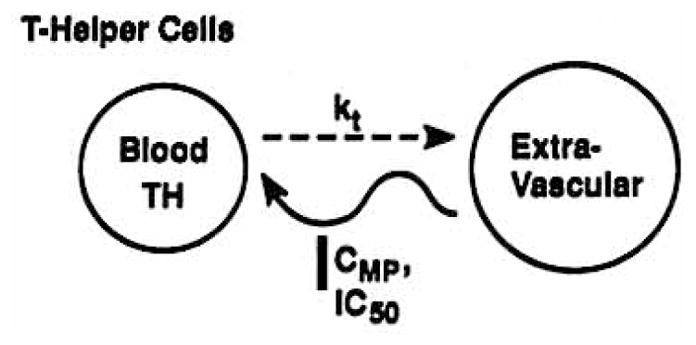
Cell trafficking model where helper T cells distribute between a blood and extravascular compartment with kt, as a first-order rate constant and CMP and IC50 representing plasma and 50% inhibitory concentrations of methylprednisolone acting upon the circadian return of cells to blood.
| (1) |
where Rm is the mean return rate of helper T cells into the blood, Rb is the amplitude of this rate, TH is the number of helper T cells per volume of blood, T is the clock time, tz is the acrophase or peak time of the function, and the ratio 2π/24 converts clock time to radians.
Following the administration of intravenous methylprednisolone, there is an immediate decline in vascular helper T lymphocytes. The nadir usually occurs around 4 to 6 hr after the dose, and eventually cell counts return to baseline values. It is hypothesized that corticosteroids distribute rapidly to sites of action and directly inhibit the return of helper T cells to the blood without affecting the egress of cells from the blood. Studies with labeled lymphocytes in rats have shown this to be the primary mechanism of effect of prednisolone (12). This inhibition is assumed to be reversible and concentration dependent and can be described by
| (2) |
where I(t) is the inhibitory fraction, CMP is the concentration of methylprednisolone in plasma at time t, and IC50 is the methylprednisolone plasma concentration that produces a 50% inhibition of the circadian rate of return of helper T lymphocytes to the vascular compartment. Methylprednisolone concentrations are usually monoexponential after single doses and can be described by
| (3) |
where V is the volume of distribution and k is the elimination rate constant.
By inserting Eq. (2) into Eq. (1), helper T cell trafficking following an intravenous dose of methylprednisolone can be described by
| (4) |
A net response parameter was developed to determine the overall effect of various doses of methylprednisolone on helper T cells. This parameter ABEC is defined as the area between the baseline and effect curves
| (5) |
where AUCB0–t is the area under the baseline curve from time 0 to time t, and AUCE0–t is the corresponding area under the effect curves.
The previous model (7) directly characterizes helper T concentrations in blood (TH) using the following relationship:
| (6) |
where Rm and Rb represent the mean and amplitude of cell concentrations in blood (rather than entry rate) and T and tz are as previously defined, and TH0 is the initial helper T cell count. That model (Eq. 6) characterizes changes in the absolute number of helper T cells, whereas the present model describes changes in the rate of cell movement.
The baseline T cell circadian parameters for the two models can be interrelated by examination of Eq. (1) at pseudosteady state
| (7) |
, the average helper T cell concentrations over 24 hr, can be described by
| (8) |
Since is common to both models, and was directly used to describe helper T cell concentrations in the Dunn et al. (7) model, the Rm and Rb parameters can be interconverted via Eq. (8).
METHODS
The pharmacodynamic model was developed using the data of Fisher et al. (13). Briefly, six healthy male volunteers received 20 mg of methylprednisolone as the sodium succinate salt at either 8 AM or 4 PM, or no drug, in a randomized fashion. Subjects were synchronized to an activity period from 8 AM to midnight and a rest period from midnight to 8 AM the following morning. A sufficient number of blood samples was collected over a 24-hr period to characterize the corticosteroid and helper T cell profiles. Methylprednisolone plasma concentrations were determined using an HPLC assay (13). Helper T cell counts were determined by reacting the whole blood sample with monoclonal antibody (CD4+), lysing the sample, and subsequently analyzing the cells on a flow cytometer. The data from studies in normal (14) and obese men (7) were also utilized to evaluate the model. The dose versus helper-T cell data obtained in one previous study (14) were not reported at that time. The methods of all of these studies are similar.
The PCNONLIN computer program (Statistical Consultants Inc., Lexington, KY) was used to fit the model to the experimental data. Examination of the helper T cell count versus time plots assisted in obtaining initial conditions and parameter estimates. Simulations of expected responses of helper T cells to a wide range of methylprednisolone doses (0 to 1000 mg) was done using PCNONLIN. Average parameters for the kinetic and dynamic constants were used in the simulations.
Statistical analysis included a paired t test to compare parameters between models, and a one-way ANOVA to evaluate pharmacodynamic parameters between three studies. All results were considered significant at the P < 0.05 level.
RESULTS
Model Fitting
In all three studies from our laboratory methylprednisolone concentration vs. time data could adequately be described by a monoexponential equation (7,13,14). In the Fisher et al. (13) study, the average V and k were 84 L and 0.29 hr−1 at 8 AM, and were 90 L and 0.32 hr−1 at 4 PM.
For the initial model evaluation, the T cell data from Fisher et al. (13) were evaluated using the previous [Eq. (6)] and present models. For ease of comparison of the two models, IC50 and kt were not allowed to vary between 8 AM and 4 PM treatments during the fitting process. Previously, these values were not found to be significantly different between treatments when allowed to vary (13). The experimental and model-fitted data for baseline, 8 AM, and 4 PM helper T-cell numbers are shown for a representative subject in Fig. 2. The fitted lines generated by the two models were virtually identical. A comparison of the average PCNONLIN-generated parameters can be found in Table I. Only the acrophase (tz), kt, and IC50 values can be directly compared between the two models, as the model parameters Rm and Rb have different units and meanings. The kt values of approximately 0.55 hr−1 are not different; however, the IC50 values of 11.9 ng/ml for the new model and 7.5 ng/ml for the Dunn model and the acrophase values of 17.3 and 19.3 hr are significantly different as compared by the paired t test. By application of Eq. (8), it can be shown that the baseline circadian parameters (Rm and Rb) for the two modeling approaches are virtually identical.
Fig. 2.
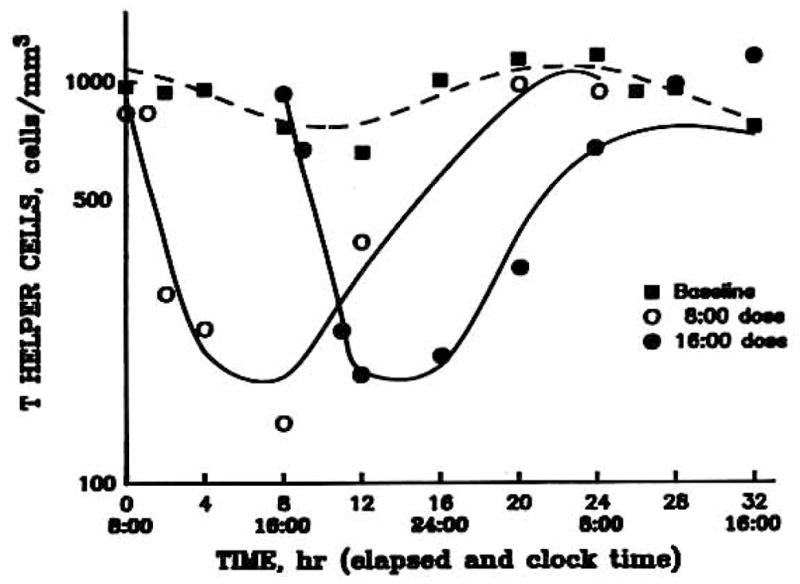
Time course of helper T cell numbers in blood of a normal volunteer during a baseline data (■) and following iv administration of 20 mg methylprednisolone at 8 AM (○) and 4 PM (●) on separate days.
Table I.
Average Pharmacodynamic Parameters for Methylprednisolone Effects on Helper T Cells Using Two Modelsa
| Model | kt(hr−1) | IC50(ng/ml) | Rm | Rb | tz(hr) |
|---|---|---|---|---|---|
| Previous [Eq. (6)] | 0.57 ± 0.20 | 7.52 ± 3.79b | 872 ± 239 | 178 ± 58 | 19.3 ± 4.4b |
| (cells/mm3) | |||||
| Present [Eq. (4)] | 0.54 ± 0.08 | 11.9 ± 4.8 | 477 ± 137 | 99 ± 27 | 17.3 ± 4.5 |
| (cells/mm3/hr) | |||||
Data are presented as mean ± standard deviation for 6 subjects. Data obtained from Fisher et al. (13).
p < 0.05 as compared by the paired t test.
Helper T cell counts in six obese men at baseline and following a 0.6 mg/kg dose of methylprednisolone were evaluated as shown in Fig. 3 (7). In addition, the data for six healthy males following 0, 10, or 40 mg doses of methylprednisolone were also used (Fig. 4). The helper T cell counts for the individual subjects were averaged at each time point and then used in the model-fitting process. Each subject’s data were also fitted separately, and the individual PCNONLIN-generated model parameters were then averaged together. In each case, the baseline and all doses were fitted simultaneously. The graph illustrates the characteristic suppression pattern and return patterns of helper T cells following the intravenous methylprednisolone doses.
Fig. 3.
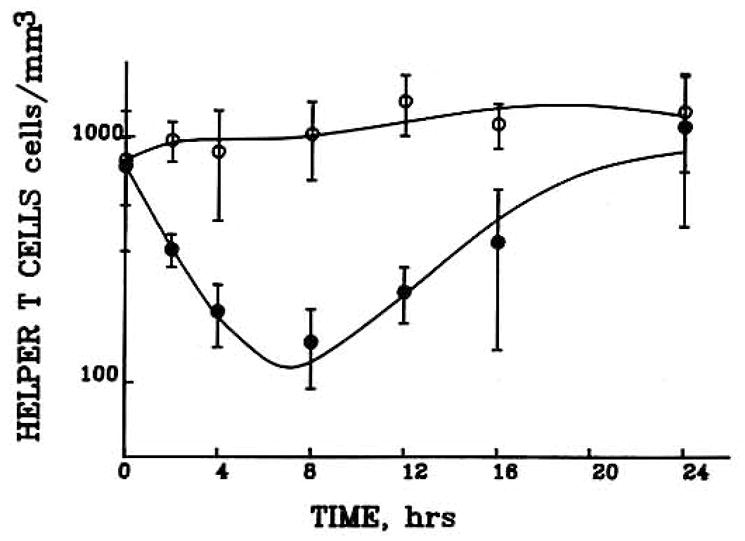
Time course of helper T cell concentrations in blood in obese male volunteers during a baseline day (no exogenous cortiscosteroid) and following iv administration of 40 mg dose of methylprednisolone. Symbols depict mean ±SD of cell numbers at each time point.
Fig. 4.
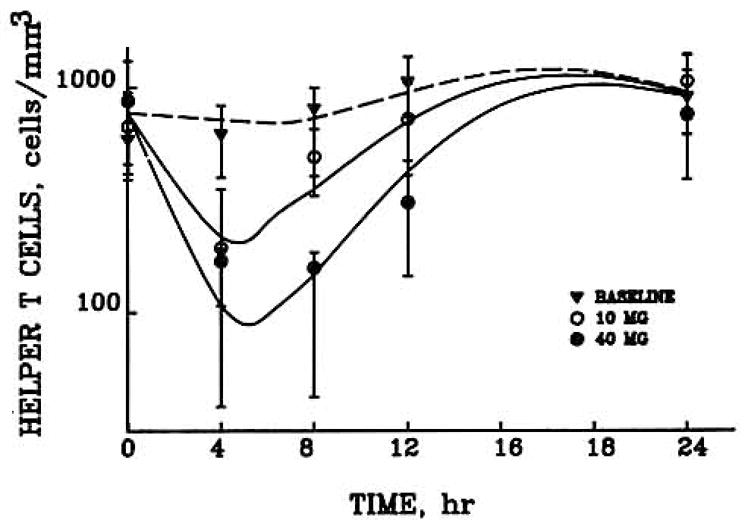
Time course of helper T cell numbers in normal volunteers during baseline (no exogeneous steroid) and after 10 (○) and 40 (●) mg iv doses of methylprednisolone.
The data and fitted curves in Figs. 2–4 may be divided into three distinct areas. Initially following the intravenous bolus of methylprednisolone, the CMP is much greater than the IC50 value, resulting in an I(t) value that approaches 0 [Eq. (2)]. Therefore, the initial part of the curves is determined by
| (9) |
This provided the rationale for use of the exponential function (TH = TH0 · e−kt·t) for Eq. (6). As CMP approaches the IC50 value, helper T cells reach a brief equilibrium, the nadir. In the final portion of the curve, the corticosteroid has been appreciably eliminated so that plasma concentrations are well below the IC50. Therefore, I(t) approaches 1 in Eq. (2), and the final portion of the curve approaches and reestablishes the baseline values.
The mean model parameters for each of the three studies are listed in Table II. Despite the small number of data points, and the sample of six men per study, it is possible to adequately describe each set of data with five pharmacodynamic parameters. These values are consistent across time, dose, and subjects. No statistically significant differences were detected by ANOVA between studies for any of the model parameters.
Table II.
Average Pharmacodynamic Parameters for Methylprednisolone Effects on Helper T Cells from Three Studies in Healthy Mena
| Study | kt(hr−1) | IC50(ng/ml) | Rm(cells/mm3/hr) | Rb(cells/mm3/hr) | tz(hr) |
|---|---|---|---|---|---|
| Dunn et al. (7) | 0.47 ± 0.10 | 18.8 ± 10.8 | 484 ± 107 | 127 ± 24 | 18.9 ± 2.8 |
| Fisher et al. (13) | 0.54 ± 0.08 | 11.9 ± 4.8 | 477 ± 137 | 99 ± 27 | 17.3 ± 4.5 |
| Kong et al. (14) | 0.56 ± 0.09 | 13.1 ± 8.4 | 502 ± 113 | 138 ± 49 | 16.5 ± 0.8 |
n = 6 for each study. No significant differences as compared by ANOVA.
Extrapolations
A simulation of the effects of a wide range of methylprednisolone doses on helper T cell disposition was performed (Fig. 5). As the dosage of steroid increases, the degree of suppression, time to nadir, and time to return to baseline also increase. Following the 1 mg dose, the average IC50 value of 11.9 ng/ml is exceeded for less than a minute, resulting in a relatively short period of helper T cell decline, an early nadir, and a return to baseline values within a 20-hr period. However, with the 500 mg and greater doses, a much greater degree of suppression is observed, with the nadir occurring at about 10 hr postdose, and by 24 hr the cell counts have not yet returned to baseline values. It is interesting to note from the graph that the 1000 mg dose barely increases the degree of suppression but rather prolongs both the time to nadir and the time to return to baseline cell counts.
Fig. 5.
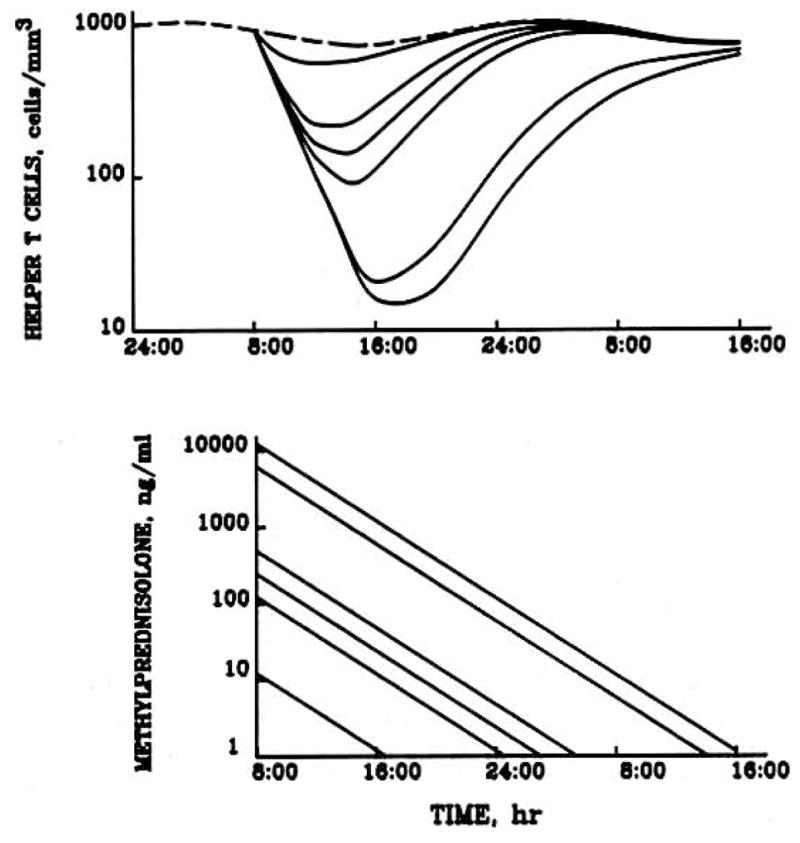
Model simulations of the expected behavior of helper T cell numbers in blood (upper graph) including baseline (dashed line) and serum methylprednisolone concentrations (lower graph) following iv methylprednisolone doses of 0, 1, 10, 20, 40, 500, and 1000 mg (upper to lower curves in top graph, conversely in lower graph).
The overall response to methylprednisolone during a 24-hr period was measured as ABEC (Fig. 6). With the exception of the 500 and 1000 mg doses, all doses produced responses whose duration were less than 24 hr. The theoretical line is sigmoidal; it is initially flat at low doses, followed by a log-linear segment for doses greater than 10 mg. This log-linear portion extends indefinitely, as ABEC never reaches a plateau. With larger doses of methylprednisolone, depression of helper T cell counts will be increasingly prolonged, resulting in larger values of ABEC.
Fig. 6.
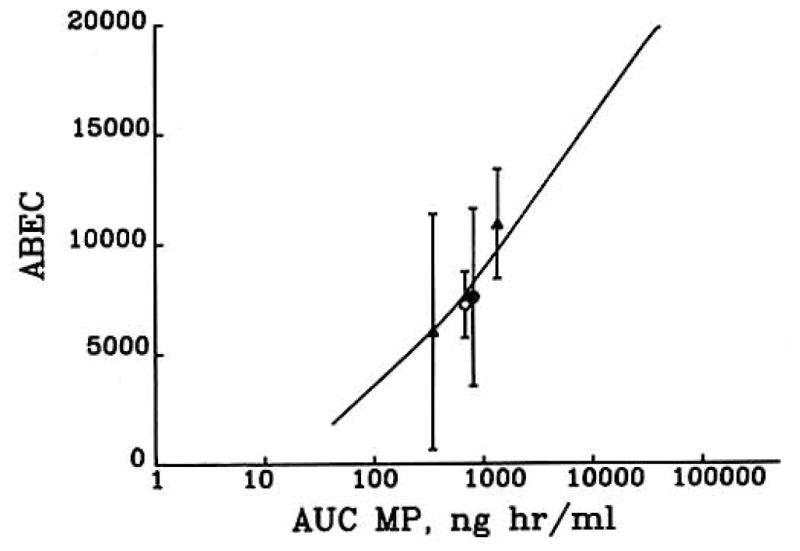
Relationship between the area between the baseline and effect curve (ABEC) for helper T cell suppression and AUC of methylprednisolone based on model predictions from Fig. 5 and actual values from Refs. 7 (○), 13 (●), and 14 (▲).
DISCUSSION
The pharmacodynamic model for helper T cell trafficking was developed to quantitatively describe helper T cell movement between the blood and extravascular sites in response to exogenous corticosteroids. It successfully incorporates the normal circadian rhythm of helper T cells and is capable of characterizing corticosteroid-induced lymphopenia. This model improves upon the Dunn et al. (7) model as it is less empirical and allows for greater flexibility of the corticosteroid disposition function. The Dunn model required that the corticosteroid be given as an intravenous bolus, whereas the present model can accommodate any dosage regimen, providing that a pharmacokinetic function for plasma drug concentrations can be supplied in Eq. (2) in place of Eq. (3). Another advantage of the present model is that baseline conditions and increasing doses can be accommodated readily for simultaneous fitting of all parameters. This requires the assumption or determination that the relevant parameters are stationary.
One uncertainty for possible application of the present model to chronic dosing situations is whether the baseline circadian pattern will remain consistent. Likely complications are from the effects of an altered circadian rhythm of cortisol which may be influencing lymphocyte patterns (1–3) and possible down-regulation of corticosteroid receptors which might change the IC50 values.
The derivation of the model predicts that if the plasma corticosteroid concentrations reflect the free cytosolic drug concentrations, then the IC50 value should be of similar magnitude to the drug-receptor dissociation constant KD. The IC50 values of 12 to 19 nM closely relate to the KD values of 9.8 and 43 nM previously reported in the literature (15, 16). Thus the IC50 values obtained during the fitting process are consistent with receptor binding of the steroid.
The presence of a circadian rhythm of helper T lymphocytes has been noted in several studies (8–11). A sine or cosine function has been commonly employed to describe the circadian rhythm. The peak helper T cell count determined by cosinor analysis has been reported to occur between 9 PM and 2 AM (17, 18). Our average value is 1 AM (Table II). Seasonal differences may occur in both the amplitude and acrophase of the circadian rhythm (17, 18). Our laboratory conducted studies (7, 13, 14) during the month of January which promotes consistency among our pharmacodynamic parameters, The similarity of our acrophase values in three studies in normal healthy volunteers suggests that circadian rhythms are reproducible as long as the season and sleep cycles are kept constant.
Corticosteroid effects on lymphocytes are mediated by cytoplasmic receptors (19). The result is an alteration in the cell trafficking pattern of helper T lymphocytes, with sequestration of these cells within extravascular sites (17). The exact mechanism of cell redistribution is unclear but may be due to changes in the cell membrane, cell surface, or capillary endothelium (1–3).
Simulations of helper T cell responses to corticosteroids predict that those doses of methylprednisolone producing plasma concentrations in excess of the IC50 value for extended periods of time will result in greater overall suppression compared to smaller doses (see Fig. 5). The dose- response curve (see Fig. 6) is actually sigmoidal. For doses less than 10 mg, the increase in response with an increase in dose is less than for those doses greater than 10 mg. Above 10 mg the net response increases linearly with the log AUC of methylprednisolone.
Our laboratory has reported on helper T cell response to intravenous methylprednisolone doses of between 10 and 40 mg. The average data points from these studies are plotted in Fig. 6, and the points fall relatively close to the theoretical line. A review of Figs. 2–4 shows that both the extent of suppression and duration of suppression increase with increasing steroid doses. Zweiman et al. (3) investigated the effects of a single intravenous 1 mg/kg does of methylprednisolone. Helper T cells were counted at time 0, and at 4 and 24 hr after the dose. Helper T cell counts were significantly lower than baseline values at both the 4- and 24-hr time points. The effect of a single 1-g intravenous dose of methylprednisolone on T lymphocytes was studied in six rheumatoid arthritis patients (20). The nadir following the dose occurred around 6 hr, and at 24 hr T cell counts were reduced by about 50% compared to the baseline values. Interestingly, the simulated methylprednisolone concentration at 24 hr is approximately equal to the IC50 value. Our simulations for a 1-g dose of intravenous methylprednisolone on helper T lymphocytes results in a similar response pattern.
The concordance of literature results with our simulations suggests that the model is capable of predicting helper T cell response to a broad array of corticosteroid doses. Although the pharmacodynamic model was specifically developed to characterize helper T cell movement, it may be extended to other lymphocyte populations which are also rhythmic. The model can also be applied to describe other physiologic systems that are affected by corticosteroids and demonstrate circadian rhythms in synthesis or secretion of affected compounds. Particular strengths of the present model are the more mechanistically based circadian function, the independence of the pharmacokinetic and pharmacodynamic elements of the model, and the ability to employ identical equations to simultaneously describe the effects of different doses of corticosteroids by adjustment of the initial conditions of the pharmacokinetic equations [Eq. (3)].
Acknowledgments
The assistance of Jeffrey A. Wald and the clinical and pharmacokinetic collaboration of the coinvestigators of Dunn et al. (7), Fisher et al. (13), and Kong et al. (14) are appreciated.
Supported in part by grant GM 24211 from the National Institutes of General Medical Sciences,
References
- 1.Fauci AS, Dale DC. The effect of hydrocortisone on the kinetics of normal human lymphocytes. Blood. 1975;46:235–243. [PubMed] [Google Scholar]
- 2.Fauci AS. Mechanisms of corticosteroid action on lymphocyte subpopulations. Immunology. 1975;28:669–680. [PMC free article] [PubMed] [Google Scholar]
- 3.Zweiman B, Atkins PC, Bedard P, Flaschen SL, Lisak RP. Corticosteroid effects on circulating lymphocyte subset levels in normal humans. J Clin Immunol. 1984;4:151–155. doi: 10.1007/BF00915049. [DOI] [PubMed] [Google Scholar]
- 4.Slade JD, Hepburn B. Prednisone-induced alterations of circulating human lymphocyte subsets. J Lab Clin Med. 1983;101:479–487. [PubMed] [Google Scholar]
- 5.Hepburn B, Slade JD. Effect of divided daily dose prednisone therapy on circulating T cell subsets. J Rheumatol. 1987;14:19–22. [PubMed] [Google Scholar]
- 6.Wald JA, Salazar DE, Cheng H, Jusko WJ. Two-compartment basophil cell trafficking model for methylprednisolone pharmacodynamics. J Pharmacokin Biopharm. 1991;19:521–536. doi: 10.1007/BF01062961. [DOI] [PubMed] [Google Scholar]
- 7.Dunn TE, Ludwig EA, Slaughter RL, Camara DS, Jusko WJ. Pharmacokinetics and pharmacodynamics of methylprednisolone in obesity. Clin Pharmacol Ther. 1991;49:536–549. doi: 10.1038/clpt.1991.64. [DOI] [PubMed] [Google Scholar]
- 8.Yamashita SK, Ludwig EA, Middleton E, Jr, Jusko WJ. Lack of pharmacokinetic and pharmacodynamic interactions between ketoconazole and prednisolone. Clin Pharmacol Ther. 1991;49:558–570. doi: 10.1038/clpt.1991.66. [DOI] [PubMed] [Google Scholar]
- 9.Levi FA, Canon C, Touitou Y, Sulon J, Mechkouri M, Ponsart ED, Touboul JP, Vannetzel JM, Mowzowicz I, Reinberg A, Mathe G. Circadian rhythms in circulating T lymphocyte subsets and plasma testosterone, total and free cortisol in five healthy men. Clin Exp Immunol. 1988;71:329–335. [PMC free article] [PubMed] [Google Scholar]
- 10.Levi FA, Canon C, Touitou Y, Reinberg A, Mathe G. Seasonal modulation of the circadian time structure of circulating T and natural killer lymphocyte subsets from healthy subjects. J Clin Invest. 1988;81:407–413. doi: 10.1172/JCI113333. [DOI] [PMC free article] [PubMed] [Google Scholar]
- 11.Bertouch JV, Roberts-Thompson PJ, Bradley J. Diurnal variation of lymphocyte subsets identified by monoclonal antibodies. Br J Med. 1983;286:1171–1172. doi: 10.1136/bmj.286.6372.1171. [DOI] [PMC free article] [PubMed] [Google Scholar]
- 12.Cox JH, Ford WL. The migration of lymphocytes across specialized vascular epithelium. IV. Prednisolone acts at several points on the recirculation pathways of lymphocytes. Cell Immunol. 1982;66:407–422. doi: 10.1016/0008-8749(82)90190-3. [DOI] [PubMed] [Google Scholar]
- 13.Fisher LE, Ludwig EA, Wald JA, Sloan R, Middleton E, Jr, Jusko WJ. Pharmacokinetics and pharmacodynamics of methylprednisolone when administered at 8 AM vs. 4 PM. Clin Pharmacol Ther. 1992;51:677–688. doi: 10.1038/clpt.1992.80. [DOI] [PMC free article] [PubMed] [Google Scholar]
- 14.Kong A, Ludwig EA, Slaughter RL, Distefano PM, Demasi J, Middleton E, Jr, Jusko WJ. Pharmacodynamic modeling of direct suppression of methylprednisolone on serum cortisol and whole blood histamine in man. Clin Pharmacol Ther. 1989;46:616–628. doi: 10.1038/clpt.1989.196. [DOI] [PMC free article] [PubMed] [Google Scholar]
- 15.Engler JM, Chestnut RY, Bust GC, Eil C. The effects of triacetyloleandomycin and oleandomycin phosphate on the glucocorticoid receptors in cultured skin fibroblasts. J Allergy Clin Immunol. 1985;75:395–400. doi: 10.1016/0091-6749(85)90078-8. [DOI] [PubMed] [Google Scholar]
- 16.Rohdewald P, Moleman HW, Hochaus G. Affinities of glucocorticoids for glucocorticoid receptors in the human lung. Agents Actions. 1989;17:290–291. doi: 10.1007/BF01982622. [DOI] [PubMed] [Google Scholar]
- 17.Haus E, Lakatua DJ, Swoyer J, Sackett-Lundeen L. Chronobiology in hematology and immunology. Am J Anal. 1983;168:467–517. doi: 10.1002/aja.1001680406. [DOI] [PubMed] [Google Scholar]
- 18.Abo T, Kawate T, Itoh K, Kumagai K. Studies on the bioperiodicity of the immune response. J Immunol. 1981;126:1360–1363. [PubMed] [Google Scholar]
- 19.Steiner AE, Wittliff JL. Concentration of glucocorticoid receptor sites in normal human lymphocytes. Clin Chem. 1986;32:80–83. [PubMed] [Google Scholar]
- 20.Fan PT, Yu DTY, Clements PJ, Fowlston S, Eisman J, Bluestone R. Effect of corticosteroids on the human immune response: comparison of one and three gram intravenous pulses of methylprenisolone. J Lab Clin Med. 1978;91:625–634. [PubMed] [Google Scholar]


