

Abstract
Four basic models for characterizing indirect pharmacodynamic responses after drug administration have been developed and compared. The models are based on drug effects (inhibition or stimulation) on the factors controlling either the input or the dissipation of drug response. Pharmacokinetic parameters of methylprednisolone were used to generate plasma concentration and response-time profiles using computer simulations. It was found that the responses produced showed a slow onset and a slow return to baseline. The time of maximal response was dependent on the model and dose. In each case, hysteresis plots showed that drug concentrations preceded the response. When the responses were fitted with pharmacodynamic models based on distribution to a hypothetical effect compartment, the resulting parameters were dose-dependent and inferred biological implausibility. Indirect response models must be treated as distinct from conventional pharmacodynamic models which assume direct action of drugs. The assumptions, equations, and data patterns for the four basic indirect response models provide a starting point for evaluation of pharmacologic effects where the site of action precedes or follows the measured response variable.
Keywords: pharmacodynamics, indirect response, effect compartment model, sigmoid Emax model, methylprednisolone
INTRODUCTION
The growing body or phannacokinetic/phannacodynamic literature emphasizes the important niche created by phannacodynamic modeling. Only a small percentage or studies have jointly measured drug levels and pharmacologic effects. When the pharmacological effects are seen immediately and are directly related to the drug concentration, a phannacodynamic model such as a linear model, an model, or a sigmoid Ema. model is applied to characterize the relationship between drug concentrations and effect. When the pharmacologic response takes time for development, and the observed response is not apparently related to plasma concentrations of the drug, a "link model" is usually applied to relate the pharmacokinetics of the drug with its pharmacodynamics (1). The most commonly encountered application presently involves using the effect-compartment approach which assumes that the rate of dtug distribution to and from the hypothetical effect site will determine the rate of onset of effect. Following the modeling of d-tubocurarine by Shei ner et al. (2), several other methods have been investigated including the semiparametric approach (3). This topic has been the subject of comprehensive reviews (4,5).
Many drug responses, however, may be considered indirect in nature. Earliest characterizations of an indirect response examined the anticoagulant effect of warfarin (6,7). Other response models such as direct suppression models for glucocorticoid responses have been developed (8). A two-compartment closed model has been described for the trafficking of basophils following methylprednisolone exposure (9). The trafficking of helper T lymphocytes (10) and natural killer cells (11) due to glucocorticoid exposure have also been modeled. Other processes such as prolactin suppression (12) and osteocalcin suppression (13) have also been studied. More complex models of indirect pharmacologic action such as the receptor/gene-mediated induction of the enzyme tyrosine aminotransferase (TAT) require a multi-step cascade of events (14).
In each of the above situations, following the dose of the drug, there is a slow accretion of the drug response which is governed by the inhibition or stimulation of factors controlling this response. In actuality, these can produce either an increase or decrease in the observed response variable depending on whether lhe input or disposition process is inhibited or stimulated. In the present report we propose a family of four basic indirect response models to account for the most commonly observed types of responses. Our main purpose is to present the theoretical basis and observed response patterns for these basic indirect response models. A second objective is to show the limitations of applying the sigmoid Emax model using the effect-compartment approach (distributive sigmoid Emax model) to fit data that are described by indirect models.
THEORETICAL
The basic premise of this study is that a measured response (R) to a drug may be produced by indirect mechanisms; for example, factors controlling the input or production (kin) of the response variable may be either inhibited or stimulated, or the determinants of loss (kout) of the response vaiiable may be inhibited or stimulated. The rate of change of the response over time with no drug present can be described by
| (1) |
where kin represents the zero-order constant for production of the response and kout defines the first-order rate constant for loss of the response. It is assumed that kin and kout fully account for production and loss of the response. The response variable R may be a directly measured entity or an observed response which is immediately proportional to the concentration of R. In Fig. 1, Model I and Model 2 represent inhibitory process that operate according to the classical inhibitory function, I(t)
| (2) |
where Cp represents the plasma concentration of the drug as a function of time and ICSG is the drug concentration which produces 50% of maximum inhibition achieved at the eftect site. Accordingly, the rate of change of drug response in Model 1 can be described by
| (3) |
Model 2 describes drug response that results from inhibition of the factors controlling the dissipation of the response variable according to
| (4) |
Note that in Models 1 and 2, an Emax for maximum inhibition is implied by the assumption that inhibition can completely negate the functioning of the affected factors, i.e., when Cp » IC50, I(t) approaches zero. In addition, note that I(t) approaches unity when Cp « EC50.
Fig 1.

Four basic indirect response models characterized by either inhibition or stimulation or the response variable. The shapes of the responses are depicted on the right of each model.
In Fig. I, Model 3 and Model 4 represent proceses that stimulate the factors controlling drug response and operate according to the stimulation function, S(t)
| (5) |
where Emax represents the maximum effect attributed to the drug and EC50 represents drug concentration producing 50% of the maximum stimulation achieved at the effect site. When Cp » EC50, the net effect approaches the maximal value of Emax plus the baseline constant. On the other hand, when Cp « EC50, the net eHect approaches the baseline effect, i.e., S(t) ≈ 1.
Model 3 represents drug response that accrues from stimulation of the factors that control the production of the response variable according to
| (6) |
When drug response is attibuted to factors controlling the dissipation of the response variable, Model 4 describes the rate of drug response by
| (7) |
As stationarity is assumed for all models, the response variable (R) begins at a predetermined baseline value (R0), changes with time following drug administration, and eventually returns to (R0). Thus
| (8) |
which reduces the number of operative parameters in these models. Equations (2) and (5) entail an assumption that drug effects correlate directly to plasma drug concentrations; thus, Cp can be generated using classical pharmacokinetic models describing drug input and disposition rates.
In these models, R represents the measured response variable while the effect site represents a separate locus of drug action where the mechanism of action controls either stimulation or inhibition of the designated controlling process (kin or kout).
METHODS
Pharmacokinetics
Methylprednisolone (MP) was chosen as a model drug for simulation since its pharmacokinetics can be described using a linear, one-compartment model, and its pharmacodynamic effects are indirect. Pharmacokinetic profiles were generated for single intravenous (iv) doses (D) administered as a bolus or as a constant infusion. In order to produce a wide range of responses, four dose levels were selected: 1, 10, 100, and 1000 mg. Literature values for a one-compartment volume of distribution (V) equal to 86 L and an elimination rate constant (kel) equal to 0.29 hr−1 were selected to simulate plasma MP concentration-time profile using
| (9) |
where the factor 1000 converts the plasma concentrations to ng/ml. Plasma drug concentrations following administration of single iv infusions over 6 hr were simulated using
| (10) |
where T = t when t < T, T = T when t ≥ T, and T is the infusion time (6 hr).
Distribution Sigmoid Emax Model
The indirect response models produce a delayed response that can be misinterpreted as caused by the rate of drug distribution to an eflect compartment. Data obtained from the simulations were refitted based on such a model to evaluate the two approaches.
The sigmoid Emax equation that was applied to data that behaved as an inhibitory response is
| (11) |
where Eo represents the baseline effect prior to drug administration, n is the sigmoidicity factor, and CE is the drug concentration at the eflect site. The data were also fitted with a simple distributive Emax model, i.e., with n = 1 in Eq. (11). All other parameters remain analogous to those previously defined.
The sigmoid Emax equation that was applied to data that behaved as stimulatory responses is
| (12) |
Apparent effect site concentration (CE) vs. time profiles were generated for the one-compartment, iv bolus administration according to
| (13) |
where kco represents the first-order rate constant for drug loss from the effect site. Equations (11) [or (12)] and (13) were fitted simultaneously to obtain kco, Emax, n, and IC50 (or EC50). The corresponding equation for CE used for the one-compartment, iv infusion case was
| (14) |
where T is defined as in Eq. (10)
The differential equations for Models 1-4 were used in the PCNONLIN program (SCI Software Inc., Lexington KY) to simulate the response versus time profiles. Initial parameter valu es and initial conditions (Table I) were obtained from literature values for Model I as applied to basophil cell trafficking (9). The initial conditions (Ro) for Models 2 and 3 and the Emax values for Models 3 and 4 were chosen arbitrarily.
Table I.
Parameters for the Indirect Response Models
| Parameter | Model 1 | Model 2 | Model 3 | Model 4 |
|---|---|---|---|---|
| EC 50 | 8.06 | 8.06 | ||
| Emax | 4 | 4 | ||
| IC50 | 8.06 | 8.06 | ||
| kin (unit/hr) | 6.10 | 6.10 | 6.10 | 6.10 |
| kout (hr−1) | 0.24 | 1.22 | 1.22 | 0.24 |
| Ro (unit) | 25 | 5 | 5 | 25 |
The distributive sigmoid Emax models were fitted to selected data points from simulated pharmacodynamic profiles using PCNONLJN. A weight of l/y was used except for Model 1 for the 10-mg dose and for simultaneous fitting of all doses in Model 2, where the data fitted best when no weighting schemes were used.
RESULTS
Model Fitting
The results of simulating the pharmacokinetic profiles of methylprednisolone for four dose levels are shown in Fig. 2. Linear kinetics and a wide range of plasma concentrations are evident.
Fig. 2.
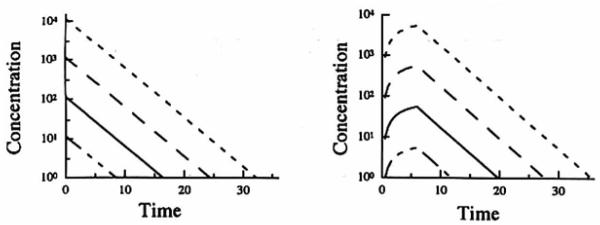
Simulated pharmacokinetic profiles of methylprcdnisolonc following the administration of the four doses (1, 10, 100, or 1000 mg) either as an intravenous bolus (left panel) or as an intravenous infusion over 6 hr (right panel).
Figure 3 portrays Model 1 data (inhibition of the factors controlling the production of response). Simulations were performed by applying Eq. (3) to plasma drug concentrations generated by Eq. (9). The top panel shows how the inhibitory indirect response mechanism produces a slow diminution of the response variable with a maximum inhibitory response observed serveral hours after drug administration. Thereafter, the response gradually returns to the baseline with a later return found with the larger does. The time of occurence of maximum inhibition (Tmax) shifts to later times with larger doses and these values (estimated from simulations) are listed in Table II. The net response is proportional to the log of dose. The middle panel shows a hysteresis plot of response versus plasma drug concentration. During the time when drug concentration and responses are returning to baseline, there is a near superpositioning of the curves. The lower panel shows the fitting of the data to the distributive sigmoid Emax model individually for the four doses of the drug. Table III illustrates how the individual parameters obtained with the fittings change with dose. In particular, the IC50 values increase nearly 100-fold over the d osage range. The data from the higher doses fit poorly while simultaneous use of data from all four doses produces intermediate parameter estimates with the poorest fitting (not shown in figure).
Fig. 3.

Model I simulation of the response after a single iv bolus dose with respect to time (upper panel) and plasma concentration (middle panel). The curves in the lower panel represent the best filling of the distributive sigmoid Emax model to the simulated data (symbols) from the indirect response model. Methylprednisolone iv doses of 1 mg (◇ - - -). 10 mg (○ —), 100mg(□ ––), 100mg(△ ---).
Table II.
Characteristics of Indirect Response Models
| Dose (mg) | Model 1 | Model 2 | Model 3 | Model 4 |
|---|---|---|---|---|
| Tmax (hr) | ||||
| 1 | 5 | 2.5 | 2 | 4 |
| 10 | 8 | 5 | 3 | 4 |
| 100 | 10 | 10 | 4 | 6 |
| 1000 | 16 | 16 | 6 | 8 |
| Cp(Tmax) (ng/ml) | ||||
| 1 | 2.7 | 5.6 | 6.5 | 3.65 |
| 10 | 11.4 | 27.3 | 48.7 | 36.5 |
| 100 | 64 | 64 | 364.5 | 204.1 |
| 10000 | 112.3 | 112.3 | 2040.9 | 1142.7 |
Table III.
Estimated Parameters of the Effect Compartment Model Fitted to Indirect Response Data
| Dose | k co | IC 50 /EC 50 | n | E max |
|---|---|---|---|---|
| Model 1 | ||||
| Bolus | ||||
| 1 mg | 0.1636 | 6.468 | 1.395 | |
| 10 mg | 0.0776 | 15.75 | 2.507 | |
| 100 mg | 0.0388 | 77.95 | 4.135 | |
| 1000 mg | 0.0278 | 548.1 | 4.049 | |
| Simultaneous | 0.1468 | 37.92 | 0.507 | |
| Inrusion | ||||
| 1 mg/6 hr | 0.2290 | 8.410 | 1.048 | |
| 10 mg/6 hr | 0.1772 | 15.01 | 1.203 | |
| 100 mg/6 hr | 0.1100 | 60.84 | 1.479 | |
| 1000 mg/6 hr | 0.0669 | 359.4 | 1.874 | |
| Simultaneous | 0.1418 | 16.40 | 0.785 | |
| Model 2 | ||||
| Bolus | ||||
| 1 mg | 0.6043 | 386.2 | 1.182 | 504.2 |
| 10 mg | 0.1785 | 217.0 | 1.810 | 503.4 |
| 100 mg | 0.0600 | 145.2 | 4.247 | 60.16 |
| 1000 mg | 0.0268 | 677.6 | 8.015 | 61.92 |
| Simultaneous | 0.2954 | 26.94 | 2.710 | 17.22 |
| Model 3 | ||||
| Bolus | ||||
| 1 mg | 0.7653 | 64.73 | 0.908 | 81.98 |
| 10 mg | 0.3063 | 33.58 | 1.126 | 29.87 |
| 100 mg | 0.1400 | 88.53 | 1.988 | 21.35 |
| 1000 mg | 0.0882 | 527.3 | 2.825 | 20.04 |
| Simultaneous | 06498 | 7.713 | 1.063 | 17.40 |
| Model 4 | ||||
| Bolus | ||||
| 1 mg | 0.2337 | 3.082 | 1.233 | |
| 10 mg | 0.1467 | 12.03 | 1.351 | |
| 100 mg | 0.0877 | 71.07 | 1.398 | |
| 1000 mg | 0.0558 | 452.4 | 1.317 | |
| Simultaneous | 0.3824 | 5.585 | 0.290 |
Figure 4 shows iv in fusion data for Model I generated by applying Eq. (14) to MP plasma infusion data simulated by Eq. (10). The general observations are similar to those found in Fig. 3. The middle panel of Fig. 4, however, shows the more common expression of hysteresis generally associated with an effect compartment. Note that the direction of the curves is clockwise as a decreasing response is plotted on the ordinate. Again, the lower panel shows poor fitting of the data (using a distributive sigmoid Emax model) at higher doses. Table II shows the dose dependency of the parameter estimates obtained from individual fitting of the doses with this model. Besides the marked changes in kco, IC50, and n with dose, these apparent parameters differ from values gene rated for Model I data from the preceding iv bolus base.
Fig. 4.

Model I simulation of the response after a single iv infusion dose given over 6 hr vs. time (upper panel) and plasma concentration (middle panel). The curves in the lower panel represent the best filling of the distributive sigmoid E.,. model to the simulated data (symbols) from the indirect response model. Methylprednisolone iv doses of 1 mg (◇ - - -). 10 mg (○ —), 100mg (□ ––), 1000mg (△ ---).
In Fig. 5, the three pane ls characterize Model 2 which exemplifies inhibition at the site of loss of drug response. The initial responses for all doses superimpose. The time of occurrence of the maximum response is dependent on the dose (see Table II) with later Tmax values at larger doses. Compared to the oth er three models, the responses return to baseline more quickly. The hysteresis plot in the middle panel of Fig. 5 demonstrates counterclockwise curves as an increasing response is plotted on the ordinate . In the lower panel, which shows the fitting of the data with a distributive sigmoid Emax model, the larger doses reveal a poor fitting as seen previously in Figs. 3 and 4. The estimated parameters, listed in Table III, vary with dose with the kco values affected most.
Fig. 5.

Model 2 simulation of the response afier a single iv bolus dose with respect lo time (upper panel) and plasma concentrarion (middle panel). The curves in lhc lower panel represent the best filling of the distributive sigmoid Emax model lo the simulated data (symbols) from the indirect response model. Mcthylprcdnisolone iv doses of 1 mg (◇ - - -), 10 mg (○ —), 100 mg (□ ––), 100 mg (△ - - -).
The pharmacodynamic profiles resulti n g from simulations when Model 3 (stimulation of the factors controlling the production of the drug response) is applied are shown in Fig. 6. Compared to Model 2, the time of maximum response does not shift as such with dose (Table II). As in Model 2, the middle panel shows an anticlockwise direction of the hysteresis. The lower panel shows that, for this model, all the dose levels were fitted well with the distributive sigmoid model when the fittings were performed individually for each dose. However, as seen in Table III, the parameters showed similar dose dependency as seen with the other models. An attempt to fit all four doses simultaneously resulted in poor fitting or all profiles (not shown in figure).
Fig. 6.

Model 3 simulation of the response after a single iv bolus dose with respect to time (upper panel) and plasma concentration (middle panel). The curves in the lower panel represent the best fitting of the distributive sigmoid Emax model to the simulated data (symbols) from the indirect response model. Methylprednisolone iv doses of 1 mg (◇ - - -). 10 mg (○ —). 100 mg(□ ––), 1000 mg(△ ---).
Figure 7 shows the pharmacodynamic profiles resulting from Model 4 (stimulation of the factors controlling the loss of response). The time for maximal response shifted only slightly with dose (Table II). As seen in Figs. 3 and 4, the hysteresis in the middle panel is clockwise since a decreasing response is plotted. The lower panel shows that the distributive sigmoid Emax model fitted the data from the lower doses better than the data from the higher doses. Table III shows similar dose dependency of the estimated parameters seen with the other models, with the IC50 changing severely (150-fold range). As expected, a simultaneous fit of all four dose levels resulted in a poor fitting.
Fig. 7.

Model 4 simulation of the response aRer a single iv bolus dose with respect to time (upper panel) and plasma concentration (middle panel). The curves in the lower panel represent the best fitting of the distributive sigmoid Emax. model to the simulated data (symbols) from the indirect response model. Methylprcdnisolone iv doses of 1 mg (◇ - - -), 10 mg (○ —), 100 mg (□ ––), 1000 mg (△ ---).
DISCUSSION
Indirect Response Patterns
The four basic indirect response models were developed to account for the most commonly expected types of responses. These models have common characteristics as observed from the plots or the simulated data. The net response increases with dose until a maximum value is obtained. Models I and 4 express this maximum response as a theoretical minimum of zero, although Model 4 may not reach zero depending on the value set for Emax. In all four models, the time of occurence of the maximum or minimum response is shifted to later times as the dose increases. The initial rate of change of the response maintains the same value, governed by kout, independent of dose. This phenomenon was observed previously with the pharmacokinetic/pharmacodynamic modeling of glucocorticoid suppression of basophil trafficking (8,9). In addition, all four models show a slow return to baseline which proceeds to occu r when plasma drug concentrations decline to very low values (below IC50 or EC50). The equations predict and the curves demon strate that the retu rn rate of responses with the larger doses are essentially parallel as they are governed by the zero-order constant, kin When the responses are nearly back to baseline, the curves are a function of kin, kout, and the changing value of R, which ren der these as nonlinear functions.
As the models assumed stationarity, all curves return to the original baseline. As the four basic indirect response models yield both common and differential characteristics, these models may serve to classify appropriately collected dose-response data.
Typically, experimental data demonstrate either an increased or a diminished response with time after dosing of the drug. Pharmacologic insight into the mechanism of action of the drug is n eeded to identify whether inhibition or stimulation is occurring. In the case of methylprednisolone effects on basophils and helper T cell trafficking, Model I produced IC50 values that were similar to receptor KD values supporting an assumption of inhibition of kin (8-10).
Effect Compartment Model
The basic appearance of an effect compartment model with distribution governing drug movement to and from the effect site may seem analogous to the indirect response model kin and kout, processes. Part of the purpose of this work was to assess what happens when the effect compartment model is used in characterizing data which are more accurately described by an indirect mechanism of action. The model used for the present fittings (distributive sigmoid Emax, model) was found to fit the data better than the simple Emax model using an effect compartment (data not presented).
Generally the distributive sigmoid Emax model could fit individual response patterns extremely well with the poo rest fitting observed with larger drug doses. However, when common parameters were sought in jointly fitting of all dose levels with this model, overall fitting was poor as the distributive model requires that all dose levels produce maximum effect at the same time. The indirec t models entail a later Emax with larger drug doses. As expected, most parameters obtained from simultaneous fitting (Table III) fall between the range of the individual estimates. However, there are some inconsistencies, particularly in the n and Emax values which may be a limitation of the filling algorithm. However, using a different algorithm (NelderMead vs . Gauss-Newto n modifications in PCNONLIN) did not change this situation.
The dose dependency of the estimated parameters (shown in Table III) creates a biologically implausible situation where the sensitivity (IC50/EC50), the capacity (Emax), and the n value for a system change with dose . Thus, the distributive model, while seemingly capable of characterizing the data, has severe limitatio ns when appl ied to fitting data described by an indirect response.
There have been situations in pharmacodynamic modeling of prednisolone (15), methylprednisolone (16), and dexamethasone (17) where these limitations have been observed.
GeneralApplications
Since many drugs act by inhibiting or stimulating the release of an endogenous physiologica l factor, the models presented in this paper may have a broad general applicability. Besides the examples cited, other classes of drugs for which these or more complex models may be applicable include histamine Hi-receptor antagonists, such as cimetidine, which reduce gastric acid secretion (18); oral hypoglycemic agents, such as tolbutamide, which lower blood glucose levels by stimulating the secretion of insulin (19); angiotensin-converting enzyme inhibitors, such as captopril, which reduce blood pressure by inhibiting the formation of angiotensin II (20); aldose reductase inhibitors, such as AL 1576, which inhibit the formation of sorbitol from glucose (21) ; and dopamine antagonists, such as remoxipride, which stimulate the secretion of prolactin (22). It is apparent that the pharmacodynamics of these drugs may be characterized using Model 1 or 3. The effects of reversible anticholinesterase agents (e.g., physostigmine) which inhibit the enzymatic breakdown of acetylcholine may be characterized using Model 2. Examples of Model 4 type drugs include diuretics such as furose mide which stimulate the sec retion of electrolytes and urine (23). Other classes of drugs whose actions might be characterized by these models include cholinergic agonists/antagonists, adrenergic agonists/antagonists, opioid analgesics and antagonists, nonsteroidal anti inflammatory agents, 5-hydroxytryptamine antagonists, hormones, and hormone antagonists.
The four basic indirect response models proposed in this paper represent the most simplistic approaches to modeling drug effects on the input and output processes. It is logical to expect that more complex models involving partial inhibition or stimulation or joint effects on input and output processes may be adapted. As found for cortisol and helper T cell suppression, kin may be a circadian rather than zero-order constant (8, 10). It may be necessary to add the sigmoidicily factor (n) to the I(t) or S(t) functions for some drug effects. The locus of drug action may correspond to a tissue site which may require a more complex model involving a distribution function. If more than one active substance is present (such as an active metabolite) at the site(s) of action, it may be necesary to adjust the models to accommodate for the action of each. Finally, kin and kout may control biological mediators which, in turn, require time to evoke the observed response. Thus a cascadetype model may be required (14).
This report proposes four basic models to represent drug responses that are characterized by indirect mechanisms. The actual response patterns of specific drugs may vary with the selection of constants and initial parameter estimates other than those used to simulate the data presented in this paper.
Acknowledgments
Supported in part by Grant No. 2411 from the National Institutes of General Medical Sciences, National Institutes of Health.
GLOSSARY
- CE
Drug concentration at the hypothetical effect site
- Cp
Plasma concentration of drug
- Cp(Tmax)
Plasma concentration of drug at the time of maximal response
- D
Dose
- EC50
Drug concentration producing 50% of maximum stimulation at effect site
- Emax
Maximum effect attributed to drug
- Eo
Baseline effect prior to drug adm inistratio n
- IC50
Drug concentration producing 50% of maximum inhibition at effect site
- kcl
First-order rate constant for drug elimi nation
- kco
First-order rate constant for drug loss from effect site
- kin
Zero-order rate constan t for production of drug response
- kout
First-order rate constant for loss of drug response
- n
Sigmoid icity factor of the sigmoid Emax equation
- R
Response variable
- Rmax
Maximal (or minimal) response
- Ro
Initial response (time zero) prio r to drug admin istration
- t
time after drug administration
- T
Infusion time
- Tmax
Time to reach maximum effect following drug administration
- V
Volume of distri bution
APPENDIX A
Initial estimates of parameters for Models 1-4 may be obtained from experimental dat a fol lowing an iv bolus dose of drug as described in this section .
Model I : This model is described by
At t=0, R= Ro, Cp = 0, and dR/dt = 0 (steady state). Therefore
| (A1) |
When Cp » IC50 (soon after iv bolus drug administration)
| (A2) |
and a plot of ln (R) vs. time yields a slope of kout. At Tmax, dR/dt = 0, and a maximum response (Rmax) occurs
| (A3) |
Substituting Eq. (A1) in (A3) and rearranging
Inverting both sides, and rearranging
| (A4) |
To obtain the IC50 , the Rmax, Tmax, and Ro can be estimated from the data and Cp(Tmax) can be calculated from the pharmacok inetic model.
Model 2: This model is described by
At t = O, R = Ro, Cp = O, and dR/dt = O (steady state). Therefore, kin = kout . Ro.
When Cp » IC50 (soon after drug administration)
| (A5) |
and a plot of Response (R) vs. time yields an initial slope of kin. For this model, IC50 can be obtained from
| (A6) |
where the right-hand side includes observed parameter values.
Model 3: This model is described by
At t = 0, R = Ro , Cp = O, and dR/dt = 0. Therefore, kin = kout . Ro.
When Cp » IC50 (soon after drug administration)
| (A7) |
and a plot of Response (R) vs. time yields a slope of −kin . Emax. Since at Emax, dR/dt = O,
Substituting for kin, and rearranging
| A8) |
Thus, a plot of Ro/(Rmax - Ro) vs. 1 / Cp(Emax) yields an intercept of 1 /Emax and a slope of EC50/Emax.
Emax can also be estim ated by the following
| (A9) |
which is useful if responses are measured only at one dose level.
Model 4: This model is described by
Again, at t = 0, R = Ro, Cp = O, and dR/dt = 0. Therefore, kin = kout . Ro
When Cp » IC50 (soon after drug ad ministration)
and a plot of Response (R) vs. time yields an in itial slope of −kout . Ro Emax. Since at Emax, dR/dt = O
Substituting for kin, and simplifying
| (A10) |
Thus, a plot of Rmax/(Ro − Rmax) vs. 1/Cp(Emax) yields an intercept of 1/Emax and a slope of EC50/Emax.
Emax can also be estimated by the following
| (A11) |
which is useful if responses are measured only at one dose level.
References
- 1.Holford NHG, Sheiner LB. Understanding the dose-effect relationship: Clinical application of pharmacokinetic-pharmacodynamic models. cin Pharmacokin. 1981;6:429–453. doi: 10.2165/00003088-198106060-00002. [DOI] [PubMed] [Google Scholar]
- 2.Sheiner LB, Stanski DR, Vozeh S, Miller RD, Ham J. Simultaneous modeling of pharmacokinetics and pharmacodynamics: Application to d-tubocurarine. Clin Pharmacol Ther. 1979;25:358–371. doi: 10.1002/cpt1979253358. [DOI] [PubMed] [Google Scholar]
- 3.Verotta D, Beal SL, Sheiner LB. Semiparametric approach to pharmacokinetic-pharmacodynamic data. Am. J. Physiol. 1989;256:R1005–R1010. doi: 10.1152/ajpregu.1989.256.4.R1005. [DOI] [PubMed] [Google Scholar]
- 4.Holford NHG, Sheiner LB. Pharmacokinetic and pharmacodynamic modeling in vivo. CRC Crit. Rev. Bioeng. 1981;5:273–322. [PubMed] [Google Scholar]
- 5.Lalonde RL. Applied Pharmacokinetics. In: Evans WE, Schentag JJ, Jusko WJ, editors. Applied Therapeutics. 3rd Vancouver: 1992. pp. 4–33. [Google Scholar]
- 6.Nagashima R, O'Reilly RA, Levy G. Kinetics of pharmacologie effects in man: The anticoagulant action of warfarin. Clin. Pharmacol. Ther. 1969;10:22–35. doi: 10.1002/cpt196910122. [DOI] [PubMed] [Google Scholar]
- 7.Abbrecht PH, O'Leary TJ, Behrendt DM. Evaluation of a computer-assisted method for individualized anticoagulation: Retrospective and prospective studies with a pharmacodynamic model Clin. Pharmacol. Ther. 1982;32:129–136. doi: 10.1038/clpt.1982.136. [DOI] [PubMed] [Google Scholar]
- 8.Kong A-N, Ludwig EA, Slaughter RL, Distefano PM, Demasi J, Middleton E, Jr., Jusko WJ. Pharmacokinetics and pharmacodynamic modeling of direct suppression effects of methylprednisolone on serum cortisol and blood histamine in human subjects. Clin. Pharmacol. Ther. 1989;46:616–628. doi: 10.1038/clpt.1989.196. [DOI] [PMC free article] [PubMed] [Google Scholar]
- 9.Wald JA, Salazar DE, Cheng H, Jusko WJ. Two-compartment basophil cell trafficking model for methylprednisolone pharmacodynamics. J. Pharmacokm. Biopharm. 1991;19:521–536. doi: 10.1007/BF01062961. [DOI] [PubMed] [Google Scholar]
- 10.Fisher LE, Ludig EA, Jusko WJ. Pharmacoimmunodynamics of methylprednisolone: Trafficking of helper T lymphocytes. J. Pharmacokin. Biopharm. 1992;20:319–331. doi: 10.1007/BF01062461. [DOI] [PMC free article] [PubMed] [Google Scholar]
- 11.Xu Z-X, Jusko WJ. Pharmacodynamic modeling of prednisolone effects on natural killer cell trafficking. submitted for publication. [DOI] [PubMed]
- 12.Francheteau P, Steimer J-L, Dubray C, Lavene D. Mathematical model for in vivo pharmacodynamics integrating fluctuation of the response: Application to the prolactin suppressant effect of the dopaminomimetic drug DCN 203-922. J. Pharmacokin. Biopham. 1991;19:287–309. doi: 10.1007/BF03036252. [DOI] [PubMed] [Google Scholar]
- 13.Wald JA, Jusko WJ. Corticosteroid pharmacodynamic modeling: Osteocalcin suppression by prednisolone. Pharm. Res. 1992;9:1096–1098. doi: 10.1023/a:1015875016041. [DOI] [PubMed] [Google Scholar]
- 14.Boudinot FD, D'Ambrosio R, Jusko WJ. Receptor-mediated pharmacodynamics of prednisolone in the rat. J. Pharmacokin. Biopharm. 1986;14:469–493. doi: 10.1007/BF01059656. [DOI] [PubMed] [Google Scholar]
- 15.Oosterhuis B, Ten Berge RJM, Sauerwein HP, Endert E, Schellekens PTA, Van Boxtel CJ. Pharmacokinetic-pharmacodynamic modeling of prednisolone-induced lymphocytopenia in man. J. Pharmacol. Exp. Ther. 1984;229:539–546. [PubMed] [Google Scholar]
- 16.Derendorf H, Mollmann H, Krieg M, Tunn S, Mollmann C, Barth J, Bothig H-J. Pharmacodynamics of methylprednisolone phosphate after single intravenous administration to healthy volunteers. Pharm. Res. 1991;8:263–268. doi: 10.1023/a:1015864709082. [DOI] [PubMed] [Google Scholar]
- 17.Gupta SK, Ritchie JC, Ellinwood EG, Wiedemann K, Holsboer F. Modeling the pharmacokinetics and pharmacodynamics of dexamethasone in depressed patients. Eur. J. Clin. Pharmacol. 1992;43:51–55. doi: 10.1007/BF02280754. [DOI] [PubMed] [Google Scholar]
- 18.Lin JH. Pharmacokinetic and pharmacodynamic properties of histamine H2-receptor antagonists—relationship between intrinsic potency and effective plasma concentrations. Clin. Pharmacokin. 1991;20:218–236. doi: 10.2165/00003088-199120030-00004. [DOI] [PubMed] [Google Scholar]
- 19.Ganda OP, Kahn CB, Soeldner JS, Gleason RE. Dynamics of tolbutamide, glucose, and insulin: Interrelationships following varying doses of intravenous tolbutamide in normal subjects. Diabetes. 1975;24:354–361. doi: 10.2337/diab.24.4.354. [DOI] [PubMed] [Google Scholar]
- 20.Belz GG, Kirch W, Kleinbloesem CH. Angiotensin-converting enzyme inhibitors: relationship between pharmacodynamics and pharmacokinetics. Clin. Pharmacokin. 1988;15:295–318. doi: 10.2165/00003088-198815050-00003. [DOI] [PubMed] [Google Scholar]
- 21.Averbuch M, Weintraub M, Liao JC, Brazzell RK, Dobbs RE. Red blood cell sorbitol lowering effects and tolerance of single doses of AL 1576 (HOE 843) in diabetic patients. J. Clin. Pharmacol. 1988;28:757–761. doi: 10.1002/j.1552-4604.1988.tb03211.x. [DOI] [PubMed] [Google Scholar]
- 22.Movin-Osswald G, Hammarlund-Udenaes M. Remoxipride: pharmacokinetics and effect on plasma prolactin. Br. J. Clin. Pharmacol. 1991;32:355–360. doi: 10.1111/j.1365-2125.1991.tb03911.x. [DOI] [PMC free article] [PubMed] [Google Scholar]
- 23.Alvan G, Helleday L, Lindholm A, Sanz E, Villen T. Diuretic effect and diuretic efficiency after intravenous dosage of frusemide. Br. J. Clin. Pharmacol. 1990;29:215–219. doi: 10.1111/j.1365-2125.1990.tb03622.x. [DOI] [PMC free article] [PubMed] [Google Scholar]