Abstract
Elevated reactive oxygen species (ROS) are linked to insulin resistance and islet dysfunction. Manganese superoxide dismutase (SOD2) is a primary defense against mitochondrial oxidative stress. To test the hypothesis that heterozygous SOD2 deletion impairs glucose-stimulated insulin secretion (GSIS) and insulin action, wild-type (sod2+/+) and heterozygous knockout mice (sod2+/−) were fed a chow or high-fat (HF) diet, which accelerates ROS production. Hyperglycemic (HG) and hyperinsulinemic-euglycemic (HI) clamps were performed to assess GSIS and insulin action in vivo. GSIS during HG clamps was equal in chow-fed sod2+/− and sod2+/+ but was markedly decreased in HF-fed sod2+/−. Remarkably, this impairment was not paralleled by reduced HG glucose infusion rate (GIR). Decreased GSIS in HF-fed sod2+/− was associated with increased ROS, such as superoxide ion. Surprisingly, insulin action determined by HI clamps did not differ between sod2+/− and sod2+/+ of either diet. Since insulin action was unaffected, we hypothesized that the unchanged HG GIR in HF-fed sod2+/− was due to increased glucose effectiveness. Increased GLUT-1, hexokinase II, and phospho-AMPK protein in muscle of HF-fed sod2+/− support this hypothesis. We conclude that heterozygous SOD2 deletion in mice, a model that mimics SOD2 changes observed in diabetic humans, impairs GSIS in HF-fed mice without affecting insulin action.
Introduction
Elevated reactive oxygen species (ROS) are linked to insulin resistance and islet dysfunction of type 2 diabetes (1–3). Overstimulation of β-cells by nutrients results in increased mitochondrial ROS formation (4), which could directly cause macromolecular (e.g., lipid, DNA) damage or indirectly result in oxidative stress by activating stress-sensitive pathways such as nuclear factor-κB (NFκB), p38 mitogen-activated protein kinase (MAPK), Jun NH2-terminal kinase (JNK)/stress-activated protein kinase, and hexosamine (3). Activation of these pathways has been shown to lead to significant deterioration of glucose-stimulated insulin secretion (GSIS) and other indices of β-cell function (5,6). Even though there is strong evidence that ROS are critical in causing β-cell dysfunction, effective therapeutic strategies including antioxidant therapies that prevent or delay this damage are limited. One reason for this is the lack of knowledge of the specific species of ROS that are responsible for the process.
Superoxide ion (O2˙ˉ) is produced by various cellular oxidase reactions and is a natural byproduct of the mitochondrial electron transport system (7,8). The mitochondrial isoform of the superoxide dismutase, manganese superoxide dismutase (SOD2), catalyzes the conversion of O2˙ˉ to hydrogen peroxide (H2O2). H2O2 may then be broken down to H2O and O2 by antioxidant enzymes, such as glutathione peroxidases, peroxiredoxins, and catalase. Although H2O2 has been shown to be involved in sensing signals that disrupt β-cell function (9), the role of O2˙ˉ and SOD2 in β-cell dysfunction is unknown.
The role of SOD2 in the regulation of muscle insulin sensitivity also remains a point of contention. Both mitochondrial O2˙ˉ and H2O2 serve as metabolic sensors functionally linking the mitochondrial redox state of a cell to insulin sensitivity (1,2). There is some debate as to whether increased SOD2 expression has beneficial or deleterious effects on muscle insulin sensitivity since SOD2 decreases O2˙ˉ but increases H2O2. Reduced O2˙ˉ has been shown to improve insulin action in muscle (1), and elevated H2O2 links excess fat intake to insulin resistance (2).
Mice with a heterozygous knockout of SOD2 (sod2+/−), a model that mimics SOD2 changes observed in diabetic humans (10), were used to study the role of this key mitochondrial O2˙ˉ scavenging enzyme in insulin secretion and insulin sensitivity. Complete SOD2 knockout in mice is lethal (11,12). In the current study, the hypothesis that sod2+/− mice have impaired GSIS and insulin action was tested in vivo. For this purpose validated hyperglycemic (HG) and hyperinsulinemic-euglycemic (HI) clamps coupled with isotopic tracer techniques were used to assess insulin secretion and action in conscious, unrestrained stress-free mice.
Research Design and Methods
Mouse Models
Wild-type (sod2+/+) and sod2+/− C57BL/6J mice were fed chow (LabDiet 5001; www.labdiet.com/Products/StandardDiets/index.html) or a high-fat (HF) diet (F3282, Bio-Serv; www.bio-serv.com/product/HFPellets.html) for 16 weeks. The calorie breakdown was 29% protein, 13% fat, and 58% carbohydrate for the chow diet and 15% protein, 59% fat, and 26% carbohydrate for the HF diet. Noticeably, the HF diet is also a low-protein, low-carbohydrate diet compared with the chow diet. Body composition was determined by nuclear magnetic resonance. Vanderbilt and East Carolina Animal Care and Use Committees approved all animal procedures.
In Vivo HG and HI Clamp
Protocol
Mice had catheters implanted in the left carotid artery and the right jugular vein for blood sampling and intravenous infusion, respectively, 5 days prior to the study (13,14). HG and HI clamps were performed on 5-h fasted mice (13). The clamp procedure used in these studies is unique in that it has been validated from a number of standpoints, including stability of blood glucose over time, absence of stress, insulin measurements, and absence of a hematocrit fall (13). For HG clamps, arterial glucose was clamped at 250 mg/dL using a variable glucose infusion rate (GIR). GIR is an index of glucose tolerance during the HG clamp. Plasma insulin and C-peptide were determined during clamps. For HI clamps [3-3H]glucose was primed (2.4 μCi) and continuously infused (basal 0.04 μCi/min; clamp 0.12 μCi/min) into the jugular vein catheter. At time 0, infusion of insulin (4 mU/kg/min) was started and continued for 155 min. Blood was sampled at 80–120 min for the determination of plasma [3-3H]glucose specific activity. HI clamp insulin was measured at t = 100 and 120 min. At 120 min, 2[14C]deoxyglucose (13 µCi) was administered intravenously. Blood samples were taken thereafter for plasma 2[14C]deoxyglucose measurements. After the last sample, mice were anesthetized and tissues were excised and freeze clamped.
Plasma and Tissue Sample Processing
Plasma insulin and C-peptide were determined by ELISA or radioimmunoassay (Millipore). Glycogen was measured in gastrocnemius and liver extracts (15). 3H and 14C radioactivity was determined by liquid scintillation counting (16). Glucose appearance (Ra) and disappearance (Rd) rates were calculated using non-steady-state equations (17). Endogenous (primarily hepatic) glucose appearance (endoRa) was determined by subtracting the GIR from total Ra. The glucose metabolic index (Rg) was calculated as previously described (18).
Ex Vivo Islet Perifusion and Static Incubation
Islet Isolation, Function Assay, and Islet Area Measurement
We detected no sex effects in vivo, thus islets were isolated only from male mice for the ex vivo measurements. Mouse islets were isolated as described (19) and cultured in RPMI 1640 containing 10% FBS and 5 mmol/L glucose at 37°C overnight. GSIS was assessed by perifusion and static culture using size-matched islets and normalized to islet equivalents. Two secretagogues, glucose (16.7 mmol/L) and 3-isobutyl-1-methylxanthine (IBMX; 100 μmol/L) were used during perifusion. For static GSIS, islets were cultured in 3 mmol/L glucose for 2 h and then 20 mmol/L glucose for an additional 2 h. Insulin in the culture medium was determined by ELISA. Islet size was assessed with MetaMorph version 7.7 (Universal Imaging) on 324–926 islets/genotype (20).
Quantitative RT-PCR
RNA was extracted from isolated islets (Ambion). RNA integrity number was >8. Quantitative PCR was performed using TaqMan primers/probes (Applied Biosystems). Data were normalized to 18s, and relative changes in mRNA expression were calculated by the comparative ΔCt method (19,20). Minimum Information for Publication of Quantitative Real-Time PCR Experiments guidelines was followed for quantitative RT-PCR experiments (21).
Western Blotting
SOD2 expression in muscle was measured in mitochondria isolated from gastrocnemius (Imgenex). SOD2 expression in islets was measured in isolated islet extracts. Akt, GLUT-1, hexokinase II, and AMPK were measured in gastrocnemius homogenate as described previously (22). The antibodies used were SOD2 antibody (Assay Designs), phospho-Akt (Ser473) and Akt, hexokinase II, phospho-AMPK (Thr172) and AMPK-α antibodies (Cell Signaling), and GLUT-1 antibody (Abcam).
SOD2 Activity Assay
SOD2 activity was measured in gastrocnemius mitochondria using the Superoxide Dismutase Assay Kit (Cayman).
In Situ Measurement of Superoxide
Pancreata were fixed in 4% paraformaldehyde and frozen in optimal cutting temperature compound (VWR Scientific Products). Cryosections (5 μm) were washed by PBS followed by dihydroethidium (DHE) staining for 30 min (23). After washing with PBS, slides were mounted and imaged. Fluorescence was quantified using ImageJ.
Measurements of Thiobarbituric Acid-Reactive Substances and Protein Carbonyl Groups
Thiobarbituric acid-reactive substances (TBARS) and protein carbonyl groups were measured in islet extracts and gastrocnemius homogenates using the TBARS and the Protein Carbonyl Colometric Assay Kit, respectively (Cayman).
Reduced and Oxidized Glutathione Measurements
Reduced glutathione (GSH) and oxidized glutathione (GSSG) were measured in gastrocnemius homogenates using the BIOXYTECH GSH/GSSG-412 assay kit (Oxis Research). For GSSG measurement, 5 mmol/L 1-methyl-2-vinylpyridinium trifluoromethanesulfonate was added to scavenge all reduced thiols.
Mitochondrial H2O2 Level
Mitochondrial H2O2 level was measured by continuous spectrofluorometric monitoring oxidation of Amplex Red in permeabilized muscle fibers (2). This is a measurement of the balance of H2O2 between its production and breakdown. Exogenous Cu/Zn-SOD (SOD1) (for the detection of nonmatrix sources of superoxide production) was not included in the assay to isolate the effects of SOD2 deficiency.
Statistical Analysis
Data are expressed as mean ± SEM. Statistical analyses were performed using either Student t test or two-way ANOVA followed by Tukey post hoc tests as appropriate. The significance level was at P < 0.05.
Results
Basal Characteristics of the sod2+/− Mice
Chow-fed sod2+/+ and sod2+/− mice had comparable body weight, percent body fat, and basal 5-h fasting arterial glucose and insulin (Table 1). HF feeding increased body weight, percent body fat, and arterial glucose and insulin equally in both genotypes. Arterial nonesterified fatty acid was not affected by genotype or diet (Table 1).
Table 1.
Basal (5-h fasted) characteristics of sod2+/− mice
| Chow |
HF |
|||
|---|---|---|---|---|
| sod2+/+ | sod2+/− | sod2+/+ | sod2+/− | |
| Body weight (g) | 25 ± 1 | 24 ± 1 | 34 ± 1† | 35 ± 1† |
| Fat mass (%) | 9 ± 1 | 8 ± 0.4 | 30 ± 1† | 28 ± 2† |
| Arterial glucose (mg·dL−1) | 123 ± 3 | 131 ± 4 | 152 ± 6† | 155 ± 6† |
| Insulin (ng·mL−1) | 0.7 ± 0.1 | 0.9 ± 0.2 | 2.0 ± 0.2† | 2.4 ± 0.3† |
| Nonesterified fatty acid (mmol/L) | 0.72 ± 0.04 | 0.75 ± 0.07 | 0.75 ± 0.06 | 0.67 ± 0.03 |
All data are expressed as mean ± SEM. n = 9–11.
†P < 0.05 compared with chow with the same genotype.
Deletion of one SOD2 allele resulted in a 50% reduction in SOD2 protein in the islets (Fig. 1A) and a 60% reduction in muscle mitochondria (Fig. 1B). HF feeding had no effects on SOD2 protein in islets or muscle (Fig. 1A and B). Consistent with protein measurements, SOD2 activity in muscle mitochondria was decreased by 60% in sod2+/− mice relative to sod2+/+ mice (Fig. 1C).
Figure 1.
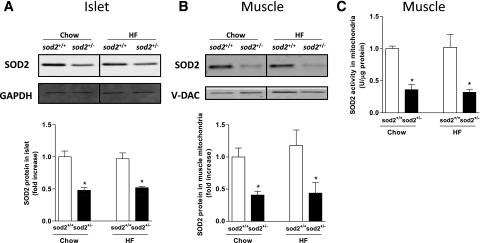
SOD2 expression and activity in islets and muscle. A: Western blotting of SOD2 in isolated islets. GAPDH was used as a loading control. B: Western blotting of SOD2 in muscle mitochondria. V-DAC was used as a loading control. Representative bands were displayed. Data are normalized to chow-fed sod2+/+ mice and represented as mean ± SEM. C: SOD2 activity was measured in mitochondria isolated from gastrocnemius muscle. n = 7–8. *P < 0.05 compared with sod2+/+ within a diet.
In Vivo Insulin Secretion (HG Clamp)
HG and HI clamps were performed in both male and female mice. No sex effect was detected. Therefore, data from both sexes were combined. Arterial glucose was 250 mg/dL during the clamp (Fig. 2A). GIR was slightly higher in the chow-fed mice compared with the HF-fed mice, but genotype had no effect on GIR (Fig. 2B). In the chow-fed mice, arterial insulin and C-peptide was comparable between genotypes (Fig. 2C and D). However, both insulin and C-peptide were markedly decreased in the HF-fed sod2+/− compared with HF-fed sod2+/+, reflecting a marked reduction in insulin secretion (Fig. 2E and F).
Figure 2.
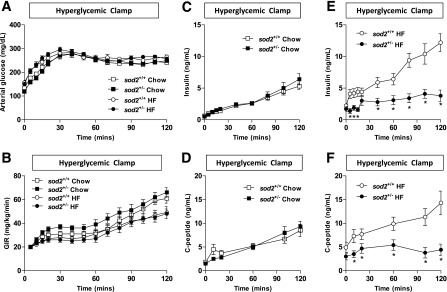
In vivo GSIS as assessed by the HG clamp. (A) Arterial glucose, (B) GIR, (C and E) arterial insulin, and (D and F) arterial C-peptide were measured throughout the HG clamp. Data are represented as mean ± SEM. n = 13 for chow-fed sod2+/+ (7 females/6 males); n = 11 for chow-fed sod2+/− (5 females/6 males); n = 12 for HF-fed sod2+/+ (5 females/7 males); n = 13 for HF-fed sod2+/− (6 females/7 males). *P < 0.05 compared with sod2+/+.
Ex Vivo Insulin Secretion (Isolated Islets)
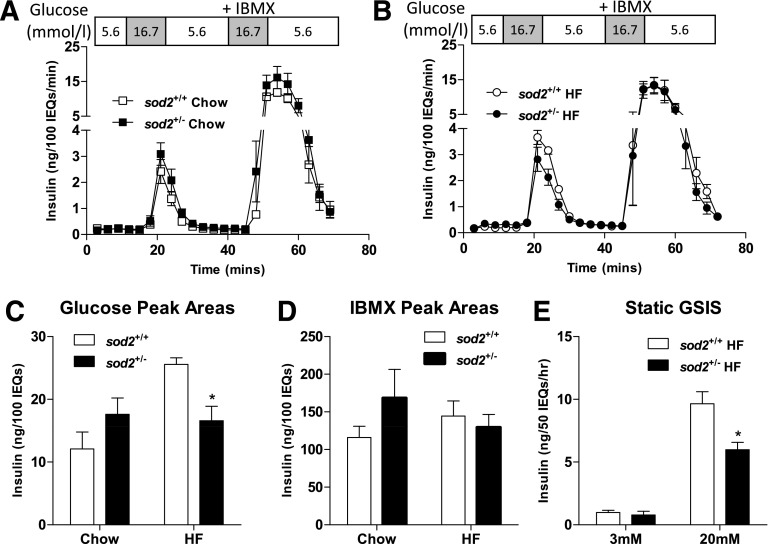
The in vivo findings in GSIS were recapitulated in isolated islets ex vivo. Islets isolated from chow-fed sod2+/+ and sod2+/− mice had identical insulin peaks in response to glucose and IBMX (Fig. 3A). Insulin peak response to glucose in the HF-fed sod2+/− mice was smaller compared with that in the HF-fed sod2+/+ mice during the islet perifusion (Fig. 3B). The quantification of the area under the peak showed a 30% reduction in sod2+/− mice (Fig. 3C). Impaired insulin secretion in HF-fed sod2+/− mice was specific to glucose stimulation, as IBMX-stimulated insulin secretion was identical in HF-fed sod2+/+ and sod2+/− (Fig. 3D). To confirm the differences seen with islet perifusion, insulin secretion during static incubation of islets with glucose was assessed. Since differences in GSIS were only observed in the HF-fed mice, static incubation of islets was performed in the HF-fed mice. Insulin did not differ between HF-fed sod2+/+ and sod2+/− mice at 3 mmol/L glucose, but was decreased in the islets of HF-fed sod2+/− mice at 20 mmol/L glucose compared with sod2+/+ mice (Fig. 3E).
Figure 3.
Ex vivo GSIS as assessed by islet perifusion and static incubation. A and B: Isolated islets were perifused with 16.7 mmol/L glucose and 16.7 mmol/L glucose plus IBMX. C and D: Areas under the insulin peaks in response to glucose and IBMX stimulation were quantified. E: Isolated islets were cultured and incubated with either 3 or 20 mmol/L glucose, and insulin was measured in the culture medium. Data are represented as mean ± SEM. n = 4–8 males for all groups. *P < 0.05 compared with sod2+/+ with the same diet/treatment. IEQs, islet equivalents.
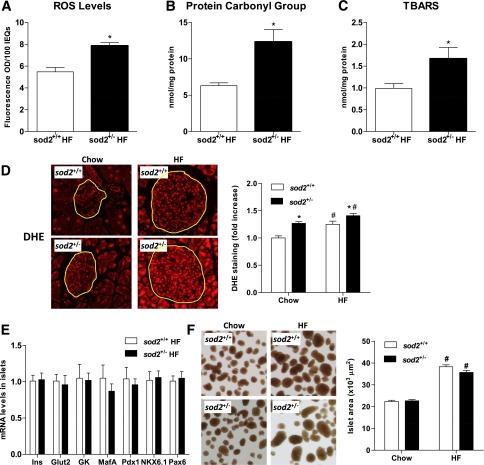
Reduction in GSIS in isolated islets of HF-fed sod2+/− mice was associated with increased ROS levels determined by the ROS indicator dichlorofluorescein diacetate (Fig. 4A). Protein carbonyl groups and TBARS were also higher in the islets from HF-fed sod2+/− mice (Fig. 4B and C). Superoxide concentration determined by DHE staining was increased by HF feeding and heterozygous deletion of SOD2 independently (Fig. 4D). The reduction in GSIS was not associated with changes in gene expression of proteins involved in the insulin secretory pathways (Fig. 4E). Furthermore, impaired GSIS in the HF-fed sod2+/− mice was not associated with changes in islet size and areas (Fig. 4F).
Figure 4.
Redox status, gene expression, and areas of islets. A: ROS production was assessed by the ROS indicator dichlorofluorescein diacetate in islets isolated from the HF-fed mice. B and C: Protein carbonyl groups and TBARS were measured in isolated islet extracts. D: Superoxide level was measured by DHE staining in frozen pancreatic sections. Representative images are displayed and fluorescence was quantified in 10–30 islets per genotype for chow-fed mice and 60–70 islets per genotype for HF-fed mice. E: mRNA levels were determined by quantitative real-time PCR and normalized to HF-fed sod2+/+ mice. F: Islet size was quantified and representative images are displayed. Data are represented as mean ± SEM. n = 4–8 males for all groups. *P < 0.05 compared with sod2+/+ with the same diet; #P < 0.05 compared with chow-fed mice with the same genotype. IEQs, islet equivalents; Ins, insulin.
In Vivo Insulin Action (HI Clamp)
Since the HG GIR was the same between HF-fed sod2+/+ and sod2+/− mice despite the marked reduction in arterial insulin in the sod2+/− mice, we tested whether insulin action might be increased in these mice. The HI clamp was used to assess insulin action in vivo. Arterial glucose was 150 mg/dL during the HI clamp in all groups (Fig. 5A). Infusion of insulin increased arterial insulin to a similar extent in all mice (Chow sod2+/+ 2.4 ± 0.3 ng/mL; chow sod2+/− 3.0 ± 0.5 ng/mL; HF sod2+/+ 3.0 ± 0.2 ng/mL; HF sod2+/− 3.1 ± 0.1 ng/mL). GIR was lower in HF-fed mice relative to chow-fed mice as expected, but genotype did not affect GIR (Fig. 5B). EndoRa was not different between groups in the basal or insulin-clamped state (Fig. 5C). Basal Rd was not different between groups (Fig. 5D). Rd during the HI clamp in sod2+/+ and sod2+/− mice was not different on a chow diet and was decreased to a similar extent by HF feeding (Fig. 5D). Rg in gastrocnemius, superficial vastus lateralis, and heart was similar between genotypes on both chow and HF diets (Fig. 5E). Diaphragm Rg was slightly decreased in chow-fed sod2+/− mice compared with chow-fed sod2+/+ mice but was the same between genotypes on HF diet (Fig. 5E). Changes in muscle insulin signaling after the HI clamp were consistent with metabolic flux measurements observed during the HI clamp. Phosphorylated Akt (p-Akt), total Akt, and p-Akt/Akt ratio were decreased by HF feeding (Fig. 5F). Consistent with similar muscle Rg, p-Akt, total Akt, and p-Akt/Akt ratio did not differ between sod2+/+ and sod2+/− mice, independent of diet (Fig. 5F). These results show that a 50% SOD2 reduction does not influence insulin action. Since HG GIR was the same in HF-fed sod2+/+ and sod2+/− mice even though arterial insulin was reduced in sod2+/− mice and insulin action was not increased, one can deduce that heterozygous SOD2 deletion increases glucose effectiveness, the ability of glucose to facilitate its own disposal (24).
Figure 5.
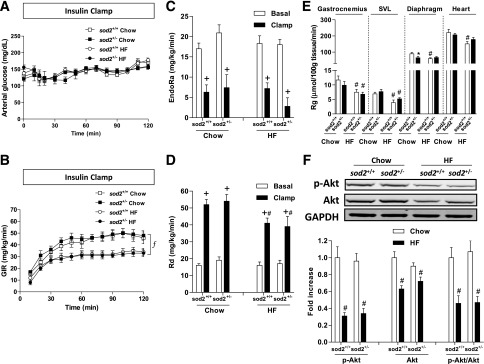
In vivo insulin action as determined by the HI clamp. (A) Arterial glucose, (B) GIR, (C) endoRa, (D) Rd, and (E) Rg, an index of muscle glucose uptake, were determined during the HI clamp. F: Western blotting of p-Akt and total Akt in gastrocnemius muscle post the HI clamp. Representative bands are displayed. GAPDH was used as a loading control. The integrated intensities of bands are normalized to chow-fed sod2+/+ and represented as mean ± SEM. n = 9 for chow-fed sod2+/+ (4 females/5 males); n = 10 for chow-fed sod2+/− (5 females/5 males); n = 12 for HF-fed sod2+/+ (5 females/7 males); n = 13 for HF-fed sod2+/− (6 females/7 males). f, P < 0.05 for the main diet effect; +P < 0.05 compared with basal with the same genotype; #P < 0.05 compared with chow-fed mice with the same genotype; *P < 0.05 compared with sod2+/+ with the same diet. SVL, superficial vastus lateralis.
Glucose Effectiveness During the HG Clamp
Expression of GLUT-1, hexokinase II, and AMPK and activation of AMPK (p-AMPK/AMPK ratio), which are associated with glucose effectiveness, were increased in the HF-fed sod2+/− mice as compared with sod2+/+ mice in muscle excised after the HG clamp (Fig. 6A–C). Muscle glycogen was not different between the HF-fed sod2+/+ and sod2+/− mice (Fig. 6D), but liver glycogen was higher in the HF-fed sod2+/− mice (Fig. 6E). The latter finding is again consistent with an increase in glucose effectiveness.
Figure 6.
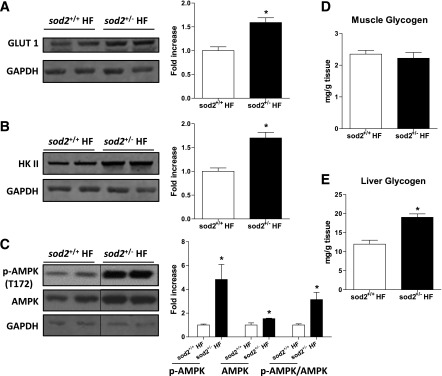
Glucose effectiveness during the HG clamp. (A) Western blotting of GLUT-1, (B) hexokinase II, and (C) phosphorylation of AMPK and total AMPK was performed in gastrocnemius muscle extracts post HG clamp. GAPDH was used as loading control. Representative bands are displayed. The integrated intensities of bands are normalized to chow-fed sod2+/+ and are represented as mean ± SEM. n = 4–5 (males). D and E: Muscle and liver glycogen content was determined in tissues post HG clamp. n = 6–7 (males). *P < 0.05 compared with sod2+/+ HF. HK II, hexokinase II.
Muscle Redox State
GSH/GSSG was decreased in muscle of sod2+/+ mice by HF feeding (Fig. 7A), suggesting a shift to a more oxidized redox environment. sod2+/− significantly decreased muscle GSH/GSSG in chow-fed mice and caused no further decrease in HF-fed mice (Fig. 7A). Protein carbonyl groups were not different between chow-fed sod2+/− and sod2+/+ mice but tended to be increased in HF-fed sod2+/− mice (P = 0.07) (Fig. 7B). Muscle TBARS were not affected by genotype or diet (Fig. 7C).
Figure 7.
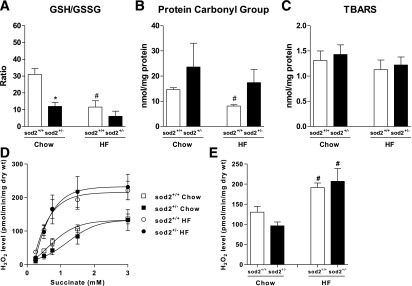
Redox status and mitochondrial H2O2 level in muscle. A: GSH and GSSG concentrations in gastrocnemius muscle were measured. B and C: Protein carbonyl groups and TBARS were measured in gastrocnemius homogenates. D: Mitochondrial H2O2 level was measured during succinate titration at state-4 respiration (10 µg/mL oligomycin) in permeabilized muscle fiber bundles prepared from chow- and HF-fed sod2+/+ and sod2+/− mice. E: Mitochondrial H2O2 level was measured during palmitoylcarnitine-supported state-4 respiration. *P < 0.05 compared with sod2+/+ with the same diet; #P < 0.05 compared with chow with same genotype. n = 3–8.
Muscle mitochondrial H2O2 level was measured during both succinate- and palmitoylcarnitine-supported state-4 respiration. Succinate increased H2O2 level in a dose-dependent manner (Fig. 7D). HF feeding caused an elevation in H2O2 level in the muscle of sod2+/+ mice (Fig. 7D and E). sod2+/−, however, had no effect on either succinate- or palmitoylcarnitine-supported H2O2 level in mice on either diet (Fig. 7D and E).
Discussion
SOD2 is a primary defense against oxidative stress, since ROS are largely generated on the matrix side of the inner mitochondrial membrane (25). In the current study, we used a mouse model with genetically reduced SOD2 levels, so as to increase mitochondrial O2˙ˉ. The putative role of SOD2 or mitochondrial O2˙ˉ in regulation of GSIS and insulin action was tested using glucose clamp techniques that are unique in that they do not require restraint, severing of the tail, or mouse handling. Our results demonstrate for the first time that sod2+/− causes dramatic impairments in GSIS in mice fed HF but not in lean mice. The observation of reduced GSIS in HF-fed sod2+/− mice in vivo is also evident in isolated islets. Decreased GSIS is likely attributable to increased O2˙ˉ in islets of knockout mice. We conclude that SOD2 reduction impairs GSIS when mitochondrial ROS is further elevated by HF diet and that this combination exceeds the adaptive capacity of the β-cells. Surprisingly, sod2+/− does not affect insulin action. The ability of insulin to suppress hepatic glucose production and to stimulate glucose utilization is not sensitive to the changes in SOD2 in the current study.
Pancreatic β-cells are particularly vulnerable to oxidative stress due to low antioxidant enzyme expression (26). It is suggested that an imbalance between excess ROS production and limited antioxidant enzymes damages secretory capacity and viability of β-cells (26,27). Our results showing that a 50% reduction in islet SOD2 dramatically decreases GSIS both in vivo and in isolated islets of the HF-fed mice are consistent with these previous studies, suggesting that SOD2, the primary mitochondrial O2˙ˉ scavenger, is critical in regulating the redox state and therefore the secretory capacity of β-cells. Decreased GSIS in HF-fed sod2+/− mice is associated with increased O2˙ˉ. One could conclude that SOD2 reduction increases mitochondrial O2˙ˉ, which contributes to elevated ROS and impaired GSIS. However, SOD2 converts O2˙ˉ to H2O2. A reduction in SOD2 could potentially decrease mitochondrial and cytosolic H2O2 in islets. Although H2O2 has been shown to be involved in sensing signals disrupting β-cell functions (9,28), it has also been shown that H2O2 derived from glucose metabolism serves as an important metabolic signaling molecule for insulin secretion (29). Therefore, the contribution of potential changes in H2O2 on impaired GSIS in HF-fed sod2+/− mice cannot be ruled out. In the presence of HF feeding, both excessive O2˙ˉ and H2O2 could negatively impact GSIS. Therefore one might predict that a combination of SOD2 and catalase, which converts H2O2 to O2 and H2O, would have the most antioxidative effect.
Mitochondrial dysfunction and oxidative stress have been implicated in the metabolic deterioration of β-cells, yet the mechanisms are not fully understood. It has been shown that transient exposure of β-cells to 200 µmol/L H2O2 decreases the secretory response to glucose, accompanied by reduced oxygen consumption, glucose-induced ATP generation, subunits of the respiratory chain, and expression of genes responsible for mitochondrial biogenesis (30). These findings suggest that mitochondrial dysfunction is potentially contributing to the impaired GSIS resulted from oxidative stress. Mitochondrial dysfunction is normally associated with increased ROS formation (31). While elevated ROS directly damage and oxidize DNA, protein, and lipids, ROS can also activate a number of stress-sensitive pathways that have been linked to decreased insulin secretion (3). These include activation of several key inflammatory pathways such as NFκB, p38 MAPK, JNK, and Janus kinase/STAT pathways and islet-enriched transcription factors (28). Activation of the NFκB and JNK/STAT pathways has been associated with ROS-mediated pancreatic β-cell death and therefore decreased GSIS (32). In addition to apoptosis, ROS has also been shown to decrease insulin gene expression by downregulating the expression of transcription factor Pdx-1 (26,28). However, here we show that the HF-fed sod2+/− mice had normal expression of genes that encode proteins involved in the regulation of insulin secretion. In addition, islet size is expanded equally in HF-fed sod2+/− and sod2+/+ mice. These results suggest that the decreased islet secretory capacity of the SOD2 knockout mice is due to a defect in the regulation of insulin secretion (e.g., glucose sensing, insulin exocytosis) rather than insulin biosynthesis or β-cell mass.
Heterozygous SOD2 deletion had no effects on insulin action either in healthy lean mice or HF diet–induced obese mice. This was despite a decrease in muscle GSH/GSSG, an indication of overall cellular redox state, in chow-fed sod2+/− mice. Hoehn et al. (1) reported that sod2+/− mice had impaired glucose tolerance on a chow diet. Our results show that these effects on glucose tolerance are not due to changes in insulin action. The interpretation of glucose tolerance testing is complicated, as glycemic excursions can be due to a number of factors (33), including insulin secretion, insulin clearance, and glucose effectiveness (34). Although we did not see a defect in insulin secretion in the chow-fed sod2+/− mice at an arterial glucose of 250 mg/dL, a higher arterial glucose concentration may have provoked insulin secretory defects, thereby contributing to the impaired glucose tolerance. Nevertheless, our results are consistent with the data of Hoehn et al. (1) that showed that overexpression of SOD2 in L6 cells had no effect on insulin action and provide evidence that SOD2 reduction is not a critical determinant of muscle insulin action.
The effect of H2O2 on muscle glucose uptake is controversial. H2O2 has been reported to induce an insulin signaling defect in skeletal muscle cells (35). This defect is associated with a selective loss of insulin receptor substrate-1 and insulin receptor substrate-2 proteins, in part related to a p38 MAPK–dependent mechanism (36). Chronic elevation of mitochondrial H2O2 has been shown to link excess fat intake to insulin resistance in both rodents and humans (2). On the other hand, low levels of H2O2 are shown to be required for normal cellular function and intracellular signaling (8). In the current study, we found that mitochondrial H2O2 level, however, was not altered by the reduction of SOD2 in the muscle. These results are consistent with previous studies that showed that muscle mitochondrial H2O2 level was not affected by SOD2 overexpression (37), suggesting that even a 50–60% decrease in SOD2 expression in muscle mitochondria is not rate limiting for converting O2˙ˉ to H2O2. Although the enzymatic activity of SOD1, the cytosolic isoform of SOD and glutathione peroxidase, remains unchanged in the chow-fed sod2+/− mice (11), compensations from other antioxidant mechanisms, especially during HF feeding, are possible.
Consistent with the H2O2 data, further measurements of the muscle redox state showed that GSH/GSSG, protein carbonyl groups, and TBARS levels were not different between muscles of HF-fed sod2+/− and sod2+/+ mice. These results further suggest that muscle is resistant to the changes in redox state caused by a 60% reduction of SOD2. The unchanged redox state in the muscle may explain the lack of changes in insulin sensitivity in the HF-fed sod2+/− mice. In contrast, pancreatic β-cells are particularly vulnerable to such a reduction, possibly due to low antioxidant enzyme expression (26). Total ROS, O2˙ˉ, protein carbonyl groups, and TBARS were increased in the islets of HF-fed sod2+/− mice. These differences in the oxidative damage status between muscle and islets provide mechanistic insight for the observed phenotype differences between tissues.
Surprisingly, muscle protein carbonyl groups level was found to be decreased in the HF-fed sod2+/+ mice compared with chow-fed sod2+/+ mice. Despite high uncertainty, one possible postulation is that the HF diet contains lower protein and carbohydrate content compared with the chow diet. These differences in protein and carbohydrate content between diets may create unforeseen effects on redox status of protein in muscle. Moreover, these differences in diets may also have direct impacts on insulin secretion and action. Fortunately, the concluding results of the current study emphasizes a genetic effect rather than a diet effect. Therefore metabolic effects caused by the differences in nutritional profile of diets shall remain the same between genotypes.
Hyperglycemia per se exerts direct effects on glucose homeostasis, independent of changes in insulin or other hormonal signals (38). This phenomenon is referred to as “glucose effectiveness.” The loss of glucose effectiveness in type 2 diabetes contributes importantly to hyperglycemia (24). Interestingly, HF-fed sod2+/− mice exhibited increased glucose effectiveness during hyperglycemia. This was related to increased GLUT-1, hexokinase II expression, and activation and expression of AMPK. These proteins involved in glucose utilization may serve to compensate for the defects in insulin secretion.
While this article was in preparation, Muscogiuri et al. (39) reported that mice with SOD1 deletion have glucose intolerance secondary to impairments in β-cell function rather than defects on insulin sensitivity. These results are consistent with our findings and, when combined with the current study, highlight a critical role of SOD enzymes in regulating insulin secretion. However, there exist important differences in the role for SOD1 and SOD2 in insulin secretion. Our study specifically targeted SOD2 with its mitochondrial ROS scavenging capacity, while the study of Muscogiuri et al. (39) targeted the cytosolic compartment of the cell where SOD1 resides. Our results show that the level of SOD2 and mitochondrial O2˙ˉ/H2O2 are more critical in the impairment of insulin secretion seen with heterozygous deletion of SOD2 (with 50% remaining protein and activity of SOD2). Furthermore, the activity of SOD1 and other antioxidant enzymes regulate the transcription of key β-cell genes such as Pdx1, insulin, GLUT-2, and glucokinase (40–42). However, our results show that mitochondrial SOD2 does not affect the mRNA of these genes. These results indicate that SOD1 and SOD2 impact insulin secretion by distinctive mechanisms.
In conclusion, these data demonstrate that SOD2 reduction dramatically decreases pancreatic β-cell secretory capacity under dietary model of insulin resistance without affecting insulin action. These studies show for the first time that pancreatic islets are particularly sensitive to a 50% reduction of SOD2, yet skeletal muscle is not. Our mouse model of heterozygous SOD2 knockout mimics changes observed in diabetic humans (10,43,44) and thus is relevant to human disease. Our results suggest that efforts to target mitochondrial antioxidant enzymes may be beneficial in β-cell dysfunction and insulin resistance. Identification of tissue-specific therapeutic targets is particularly important because of the different sensitivity of tissues to changes in redox state.
Article Information
Funding. This work was supported by National Institutes of Health (NIH) grant DK-054902 (to D.H.W.); NIH grant DK-059637 (Mouse Metabolic Phenotyping Center, to D.H.W.); a Merit Review Award from the Veterans Affairs Research Service (BX000666 to A.C.P.); NIH grants DK-69603, DK-089572, DK-089538, DK-66636, and DK-072473 (to A.C.P.); grants from JDRF International; and the Vanderbilt Diabetes Research and Training Center (NIH grant DK-20593). The authors received no editorial assistance.
Duality of Interest. No potential conflicts of interest relevant to this article were reported.
Author Contributions. L.K. performed experimental design, researched data, contributed to discussion, and wrote the manuscript. C.D. performed experimental design, researched data, contributed to discussion, and reviewed and edited the manuscript. M.E.L., J.S.B., W.H.M., S.M., F.D.J., C.S.T., C.-T.L., C.G.R.P., and E.J.A. researched data and reviewed the manuscript. P.D.N., D.H.W., and A.C.P. performed experimental design, reviewed data, contributed to discussion, and reviewed and edited the manuscript. All authors approved the final version of this manuscript. L.K. is the guarantor of this work and, as such, had full access to all the data in the study and takes responsibility for the integrity of the data and the accuracy of the data analysis.
Prior Presentation. Parts of this study were presented at the 73rd Scientific Sessions of the American Diabetes Association, Chicago, IL, 21–25 June 2013.
References
- 1.Hoehn KL, Salmon AB, Hohnen-Behrens C, et al. Insulin resistance is a cellular antioxidant defense mechanism. Proc Natl Acad Sci U S A 2009;106:17787–17792 [DOI] [PMC free article] [PubMed] [Google Scholar]
- 2.Anderson EJ, Lustig ME, Boyle KE, et al. Mitochondrial H2O2 emission and cellular redox state link excess fat intake to insulin resistance in both rodents and humans. J Clin Invest 2009;119:573–581 [DOI] [PMC free article] [PubMed] [Google Scholar]
- 3.Evans JL, Goldfine ID, Maddux BA, Grodsky GM. Are oxidative stress-activated signaling pathways mediators of insulin resistance and beta-cell dysfunction? Diabetes 2003;52:1–8 [DOI] [PubMed] [Google Scholar]
- 4.Rehman A, Nourooz-Zadeh J, Möller W, Tritschler H, Pereira P, Halliwell B. Increased oxidative damage to all DNA bases in patients with type II diabetes mellitus. FEBS Lett 1999;448:120–122 [DOI] [PubMed] [Google Scholar]
- 5.Kondo T, El Khattabi I, Nishimura W, et al. p38 MAPK is a major regulator of MafA protein stability under oxidative stress. Mol Endocrinol 2009;23:1281–1290 [DOI] [PMC free article] [PubMed] [Google Scholar]
- 6.El Khattabi I, Sharma A. Preventing p38 MAPK-mediated MafA degradation ameliorates β-cell dysfunction under oxidative stress. Mol Endocrinol 2013;27:1078–1090 [DOI] [PMC free article] [PubMed] [Google Scholar]
- 7.Kim HY, Chung JM, Chung K. Increased production of mitochondrial superoxide in the spinal cord induces pain behaviors in mice: the effect of mitochondrial electron transport complex inhibitors. Neurosci Lett 2008;447:87–91 [DOI] [PMC free article] [PubMed] [Google Scholar]
- 8.Veal EA, Day AM, Morgan BA. Hydrogen peroxide sensing and signaling. Mol Cell 2007;26:1–14 [DOI] [PubMed] [Google Scholar]
- 9.Elsner M, Gehrmann W, Lenzen S. Peroxisome-generated hydrogen peroxide as important mediator of lipotoxicity in insulin-producing cells. Diabetes 2011;60:200–208 [DOI] [PMC free article] [PubMed] [Google Scholar]
- 10.Flekac M, Skrha J, Hilgertova J, Lacinova Z, Jarolimkova M. Gene polymorphisms of superoxide dismutases and catalase in diabetes mellitus. BMC Med Genet 2008;9:30. [DOI] [PMC free article] [PubMed] [Google Scholar]
- 11.Li Y, Huang TT, Carlson EJ, et al. Dilated cardiomyopathy and neonatal lethality in mutant mice lacking manganese superoxide dismutase. Nat Genet 1995;11:376–381 [DOI] [PubMed] [Google Scholar]
- 12.Huang TT, Carlson EJ, Kozy HM, et al. Genetic modification of prenatal lethality and dilated cardiomyopathy in Mn superoxide dismutase mutant mice. Free Radic Biol Med 2001;31:1101–1110 [DOI] [PubMed] [Google Scholar]
- 13.Ayala JE, Bracy DP, McGuinness OP, Wasserman DH. Considerations in the design of hyperinsulinemic-euglycemic clamps in the conscious mouse. Diabetes 2006;55:390–397 [DOI] [PubMed] [Google Scholar]
- 14.Berglund ED, Li CY, Poffenberger G, et al. Glucose metabolism in vivo in four commonly used inbred mouse strains. Diabetes 2008;57:1790–1799 [DOI] [PMC free article] [PubMed] [Google Scholar]
- 15.Lowry OH, Passonneau JV. A flexible system of enzymatic analysis. Starch 1972;25:322 [Google Scholar]
- 16.Ayala JE, Bracy DP, Julien BM, Rottman JN, Fueger PT, Wasserman DH. Chronic treatment with sildenafil improves energy balance and insulin action in high fat-fed conscious mice. Diabetes 2007;56:1025–1033 [DOI] [PubMed] [Google Scholar]
- 17.Steele R, Wall JS, De Bodo RC, Altszuler N. Measurement of size and turnover rate of body glucose pool by the isotope dilution method. Am J Physiol 1956;187:15–24 [DOI] [PubMed] [Google Scholar]
- 18.Kraegen EW, James DE, Jenkins AB, Chisholm DJ. Dose-response curves for in vivo insulin sensitivity in individual tissues in rats. Am J Physiol 1985;248:E353–E362 [DOI] [PubMed] [Google Scholar]
- 19.Dai DF, Hsieh EJ, Liu Y, et al. Mitochondrial proteome remodelling in pressure overload-induced heart failure: the role of mitochondrial oxidative stress. Cardiovasc Res 2012;93:79–88 [DOI] [PMC free article] [PubMed] [Google Scholar]
- 20.Dai C, Brissova M, Reinert RB, et al. Pancreatic islet vasculature adapts to insulin resistance through dilation and not angiogenesis. Diabetes 2013;62:4144–4153 [DOI] [PMC free article] [PubMed] [Google Scholar]
- 21.Bustin SA, Benes V, Garson JA, et al. The MIQE guidelines: minimum information for publication of quantitative real-time PCR experiments. Clin Chem 2009;55:611–622 [DOI] [PubMed] [Google Scholar]
- 22.Kang L, Lantier L, Kennedy A, et al. Hyaluronan accumulates with high-fat feeding and contributes to insulin resistance. Diabetes 2013;62:1888–1896 [DOI] [PMC free article] [PubMed] [Google Scholar]
- 23.Cheng Q, Law PK, de Gasparo M, Leung PS. Combination of the dipeptidyl peptidase IV inhibitor LAF237 [(S)-1-[(3-hydroxy-1-adamantyl)ammo]acetyl-2-cyanopyrrolidine] with the angiotensin II type 1 receptor antagonist valsartan [N-(1-oxopentyl)-N-[[2′-(1H-tetrazol-5-yl)-[1,1′-biphenyl]-4-yl]methyl]-L-valine] enhances pancreatic islet morphology and function in a mouse model of type 2 diabetes. J Pharmacol Exp Ther 2008;327:683–691 [DOI] [PubMed] [Google Scholar]
- 24.Tonelli J, Kishore P, Lee DE, Hawkins M. The regulation of glucose effectiveness: how glucose modulates its own production. Curr Opin Clin Nutr Metab Care 2005;8:450–456 [DOI] [PubMed] [Google Scholar]
- 25.Balzan R, Agius DR, Bannister WH. Cloned prokaryotic iron superoxide dismutase protects yeast cells against oxidative stress depending on mitochondrial location. Biochem Biophys Res Commun 1999;256:63–67 [DOI] [PubMed] [Google Scholar]
- 26.Kajimoto Y, Kaneto H. Role of oxidative stress in pancreatic beta-cell dysfunction. Ann N Y Acad Sci 2004;1011:168–176 [DOI] [PubMed] [Google Scholar]
- 27.Ježek P, Dlasková A, Plecitá-Hlavatá L. Redox homeostasis in pancreatic β cells. Oxid Med Cell Longev 2012;2012:932838 [DOI] [PMC free article] [PubMed]
- 28.Guo S, Dai C, Guo M, et al. Inactivation of specific β cell transcription factors in type 2 diabetes. J Clin Invest 2013;123:3305–3316 [DOI] [PMC free article] [PubMed] [Google Scholar]
- 29.Pi J, Bai Y, Zhang Q, et al. Reactive oxygen species as a signal in glucose-stimulated insulin secretion. Diabetes 2007;56:1783–1791 [DOI] [PubMed] [Google Scholar]
- 30.Li N, Brun T, Cnop M, Cunha DA, Eizirik DL, Maechler P. Transient oxidative stress damages mitochondrial machinery inducing persistent beta-cell dysfunction. J Biol Chem 2009;284:23602–23612 [DOI] [PMC free article] [PubMed] [Google Scholar]
- 31.Sivitz WI, Yorek MA. Mitochondrial dysfunction in diabetes: from molecular mechanisms to functional significance and therapeutic opportunities. Antioxid Redox Signal 2010;12:537–577 [DOI] [PMC free article] [PubMed] [Google Scholar]
- 32.Bierhaus A, Schiekofer S, Schwaninger M, et al. Diabetes-associated sustained activation of the transcription factor nuclear factor-kappaB. Diabetes 2001;50:2792–2808 [DOI] [PubMed] [Google Scholar]
- 33.Bergman RN, Ader M. Atypical antipsychotics and glucose homeostasis. J Clin Psychiatry 2005;66:504–514 [DOI] [PubMed] [Google Scholar]
- 34.Ayala JE, Samuel VT, Morton GJ, et al. NIH Mouse Metabolic Phenotyping Center Consortium . Standard operating procedures for describing and performing metabolic tests of glucose homeostasis in mice. Dis Model Mech 2010;3:525–534 [DOI] [PMC free article] [PubMed] [Google Scholar]
- 35.Chung SS, Kim M, Youn BS, et al. Glutathione peroxidase 3 mediates the antioxidant effect of peroxisome proliferator-activated receptor gamma in human skeletal muscle cells. Mol Cell Biol 2009;29:20–30 [DOI] [PMC free article] [PubMed] [Google Scholar]
- 36.Archuleta TL, Lemieux AM, Saengsirisuwan V, et al. Oxidant stress-induced loss of IRS-1 and IRS-2 proteins in rat skeletal muscle: role of p38 MAPK. Free Radic Biol Med 2009;47:1486–1493 [DOI] [PMC free article] [PubMed] [Google Scholar]
- 37.Kang L, Lustig ME, Bonner JS, et al. Mitochondrial antioxidative capacity regulates muscle glucose uptake in the conscious mouse: effect of exercise and diet. J Appl Physiol (1985) 2012;113:1173–1183 [DOI] [PMC free article] [PubMed] [Google Scholar]
- 38.Best JD, Kahn SE, Ader M, Watanabe RM, Ni TC, Bergman RN. Role of glucose effectiveness in the determination of glucose tolerance. Diabetes Care 1996;19:1018–1030 [DOI] [PubMed] [Google Scholar]
- 39.Muscogiuri G, Salmon AB, Aguayo-Mazzucato C, et al. Genetic disruption of SOD1 gene causes glucose intolerance and impairs β-cell function. Diabetes 2013;62:4201–4207 [DOI] [PMC free article] [PubMed] [Google Scholar]
- 40.Tiedge M, Lortz S, Drinkgern J, Lenzen S. Relation between antioxidant enzyme gene expression and antioxidative defense status of insulin-producing cells. Diabetes 1997;46:1733–1742 [DOI] [PubMed] [Google Scholar]
- 41.Tanaka Y, Tran PO, Harmon J, Robertson RP. A role for glutathione peroxidase in protecting pancreatic beta cells against oxidative stress in a model of glucose toxicity. Proc Natl Acad Sci U S A 2002;99:12363–12368 [DOI] [PMC free article] [PubMed] [Google Scholar]
- 42.Babu DA, Deering TG, Mirmira RG. A feat of metabolic proportions: Pdx1 orchestrates islet development and function in the maintenance of glucose homeostasis. Mol Genet Metab 2007;92:43–55 [DOI] [PMC free article] [PubMed] [Google Scholar]
- 43.Larsen S, Stride N, Hey-Mogensen M, et al. Increased mitochondrial substrate sensitivity in skeletal muscle of patients with type 2 diabetes. Diabetologia 2011;54:1427–1436 [DOI] [PubMed] [Google Scholar]
- 44.Marchetti P, Del Guerra S, Marselli L, et al. Pancreatic islets from type 2 diabetic patients have functional defects and increased apoptosis that are ameliorated by metformin. J Clin Endocrinol Metab 2004;89:5535–5541 [DOI] [PubMed] [Google Scholar]


