

Abstract
Motivation: Circular RNAs (circRNAs) are an abundant class of highly stable RNAs that can affect gene regulation by binding and preventing microRNAs (miRNAs) from regulating their messenger RNA (mRNA) targets. Mammals have thousands of circRNAs with predicted miRNA binding sites, but only two circRNAs have been verified as being actual miRNA sponges. As it is unclear whether these thousands of predicted miRNA binding sites are functional, we investigated whether miRNA seed sites within human circRNAs are under selective pressure.
Results: Using SNP data from the 1000 Genomes Project, we found a significant decrease in SNP density at miRNA seed sites compared with flanking sequences and random sites. This decrease was similar to that of miRNA seed sites in 3' untranslated regions, suggesting that many of the predicted miRNA binding sites in circRNAs are functional and under similar selective pressure as miRNA binding sites in mRNAs.
Contact: pal.satrom@ntnu.no
Supplementary information: Supplementary data are available at Bioinformatics online.
1 INTRODUCTION
MicroRNAs (miRNAs) are small, ∼22-nt-long non-coding RNAs that are involved in gene expression regulation, through binding to so-called seed sites in 3′ untranslated regions (UTR) of target messenger RNAs (mRNAs) (Bartel, 2004). However, miRNAs are also thought to bind to a new class of non-coding RNAs called circular RNAs (circRNAs), a class of stable RNAs with a circular shape (Memczak et al., 2013). Many circRNAs contain predicted miRNA target sites, and at least two circRNAs can act as miRNA sponges that decrease the amount of miRNAs available for binding to their target mRNAs (Hansen et al., 2013; Memczak et al., 2013).
MicroRNA target sites located in mRNAs may harbour DNA variations such as single nucleotide polymorphisms (SNPs) (Borel and Antonarakis, 2008), which are short nucleotide insertions, deletions or substitutions that occur with a frequency ∼1% in a population. SNPs in miRNA target sites can affect miRNA binding to the target mRNA and subsequent gene regulation (Borel and Antonarakis, 2008; Gamazon et al., 2012; Ryan et al., 2010; Saetrom et al., 2009). Similarly, miRNA target sites on circRNA genes may also harbour SNPs that affect miRNA binding.
CircRNAs are getting more and more studied for their potential sponge effect (Hansen et al., 2013; Jeck et al., 2013; Memczak et al., 2013; Salzman et al., 2012), but the functional consequences of the many predicted miRNA sites in circRNAs remain unclear. Because predicted miRNA target sites on mRNAs have a decreased SNP density because of selective pressure at functional elements (Chen and Rajewsky, 2006; Mu et al., 2011; Saunders et al., 2007), we wondered whether the same is true for miRNA target sites in circRNAs. In this article, we look at the SNP distribution at predicted miRNA target sites located on circRNAs. Because polymorphisms can affect functionality, we expected that functional miRNA target sites on circRNAs would harbour fewer polymorphisms than random sites. By using SNP data from the 1000 genomes project (1000 Genomes Project Consortium, 2010), we found that circRNAs harbour a significant decrease in polymorphisms at predicted miRNA target sites, suggesting that many of these are functional sites under selective pressure.
2 METHODS
2.1 Datasets
We used human circRNA data from the Supplementary Table S2 of Memczak et al. (2013). From the University of California Santa Cruz (UCSC) Genome browser, we used the human genome assembly version 19 (hg19; Genome Reference Consortium human genome build 37, February 2009) and the Reference Sequence (RefSeq) gene annotation (hg19 version) (Meyer et al., 2013). The SNP coordinates were taken from the 1000 Genomes project (release version 3.20101123) (1000 Genomes Project Consortium, 2010). We used miRNA data from miRBase version 20 (Griffiths-Jones et al., 2006).
2.2 Identification of circRNA exons
Several types of information about circRNAs were available from Supplementary Table S2 of Memczak et al. (2013): chromosome, transcript start, end, and length, strand, the ‘best transcript’ ID and positions of predicted miRNA binding sites within the transcripts. To locate precise exon boundaries of circRNAs, there were several possible cases. In case the distance between the circRNA boundaries were equal to the transcript length, the circRNA had only one exon and its boundaries were those of the circRNA. Otherwise the circRNA had introns, which we excluded from the seed site analyses by using the following procedure. If a ‘best transcript’ ID was reported and matched a RefSeq transcript, we looked at its exons overlapping the circRNA locus, and if the first or last exons did not fit the boundaries, they were extended to the circRNA boundaries. In case no ‘best transcript’ was reported, we looked for miRNA complementary motifs in the circRNA unspliced sequence to identify which possible exons would fit the reported motif positions and the transcript length. More generally, we checked that the mature circRNA sequence fit the reported transcript length, circRNA boundaries and reported miRNA binding site positions. Some reported miRNA binding site positions did not fit sequential ordering of the exons, but a permutated order, in which case we permutated the exon order to automatically find the order that fits the miRNA site positions. The permutated order was only used to check reported miRNA binding site positions, to make sure we identified the correct exon boundaries; the sequential exon order was used in the analysis of this study. Finally, a special case happened for circRNA hsa_circ_001619, where one intron of the RefSeq gene was considered as exon in the circRNA gene, to fit reported transcript length and reported miRNA binding site positions.
2.3 MicroRNA seed motifs and miRNA families
MicroRNA motifs were defined as nucleotides 2–8 from the 5′ end of the 2578 mature human miRNA sequences, resulting in 2043 different motifs. Only considering human miRNAs also found in other organisms (miRNA families defined in the miRBase file miFam.dat) resulted in 1081 motifs.
2.4 Detection of miRNA-binding motifs in circRNAs
Circular RNA sequences were generated from exon positions of circRNAs, together with the human genome assembly. MicroRNA motif search was carried out for each reverse complementary motif in each circRNA sequence.
2.5 Distribution of SNPs at miRNA binding motif loci
For each unique motif locus identified, we looked for SNPs lying within the motif and in the 50 bp up- and down-stream regions on the transcript. SNP positions were calculated relative to the 3′ end of the reverse complement of the motif, i.e. the 5′ end of the miRNA mature sequence. In case of polymorphisms with a length different from one nucleotide, the 3′ end position of the variant was used. Polymorphism counts around miRNA target sites were normalized by dividing by the median count, so that the baseline value was one. Average SNP densities around miRNA target sites were computed at each position relative to the seed’s 5′ ends, and reported SNP density values were estimated by the median density at positions 2–7 for the seed and the median density at 50 bp up- and down-stream of the seed for the flanks (excluding seed positions 1–8). SNP density ratios were defined as the ratio of median SNP density in seed over median SNP density in flanks.
2.6 Randomization
All possible motifs of seven nucleotides (47 = 16 384 possibilities) were generated, and the motif search was carried out for each of these motifs in the circRNAs. We searched for SNPs at each identified locus and within the 50 bp up- and down-stream regions, resulting in a list of positions relative to the motif’s 3′ end for each locus. By sampling 2043 unique motifs without replacement (1081 for the miRNA-family filtered subset) from the 16 384 possible motifs, their previously identified motif positions could then be used to get their corresponding motif sites, and SNP positions relative to them, to compute SNP distribution for random motifs. The sampling procedure was repeated 1000 times resulting in 1000 distributions. Each distribution was normalized by dividing by its median count. For the randomized distributions, median and 95% confidence interval (CI) at each position relative to the motif site, were computed and compared with the actual distribution computed from all known miRNA motifs and from miRNA family-based motifs. To estimate P-values for a given SNP density ratio, we computed SNP density ratios of the random distributions. We checked that those random ratios were normally distributed and used them to compute normal Z scores, which were used together with the normal probability function to estimate P-values of the decrease in SNP density at seed sites.
2.7 Distribution of SNPs at splice sites
Similar to the SNP distribution around miRNA binding motifs, we computed the SNP distribution around splice sites by looking at SNP positions relative to exon starts or ends, and separating them according to circRNA strands. Distributions were corrected for strand, and those around exon starts on the positive strand and exon ends on the negative strand were grouped together, and vice versa. For each splice site type (5′ or 3′), we normalized the distributions by dividing by the median SNP count, and we took the median of the 2-nt-long SNP densities, and the median SNP density in corresponding intron and exon distributions to compute SNP density ratios. Also, we checked that the SNP densities in each group (introns, exons) are normally distributed and computed splice site Z-scores in each of the corresponding intron and exon distributions. Finally, we computed P-values for SNP densities in splice sites compared with SNP density in introns or exons, by comparing the Z-scores with the normal probability function. P-values comparing intron and exon SNP densities were given by t-tests.
3 RESULTS AND DISCUSSION
After identifying unambiguously the precise exon positions of the 1953 human circRNA transcripts reported by Memczak et al. (2013), we searched for 6mer, 7mer and 8mer seed sites for each of the 2043 human miRNA seed motifs within the 1906 circRNA sequences that mapped to the 22 autosomes. The search resulted in a total of 1 716 022 different unique loci including, respectively, 59.9, 21.9, 28.0 and 10.2% 6mer, 7merA1, 7merM8 and 8mer sites (Table 1). When only considering the 1081 motifs from miRNA families, corresponding to miRNAs that are evolutionary conserved, 1 061 146 different unique loci were identified in total (including respectively 57.4, 21.0, 24.0 and 8.7% 6mer, 7merA1, 7merM8 and 8mer sites).
Table 1.
SNP density at miRNA seed sites in circRNAs
| miRNA motifs | Loci type | # Loci (%) | SNP/hbp in flanks | SNP/hbp in seed site | SNP density ratio | P-value |
|---|---|---|---|---|---|---|
| 2043 motifs (all miR) | all | 100 | 1.47 | 1.35 | 0.92 | 3.6 × 10⁻²³ |
| 6mer | 59.9 | 1.47 | 1.36 | 0.92 | 1.3 × 10⁻¹⁸ | |
| 7merA1 | 21.9 | 1.45 | 1.32 | 0.91 | 7.7 × 10⁻⁸ | |
| 7merM8 | 28.0 | 1.47 | 1.33 | 0.90 | 6.0 × 10⁻¹⁶ | |
| 8mer | 10.2 | 1.47 | 1.27 | 0.86 | 4.6 × 10⁻⁹ | |
| 1081 motifs (miR family only) | all | 100 | 1.46 | 1.35 | 0.92 | 5.9 × 10⁻¹¹ |
| 6mer | 57.4 | 1.47 | 1.35 | 0.92 | 4.2 × 10⁻¹¹ | |
| 7merA1 | 21.0 | 1.45 | 1.28 | 0.88 | 1.8 × 10⁻⁷ | |
| 7merM8 | 24.0 | 1.47 | 1.33 | 0.91 | 2.8 × 10⁻⁸ | |
| 8mer | 8.7 | 1.46 | 1.21 | 0.83 | 1.4 × 10⁻⁷ |
Note: The columns show the set of miRNA motifs analysed, the seed types, the percentage of loci identified for each seed type, the SNP densities in SNP per 100 bp (SNP/hbp) for flanking regions and seed sites, the SNP density ratios of seed regions over flanks and the P-values of SNP density ratio from miRBase motifs compared with those from random motifs. We saw a decreased density at seed sites compared with flanking regions (decrease ranging from 8 to 17% depending on the seed types) and a significantly decreased density compared with a density based on random motifs.
We computed SNP distributions of 50 bp around the identified seed sites. The 1 716 022 loci and their flanking sequences harboured a median count of 1.47 SNP per 100 bp (SNP/hbp), and 1.35 SNP/hbp for the 6 bp of the seed sites that match nucleotides 2–7 of the miRNA seed motifs (Table 1). Consequently, we saw an 8% decrease of SNP density at 6mer seed sites compared with their flanking regions. Importantly, the seed sites more likely to cause strong miRNA regulation (Grimson et al., 2007) had a higher decrease in SNP density compared with their flanking regions, such that 8mer seed sites of conserved miRNAs had a 17% decrease in SNP density.
To check that the density decrease between seed sites and flanks was not an artefact of the method, we repeated our SNP density analysis 1000 times by sampling 2043 random motifs of seven nucleotides and computing SNP distributions. The randomization data were used to compute median and 95% CI distributions of SNP densities (as shown in black and grey in Figs 1 and 2). The randomization showed a larger variability in SNP density at the seed site than in flanking regions, but still the density from miRNA seed motifs was much lower than the 95% CI (P = 4.4 × 10⁻²⁴; see Table 1), suggesting that the decrease in SNP density is because of functional miRNA binding elements.
Fig. 1.
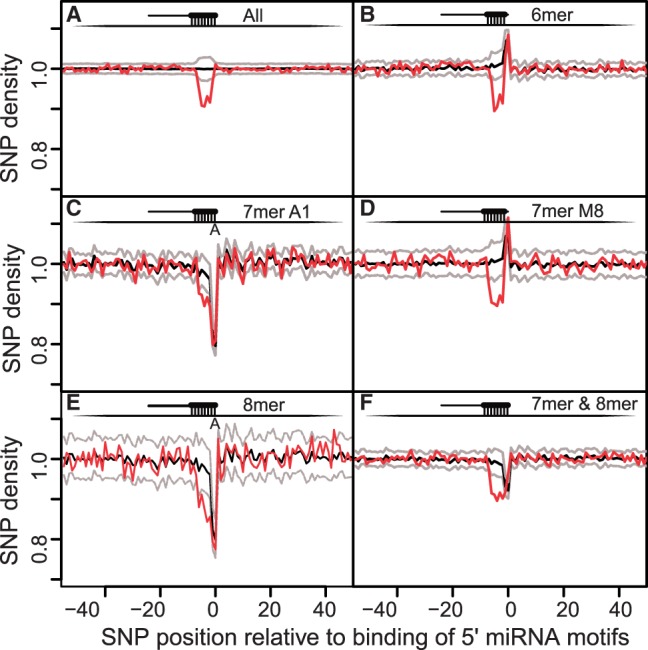
SNP density around miRNA complementary seed sites in circRNA transcripts. The x-axis shows SNP positions relative to predicted binding position of 5′ miRNAs. Values from [−7;−1] show the SNP densities at the seed sites. Panels A–F show respectively, SNP density for all the seed sites, 6mer, 7merA1, 7merM8, 8mer sites and finally all the seed sites except 6mers. Red lines are the actual SNP densities; black and grey lines are, respectively, the median and the 95% CI based on random motifs. We see a significant decrease of SNP density at the miRNA seed sites of circRNAs compared with flanking regions and random seed sites
Fig. 2.
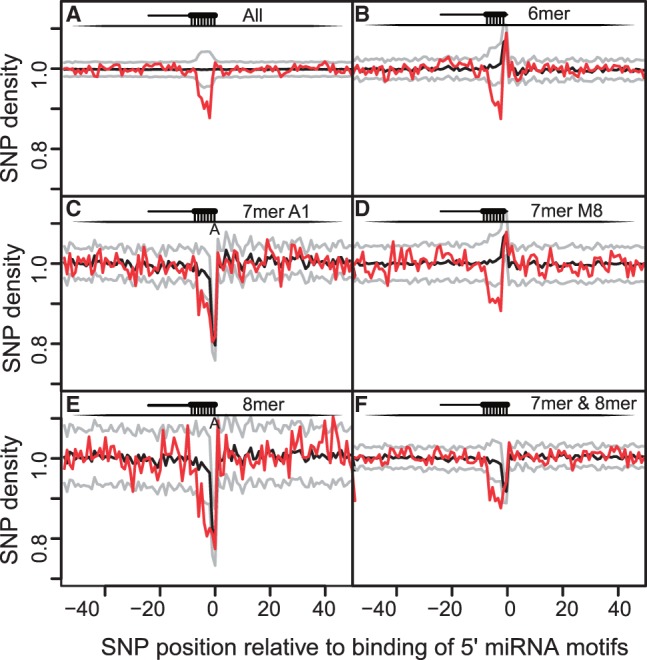
SNP density around miRNA complementary seed sites of miRNA motifs that are conserved (miRNA families). Similar to Figure 1, we see a decrease of SNP density at the seed site compared with flanking regions and random seed motifs (see Fig. 1 for details on the panels and curves)
When subdividing seed sites based on their types, the SNP distributions showed a strong decrease at position 0 (which corresponds to the first nucleotide at the miRNA 5′ ends) for 7merA1 and 8mer in the actual (red) distribution of miRBase motifs, but also for random distributions. In contrast, 6mers and 7merM8 sites had increased SNP densities at position 0. These patterns were because of the specific constraints that 8mers and 7merA1 have an A nucleotide at that position, and 7merM8 and 6mers can have any nucleotide except an A. More specifically, the SNPs that would be counted at that position for 7merA1 and 8mer plots would have an A as reference allele. But, because there are fewer SNPs with A or T as reference alleles (both 20.6%) than C or G (both 29.3%), this constraint resulted in the decrease at position 0 in Figures 1 and 2 for both the actual and random distributions. Similarly, for the 7merM8 and 6mer plots, there is an increase for both the actual and random distributions because nucleotides at that position in the motif cannot be A but only T, C or G, which are more likely to be reference alleles than if A was also included. Therefore, the increases and decreases at position 0 are artefacts because of differences in reference allele probabilities. Further analyses of the miRNA targeting variables from TargetScan (Garcia et al., 2011) (see Supplementary Methods) showed that there is still an SNP density depletion at seed sites (see Supplementary Results). However, miRNA motifs with CG dinucleotides (CpG) were more likely to harbour SNPs at complementary sites (see Supplementary Results), as CpG sites are more likely to be methylated and therefore mutated.
Our results showed that the SNP density decrease in circRNAs ranges from 8 to 17%, which fits results from previous studies that reported an SNP density decrease ranging from 10 to 16% (Mu et al., 2011) for miRNA binding on mRNAs (excluding 6mers) depending on the location in 3′ UTR. Similarly, it is known that mRNA exons harbour decreased SNP density compared with introns (Mu et al., 2011). Therefore, we looked at splice sites of circRNAs and confirmed the significant decreased SNP density at circRNA exons, and particularly at splice sites (Fig. 3 and Table 2). The strong selection against SNPs at splice sites likely reflects that splicing is essential in circRNA maturation.
Fig. 3.
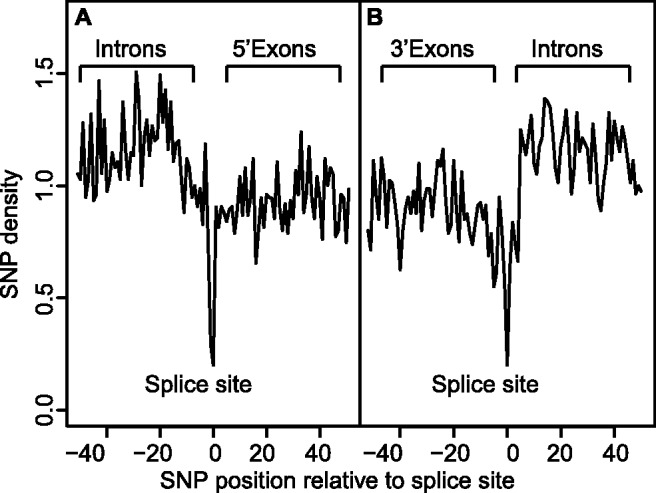
SNP distribution at splice sites of circRNAs. Panel A and B show respectively SNP distributions at exons’ 5′ and 3′ ends. Distributions are corrected for circRNA strands, and normalized by the median SNP count. The x-axis shows SNP positions relative to the splice site. On both panels, we see a higher SNP density for introns, a clear decrease at the splice sites and a lower density at exons compared with introns
Table 2.
SNP density at splice sites at exons’ 5′ and 3′ ends, and at their flanking exonic and intronic regions
| End | Regions | Ratio (%) | P-value |
|---|---|---|---|
| 5′ | splice sites versus introns | 21.7 | 1.5 × 10⁻⁷ |
| 5′ | splice sites versus exons | 26.6 | 4.8 × 10⁻⁹ |
| 3′ | splice sites versus introns | 34.6 | 9.2 × 10⁻⁶ |
| 3′ | splice sites versus exons | 43.3 | 1.4 × 10⁻⁴ |
| 5′ | exons versus introns | 81.7 | 4.5 × 10⁻¹⁰ |
| 3′ | exons versus introns | 78.3 | 1.1 × 10⁻¹⁰ |
Note: The columns show the exon end denoting the type of splice site, the regions compared (splice site, exons and introns), the SNP density ratio of the first region over the second and the P-values describing how the densities differ (see Section 2). We saw a significant decrease in SNP density at splice sites compared with exons and introns, as well as when comparing exons with introns.
4 CONCLUSION
We found that circRNAs have a decreased SNP density at miRNA seed sites compared with both flanking regions and SNP distributions at random seed motifs. This decrease was comparable with previously reported SNP densities at miRNA target sites in mRNA 3′ UTRs, suggesting that miRNA seed sites within circRNAs have similar selective pressure as miRNA seed sites within 3′ UTRs. Consequently, the sponge effect of circRNAs on miRNAs may be as functionally important as miRNA’s regulatory effect on mRNAs.
Funding: The eScience program of the Research Council of Norway.
Conflict of Interest: none declared.
Supplementary Material
REFERENCES
- 1000 Genomes Project Consortium, (2010).A map of human genome variation from population-scale sequencing. Nature. 2010;467:1061–1073. doi: 10.1038/nature09534. [DOI] [PMC free article] [PubMed] [Google Scholar]
- Bartel D. MicroRNAs: genomics, biogenesis, mechanism, and function. Cell. 2004;116:281–297. doi: 10.1016/s0092-8674(04)00045-5. [DOI] [PubMed] [Google Scholar]
- Borel C, Antonarakis SE. Functional genetic variation of human miRNAs and phenotypic consequences. Mamm. Genome. 2008;19:503–509. doi: 10.1007/s00335-008-9137-6. [DOI] [PubMed] [Google Scholar]
- Chen K, Rajewsky N. Natural selection on human microRNA binding sites inferred from SNP data. Nat. Genet. 2006;38:1452–1456. doi: 10.1038/ng1910. [DOI] [PubMed] [Google Scholar]
- Gamazon ER, et al. Genetic architecture of microRNA expression: implications for the transcriptome and complex traits. Am. J. Hum. Genet. 2012;90:1046–1063. doi: 10.1016/j.ajhg.2012.04.023. [DOI] [PMC free article] [PubMed] [Google Scholar]
- Garcia DM, et al. Weak seed-pairing stability and high target-site abundance decrease the proficiency of lsy-6 and other microRNAs. Nat. Struct. Mol. Biol. 2011;18:1139–1146. doi: 10.1038/nsmb.2115. [DOI] [PMC free article] [PubMed] [Google Scholar]
- Griffiths-Jones S, et al. miRBase: microRNA sequences, targets and gene nomenclature. Nucleic Acids Res. 2006;34:D140–D144. doi: 10.1093/nar/gkj112. [DOI] [PMC free article] [PubMed] [Google Scholar]
- Grimson A, et al. MicroRNA targeting specificity in mammals: determinants beyond seed pairing. Mol. Cell. 2007;27:91–105. doi: 10.1016/j.molcel.2007.06.017. [DOI] [PMC free article] [PubMed] [Google Scholar]
- Hansen TB, et al. Natural RNA circles function as efficient microRNA sponges. Nature. 2013;495:384–388. doi: 10.1038/nature11993. [DOI] [PubMed] [Google Scholar]
- Jeck WR, et al. Circular RNAs are abundant, conserved, and associated with ALU repeats. RNA. 2013;19:141–157. doi: 10.1261/rna.035667.112. [DOI] [PMC free article] [PubMed] [Google Scholar]
- Memczak S, et al. Circular RNAs are a large class of animal RNAs with regulatory potency. Nature. 2013;495:333–338. doi: 10.1038/nature11928. [DOI] [PubMed] [Google Scholar]
- Meyer LR, et al. The UCSC Genome Browser database: extensions and updates 2013. Nucleic Acids Res. 2013;41:D64–D69. doi: 10.1093/nar/gks1048. [DOI] [PMC free article] [PubMed] [Google Scholar]
- Mu XJ, et al. Analysis of genomic variation in non-coding elements using population-scale sequencing data from the 1000 Genomes Project. Nucleic Acids Res. 2011;39:7058–7076. doi: 10.1093/nar/gkr342. [DOI] [PMC free article] [PubMed] [Google Scholar]
- Ryan BM, et al. Genetic variation in microRNA networks: the implications for cancer research. Nat. Rev. Cancer. 2010;10:389–402. doi: 10.1038/nrc2867. [DOI] [PMC free article] [PubMed] [Google Scholar]
- Saetrom P, et al. A risk variant in an miR-125b binding site in BMPR1B is associated with breast cancer pathogenesis. Cancer Res. 2009;69:7459–7465. doi: 10.1158/0008-5472.CAN-09-1201. [DOI] [PMC free article] [PubMed] [Google Scholar]
- Salzman J, et al. Circular RNAs are the predominant transcript isoform from hundreds of human genes in diverse cell types. PLoS One. 2012;7:e30733. doi: 10.1371/journal.pone.0030733. [DOI] [PMC free article] [PubMed] [Google Scholar]
- Saunders MA, et al. Human polymorphism at microRNAs and microRNA target sites. Proc. Natl Acad. Sci. USA. 2007;104:3300–3305. doi: 10.1073/pnas.0611347104. [DOI] [PMC free article] [PubMed] [Google Scholar]
Associated Data
This section collects any data citations, data availability statements, or supplementary materials included in this article.