

Abstract
There has been little research on the fluency of language production and individual differences variables, such as intelligence and executive function. In this study, we report data from 106 participants who completed a battery of standardized cognitive tasks and a sentence production task. For the sentence production task, participants were presented with two objects and a verb and their task was to formulate a sentence. Four types of disfluency were examined: filled pauses (e.g. uh, um), unfilled pauses, repetitions, and repairs. Repetitions occur when the speaker suspends articulation and then repeats the previous word/phrase, and repairs occur when the speaker suspends articulation and then starts over with a different word/phrase. Hierarchical structural equation modeling revealed a significant relationship between repair disfluencies and inhibition. Conclusions focus on the role of individual differences in cognitive ability and their role in models and theories of language production.
Keywords: language production, speech fluency, intelligence, executive function, disfluency, inhibitory control, inhibition
1.0 Introduction
Naturalistic speech is often disfluent (Maclay & Osgood, 1959). It has been estimated that disfluencies occur on average six to ten times per 100 words (Fox Tree, 1995; Shriberg, 1996, 2001). In this study, we focused on four types of disfluency. The first are filled pauses, such as uh and um. The second are unfilled (or silent) pauses. The third are repetitions, which refer to unintended repeats of a word or a string of words (e.g., the papaya … the papaya was sweet). The fourth are repairs. A repair occurs when a speaker stops speaking and then starts over with some new word or phrase (e.g., the mango … papaya). Different types of disfluency are thought to arise from a variety problems and difficulties in the course of speaking (Arnold, Tanenhaus, Altmann, & Fagnano, 2004; Bock, 1996; O’Connell & Kowal, 2005). Filled pauses, for example, often occur at sentence initial positions, which suggests that they are linked with planning difficulty (Bortfeld, Leon, Bloom, Schober, & Brennan, 2001; Clark & Fox Tree, 2002). Other work has suggested that filled pauses serve a variety of other more “pragmatic” functions, such as an announcement that new information is upcoming and as a tool for managing turn-taking in conversation (e.g., the speaker has more to say and wants to continue “holding the floor”). In contrast, unfilled pauses, repetitions, and repairs are more directly indicative of processing difficulty within the language production system, for example, planning what is to be said, retrieving words, formulating phrasal structure, etc. (Barr, 2001; Clark, 1994; Clark & Wasow, 1998; Fox Tree & Clark, 1997).
One prominent model designed to capture the processes and demands of language production was proposed by Levelt (1983, 1989, 1999). His model consists of three main stages: conceptualization, formulation, and articulation. The fundamental idea is that a non-linguistic representation is sequentially elaborated lexically, syntactically, and phonologically in the course of speaking (Bock & Levelt, 1994; Ferreira & Engelhardt, 2006). Many models, including Levelt’s, additionally assume the existence of a monitor, which is a mechanism whereby speakers check the appropriateness of their speech prior to articulation (for reviews, see Blackmer & Mitton, 1991; Hartsuiker & Kolk, 2001; Postma, 1997, 2000). The speech monitor in Levelt’s model is a centralized mechanism that receives the output from the conceptualization and formulation stages, and it operates by perceiving internal speech. This occurs as the production system incrementally produces phonetic plans, which are stored in a buffer prior to articulation. It has been estimated that articulation takes place 200–250 ms after the creation of a phonetic plan (Postma, 2000), which corresponds to the time that information is stored in the buffer. The speech monitor, which “listens” to or comprehends inner speech, is assumed to require processing time in the neighborhood of 150–200 ms (Marslen-Wilson & Welsh, 1978). These timing estimates therefore, suggest that the language production system has at most 100–150 ms to detect an error, and then initiate a correction so that the error does not become part of the speech signal (Nooteboom, 1980).
1.1 Intelligence and Executive Function
An important, but understudied, factor in the production of disfluency is individual differences. The mean distribution, as assessed by several corpus analyses, is six-to-ten disfluencies per 100 words. However, individual speakers vary by up to three times that amount (Shriberg, 2001), and individuals also differ in the types of disfluency they tend to produce (Bortfeld et al., 2001). The current study focuses on individual differences in disfluency production, and whether intelligence and/or executive functions have an influence both on speaker’s tendencies to be disfluent and on the types of disfluencies they produce. To our knowledge, there has never been a systematic investigation of these issues.
A relationship between disfluency production and intelligence would be interesting because it would suggest that some problems associated with language production may be linked to more general processing abilities, and not to specific mechanisms of the language production system (e.g., the speech monitor). Relatedly, a relationship between disfluencies and executive function would also be interesting because it would begin to reveal how lower-level cognitive control mechanisms affect language outputs. Executive functions are typically defined as control mechanisms that regulate and modulate performance of various higher-order cognitive processes (Burgess, 1997; Denckla, 1996; Logan, 1985; Miyake et al., 2000; Rabbit, 1997).
The three most frequently postulated executive functions are set shifting, updating/monitoring working memory, and inhibition (Miyake et al., 2000). Previous research has shown that these three executive functions are related to one another, but can be dissociated in statistical models (Duncan, Johnson, Swales, & Freer, 1997; Friedman & Miyake, 2012; Teuber, 1972). In the current study, we utilized four cognitive tasks that are believed to tap two executive functions (i.e., set shifting and inhibition). Set shifting reflects the ability to switch back and forth between tasks or mental sets (Mayr & Kliegl, 2000; Rogers & Monsell, 1995; Spector & Biederman, 1976), and a classic measure of set shifting is perseveration errors in the Wisconsin Card Sorting task (Stuss & Benson, 1986). Inhibition, on the other hand, reflects the ability to inhibit or suppress competing responses and/or distracting stimuli. Examples of inhibition tasks are the Stroop task and the Stop Signal task (Casey et al., 1997; Friedman & Miyake, 2004; Logan, 1994).
There have been many latent variable studies of executive function and intelligence. A prominent example was conducted by Friedman et al. (2006). Their study investigated the extent to which executive functions and intelligence are related to one another (see also Friedman et al., 2007; Kline, 1991; Miyake et al., 2000). Executive functions and intelligence both involve general cognitive ability, and so one would naturally expect some degree of shared variance (Ardila, Pineda, & Rosselli, 2000). Indeed, Jester et al. (2009) showed that intelligence and executive functions were correlated-dissociable factors, and that these abilities transmitted independently in families (see also Martin, 2001). However, there is variability in the amount of shared variance between the different executive functions and intelligence. Friedman et al. (2006) reported that the shared variance between intelligence and inhibition, and intelligence and set shifting was relatively low (i.e., only 2–14% of the variance was shared). In contrast, working memory has much more shared variance with intelligence .70 – .79 (Ackerman, Beier, & Boyle, 2005; Friedman et al., 2006; Friedman et al., 2007; Miyake et al., 2000).
1.2 Current Study
In the current study, we examined the relationships between intelligence and executive function, and how they relate to the tendency to produce different types of disfluency. The data for this investigation came from a large-scale research project that involved community-recruited adolescent and adult participants. The primary aim of that study was to investigate the cognitive profile of individuals with Attention-Deficit/Hyper-Activity Disorder (ADHD). However, the project also recruited a large number of typically-developing (control) participants. For the purposes of this investigation, we focused only on the data provided by controls. We utilized a latent-variable approach, which has several advantages given the goals of the study and the nature of the dataset. The first is that latent variables represent shared variance from multiple tasks used to tap the same underlying construct. Therefore, latent variables are less susceptible to idiosyncratic task properties. The second advantage is because measurement error is separated from a latent variable, the latent variable provides a purer measure of the constructs of interest. We used three subtests from the Wechsler Intelligence Scales (Wechsler, 1997a, 1997b) to construct a latent variable representing intelligence (Spearman, 1927). For executive functions, the dataset contained tasks that assessed both set shifting and inhibition. Participants completed the Wisconsin Card Sorting task and the Trail Making task, which both assess set shifting, and they also completed the Stop Signal task and the Stroop task, which both assess inhibition.
For inhibition, we included one additional variable, which was hyper-active/impulsive T-scores from the Conner’s behavioral rating scale. We did this for three reasons. First, prominent theories of ADHD assume that deficits in inhibitory control underlie ADHD symptomology (Barkley, 1997; Nigg, 2001; Pennington & Ozonoff, 1996; Schachar, Tannock, Marriott, & Logan, 1995; Tannock & Schachar, 1996). Second, the pattern of correlations between hyperactive-impulsive symptoms and the two inhibition tasks suggested shared variance. Third, Conners questionnaires are well validated and assess (dys)executive symptomologies (Burgess, Alderman, Evans, Emslie, & Wilson, 1998; Nigg, Carr, Martel, & Henderson, 2007). Therefore, by including hyperactive-impulsive symptoms, the latent variable indexed executive dysfunction in everyday activities, which is consistent with the view of executive functions providing “control” for a wide range of higher-order cognitive processes (Burgess, 1997).
Our main research question was whether individual differences in disfluency production are more related to intelligence or to executive function. Theoretically, this question is important because it asks whether disfluencies are more related to low-level cognitive control (i.e. executive function) or whether disfluencies are more related to intelligence. We assume that intelligence reflects functioning across broader and wider neural networks, whereas executive functions reflect more specific cognitive-control abilities. To address this research question, we created a structural equation model that included three latent variables (i.e., intelligence, inhibition, and set shifting). We ensured that our data fit the model, and then, we added a disfluency variable. To examine the contribution of each latent variable on disfluency production, we used hierarchical tests.
To conduct hierarchical tests, we built pathways from each latent variable to the disfluency variable. We first ensured that model fit was good with disfluency included. Second, we sequentially set each of the pathways from the latent variables to the disfluency variable equal to zero. If model fit significantly decreased when a particular pathway was set to zero, then it indicates that there is significant variance associated with that pathway. We elected to test each type of disfluency separately because some have argued that the surface form of different types of disfluency reflect distinct problems within the production system (Garrett, 1982). However, the literature is far from clear on this issue (for a review, see Bock, 1996). Maclay and Osgood (1959) reported relatively low correlations between the different types of disfluency in their study, which suggests different distributions for the different categories or types of disfluency (see also Deese, 1980). As a hypothetical example, if unfilled pauses are associated with word retrieval failures and repetitions are associated with planning difficulty, then low correlations between unfilled pauses and repetitions would be expected. In contrast, if unfilled pauses occur in response to both word retrieval and planning problems, and vice versa for repetitions, then correlations between the two should be higher.
Filled pauses are somewhat more complex. Clark and Fox Tree (2002) argued that filled pauses are “helpful” collateral signals that speakers produce primarily when a delay is imminent. If filled pauses are indeed produced as a helpful signal rather than as a symptom of production difficulty, then one might expect a positive relationship between the number of filled pauses produced and other cognitive abilities (e.g. intelligence and executive function). Unfilled pauses and repetitions are sometimes referred to as covert errors, and have been typically linked with several issues, such as planning what is to be said, retrieving words, formulating phrasal structure, etc. Because covert repairs do not have a reparandum, it is difficult to ascertain what caused the disfluency. Repairs, in contrast, do have a reparandum, and are often cases in which a speaker produces the wrong word (e.g. saying left when right was intended). Thus, repairs are have sometimes been linked to monitoring failures (Levelt, 1983; Postma, Kolk, & Povel, 1990). However, the notion that particular types of disfluency are associated with different underlying causes remains a debated issue (Bock, 1996).
The goals of this study were to provide (1) a better understanding of individual differences in the fluency of speech production, (2) a better understanding of the role that more general cognitive abilities have on monitoring and error correction during language production, and (3) a better understanding of the different types of disfluencies and what may or may not cause them to occur. The findings from this study have important implications for models and theories of language production, and specifically, how individual differences in cognitive control and intelligence affect language output.
2.0 Method
2.1 Participants
Participants were 106 adolescents and adults who were recruited from the community, which provided a broad sample containing a wide range of abilities. Participants ranged in age from 14 to 35 (M = 18.8, SD = 5.13), and 60 were male. All participants completed a comprehensive multi-stage testing procedure. After an initial telephone screen, they participated in two laboratory visits.
During the first visit, participants completed a set of clinical measures, including a semi-structured clinical interview (i.e., for adults the Structured Clinical Interview for DSM-IV, and for adolescents and their parents the Kiddie Schedule for Affective Disorders and Schizophrenia; Puig-Antich & Ryan, 1986). Participants also completed several well-validated clinical questionnaires (e.g., Current Symptoms Scale; Barkley & Murphy, 2006; Young Adult Self Report Scale; Achenbach, 1991; Young Adult ADHD Rating Scale; Conners, Erhart, & Sparrow, 1999). During this visit, participants also completed the assessments of intelligence. In the second laboratory session, participants completed a battery of cognitive tasks, which were administered in a fixed order (Martel, Nikolas, & Nigg, 2007). Table 1 contains descriptive statistics for the tasks employed in the current study, and Table 2 shows bivariate correlations between variables.
Table 1.
Descriptive statistics for the intelligence sub-tasks, executive function tasks, clinical measures, and disfluencies
| Task | N | Mean | SD | Min | Max | Skew | Kurtosis |
|---|---|---|---|---|---|---|---|
| IQ tests | |||||||
| Matrix/Block | 106 | 11.64 | 2.81 | 2.00 | 18.00 | −.36 | 1.16 |
| Vocabularya | 106 | 3.44 | .40 | 2.24 | 4.36 | −.18 | .26 |
| Similaritiesa | 106 | 3.44 | .41 | 2.45 | 4.36 | .15 | −.38 |
| EF tasks | |||||||
| Stop signal RTc | 106 | 5.47 | .24 | 4.55 | 6.13 | .06 | 2.10 |
| Stroop | 106 | 9.64 | 8.36 | −11.39 | 35.81 | .24 | .91 |
| Trails B – A | 106 | 28.39 | 14.73 | −8.00 | 80.69 | .61 | 1.78 |
| Perseveration errorsb | 106 | .17 | .06 | .05 | .33 | .20 | .09 |
| Clinical measures | |||||||
| Hyperactiv/Impulsivc | 106 | 3.88 | .14 | 3.58 | 4.28 | .44 | .67 |
| Disfluencies | |||||||
| Unfilled pausesd | 106 | 10.31 | 14.27 | −23 | 44.41 | −.29 | .20 |
| Filled pausesd | 106 | −14.47 | 10.81 | −23 | 12.64 | .74 | −.90 |
| Repetitionsd | 106 | −14.97 | 9.55 | −23 | 3.65 | .50 | −1.43 |
| Repairsd | 106 | −5.90 | 13.18 | −23 | 22.38 | .12 | −.81 |
Note.
square root transformation,
inverse transformation,
logarithm transformation, and
rationalized arcsine transformation (Studebaker, 1985).
Table 2.
Bivariate correlations between intelligence, neuropsychological measures of executive function, and disfluencies
| Variable | 1 | 2 | 3 | 4 | 5 | 6 | 7 | 8 | 9 | 10 | 11 | 12 | 13 |
|---|---|---|---|---|---|---|---|---|---|---|---|---|---|
| 1. Age | - | .20* | .09 | −.01 | −.15 | −.18# | −.04 | −.05 | −.01 | −.08 | .02 | −.12 | .05 |
| 2. Matrix/Block | - | .50** | .45** | −.12 | .15 | −.31** | −.28** | −.07 | −.19 | −.02 | −.09 | −.27** | |
| 3. Vocabulary | - | .64** | −.09 | .03 | −.10 | −.30** | −.08 | −.22* | .14 | −.04 | −.22* | ||
| 4. Similarities | - | .01 | .09 | −.16 | −.22* | −.11 | −.12 | .09 | .00 | −.15 | |||
| 5. Stop signal RT | - | −.15 | .16 | .04 | .18# | .01 | −.04 | −.04 | −.01 | ||||
| 6. Stroop | - | −.19* | −.13 | −.19# | −.07 | .14 | −.19* | −.32** | |||||
| 7. Trails B – A | - | .42** | .06 | .09 | .03 | .03 | .17 | ||||||
| 8. Perseveration errors | - | −.03 | −.08 | .11 | −.03 | −.21* | |||||||
| 9. Hyperactivity-Impulsivity | - | .07 | .06 | .02 | .08 | ||||||||
| 10. Unfilled pauses | - | .26** | .04 | .28** | |||||||||
| 11. Filled pauses | - | .01 | .27** | ||||||||||
| 12. Repetitions | - | .11 | |||||||||||
| 13. Repairs | - |
Note.
p < .07,
p < .05,
p < .01.
2.2 Standardized Measures
2.2.1 Intelligence
Participants completed several subtests of the Wechsler Adult Intelligence Scale third edition (WAIS-III) for participants 17 years of age and older, or the Wechsler Intelligence Scale for Children fourth edition (WISC-IV) for participants 16 years of age and younger (Sattler, 2001). The subtests used in the current investigation were vocabulary, similarities, matrix reasoning from the WAIS-III, and block design from the WISC-IV.
2.2.2 Wisconsin Card Sorting Test
A computerized version of the Wisconsin Card Sorting Test was administered. The task requires participants to match a card to one of four other cards based on one of four attributes (shape, color, quantity, or design). Participants were given feedback after every decision. After 10 correct decisions, the correct match attribute changed. The dependent measure was number of perseveration errors, that is, the number of incorrect decisions based on the previous match attribute. Perseveration errors indicate poorer set-shifting or flexibility in the face of changing task requirements (Anderson, Damasio, Jones, & Tranel, 1991).
2.2.3 Trail Making Task
The Trail Making task is a commonly used paper-and-pencil task to assess set-shifting abilities (Reitan, 1958). In part A, the participant rapidly connects a series of numbers in sequential order. In part B, the participant must rapidly draw a line between alternating numbers and letters in sequential and alphabetical order, respectively. Part B, therefore, requires the ability to rapidly shift between two mental sets (Arbuthnott & Frank, 2000). The time to complete part A was subtracted from the time to complete part B, and so higher scores indicate worse performance.
2.2.4 Stroop Task
The Stroop task assesses inhibition (or interference control), that is, the ability to monitor response conflict and suppress a competing response in order to successfully execute the task requirements. Participants completed a paper-and-pencil version of the Stroop task (Golden, 1978; Stroop, 1935), in which individual trials occurred at 45 second intervals. An interference control composite score was calculated by regressing the color-word naming score on the word-reading and color-naming scores and saving the unstandardized residual (Martel et al., 2007; Nigg, Blaskey, Huang-Pollack, & Rappley, 2002). Higher scores indicated better performance.
2.2.5 Stop Task
The Stop task assesses response inhibition, which is the ability to suppress a prepotent motor response (Dempster & Corkill, 1999; Logan, 1994). In this task, participants saw an X or an O on a computer screen and they had to respond as rapidly as possible with one of two keys. These are called “go” trials. On 25% of the trials, a tone sounded shortly after the X or O was displayed. The tone was a signal that participants should withhold their response. These are called “stop” trials. A stochastic tracking procedure was used to calculate stop signal reaction time (SSRT), or how much warning each participant needed to interrupt the button response. Stop signal reaction time was calculated by subtracting the average stop signal delay from average reaction time (Logan, 1994).
2.2.6 Sentence Production
On critical trials, participants were presented with two pictures and a verb (see Figure 1). One picture was an animate object and the other was an inanimate object. The verb was either an unambiguous past participle verb (e.g. ridden) or a verb that could be used optionally in past tense and past participle forms (e.g. dropped). On half of the trials, the inanimate object was presented first, and on the other half, the animate object was presented first. In general, participle verbs lead to more difficulty because they allow fewer syntactic options compared to the optional verbs (Engelhardt, Ferreira, & Nigg, 2009; cf. Schachter, Christenfeld, Ravina, & Bilous, 1991). The optional verbs can be used in active past tense sentences (The man moved the chair), active past participle sentences (The man had moved the chair), or passive sentences (The chair was moved by the man). The participle verbs can be used in active past participle sentences (The girl had ridden the bike) or passive sentences (The bike was ridden by the girl). The active past tense sentence is not available with participle verbs (i.e. *The girl ridden the bike), and so these verbs have one less syntactic option. The participle verbs included both irregulars (e.g. torn) and -en affixes (e.g. ridden).
Figure 1.
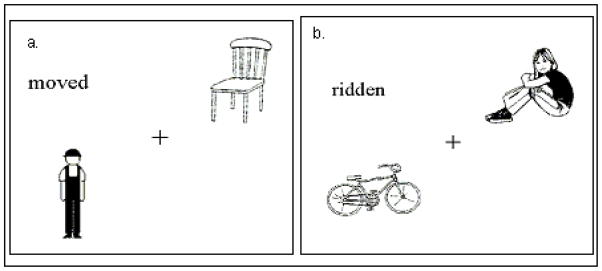
Example stimuli, panel (a) shows an ambiguous verb, and panel (b) shows a participle verb.
For this task, the objects appeared one after the other and were followed by the verb. Each trial began with a fixation cross presented in the center of the computer screen. This was the participants’ cue that s/he could press the space bar to see the first object. After 1 s a second object appeared. It was followed 1 s later by the verb. Participants were instructed to begin speaking as soon as possible. Participants were given four practice trials with feedback, followed by 54 regular session trials. Thirty-six of these were the critical trials, as described above. We also included 18 filler trials that had one picture and an intransitive verb (e.g. melted).
Participant responses were recorded to audiotape, and then transcribed and coded. Four types of disfluency were examined: filled pauses (i.e. uh, um, & er), unfilled pauses, repetitions, and repairs. Unfilled pauses were coded as a disfluency only if they lasted for longer than 1 s (to rule out ordinary prosodic pauses). Repetitions refer to unintended repeats of a word or a string of words (e.g. The ball… the ball was dropped by the boy). Repairs occur when a speaker suspends articulation, and then starts over with some new word or phrase (e.g., The girl…the boy dropped the ball). The data were transcribed and coded by two trained research assistants who transcribed and coded the same data from 50 participants. Inter-rater reliability was excellent; there was 95.2% agreement. The few disagreements that did exist were re-evaluated and resolved. Each research assistant then coded approximately half of the remaining data. The order of trials was randomly determined for each participant. The proportion of trials with a particular type of disfluency is shown in Figure 2.
Figure 2.
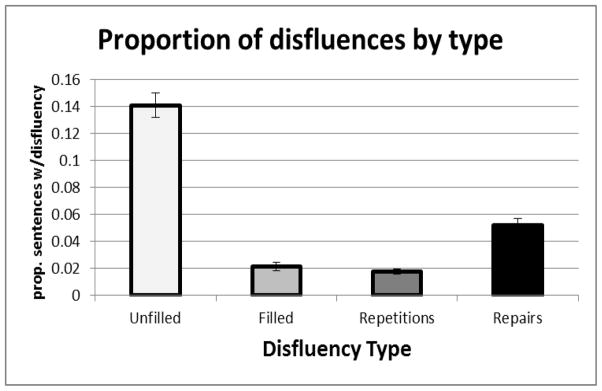
Proportion of sentences with particular type of disfluency. Error bars show the standard error of the mean.
2.3 Data Screening and Preparation
Data points greater than 4.0 standard deviations from the mean for each variable in the data set were defined as outliers. Outliers were moved toward the mean with rank order preserved, so that all data points fell within 3.5 SDs of the mean (McCartney, Burchinal, & Bub, 2006; Wilcox, 2002; Wilcox, Keselman, & Kowalchuk, 1998). This resulted in the adjustment of only four data points. There were eleven missing data points due to either a problem with the experiment software, a participant error, or an experimenter error. Because there were so few missing data points (i.e., < 1.0% of the total), we imputed missing values with the mean of each variable. This avoids listwise deletion and the corresponding reduction in power (Shafer & Graham, 2002). The reliability of the Wechsler tests are consistently between .76 – .97 (Wechsler, 1997a, 1997b). The reliability of the stop signal task and the Stroop task have been reported as high as .80 (e.g. Friedman et al., 2006). Finally, multivariate tests are sensitive to deviations from normality, and therefore, careful screening is required prior to inferential analyses (Kline, 1998). We applied transformations (i.e. square root, logarithm, or inverse) to the skewed variables in the dataset (see Table 1). To assess multivariate outliers, we examined Cook’s D. Variables greater than 1 were consider potential outliers: however, there were none.
2.4 Analysis procedures
Structural equation models were created and run using AMOS. In the analyses, we report several fit indices for our models, which is recommended practice (Anderson & Gerbing, 1988; Gonzalez & Griffin, 2001; Hu & Bentler, 1995, 1998; Kane et al., 2004; Kline, 1998; Miyake, Friedman, Rettinger, Shah, & Hegarty, 2001). The chi-square statistic reflects significant differences between the observed covariance matrix and the reproduced covariance matrix. With chi-squared tests, a non-significant value is desirable (Satorra & Bentler, 2001). We also report the confirmatory fit index (CFI) and the normed fit index (NFI). These tests reflect improvement of the model fit relative to a baseline model in which all covariances are zero. These tests reflect the proportion of the observed covariance matrix explained by the model, and so, these fit indices reflect how well the model fits the data. The traditional acceptability levels of the CFI and NFI is .90 (Stevens, 2002). Finally, we report the root mean square error of approximation (RMSEA). Here values less than .05 indicate good fit (Kline, 1998). In cases where we wanted to compare (nested) models, we utilized a chi square difference test in order to determine whether one model fit the data significantly better than another.
3.0 Results
The primary research question that we asked was whether disfluency production is more related to intelligence, inhibition, or set shifting. We began by constructing a three factor model (see Figure 3). Fit indices showed that a three latent variable model fit the data well [χ2(17) = 18.59, p = .35, CFI = .987, NFI = .878, RMSEA = .030]. A two factor model, that contrasted intelligence and executive function, also fit reasonably well [χ2(19) = 24.63, p = .17, CFI = .955, NFI = .838, RMSEA = .053]. However, a one factor model did not fit well [χ2(20) = 42.35, p = .002, CFI = .819, NFI = .721, RMSEA = .103]. A chi-squared difference test showed that model fit was significantly better with the three factor model than with the two factor model Δχ2(1) = 6.04, p < .02.
Figure 3.

Three factor structural equation model.
The second step in the analysis was to add disfluencies, and recall that we tested each type of disfluency separately (see Figure 4). We began by ensuring that model fit was good with disfluencies included. We then set the pathway from intelligence to disfluency to zero, in order to determine if it significantly decreased model fit. We then set the pathway from inhibition to disfluency to zero, and again, looked at whether there was a decrease in model fit. Finally, we tested the pathway from set shifting to disfluency. The results of these analyses for each of the four types of disfluency are shown in Table 3. We observed one significant effect between inhibition and repair disfluencies, which suggests significant and unique variance between inhibition and repairs. The factor loading from inhibition to repairs was approximately −.33 when all pathways were unconstrained, which suggests that approximately one-third of the variance in repair disfluencies can be accounted for by individual differences in inhibitory control. Results also revealed a trend between intelligence and unfilled pauses, and here, the factor loading was −.22, which suggests that approximately one-quarter of the variance in filled pauses can be accounted for by individual differences in intelligence.
Figure 4.

Path model with factor loadings from all three latent variables loading onto disfluency.
Table 3.
Confirmatory factor analyses examining disfluency types against intelligence and executive function
| Model fit | CFI | NFI | RMSEA | Factor Loadings | Δχ2 difference | |||
|---|---|---|---|---|---|---|---|---|
| Unfilled pauses | ||||||||
| Saturated Model | χ2(22) = 20.58, p = .55 | 1.00 | .870 | .000 | IQ = −.220 | IN = −.076 | SS = .004 | |
| IQ set to 0 | χ2(23) = 23.37, p = .44 | .997 | .853 | .012 | IQ = .000 | IN = −.115 | SS = −.122 | Δχ2(1) = 2.79# |
| Inhibition set to 0 | χ2(23) = 20.77, p = .60 | 1.00 | .869 | .000 | IQ = −.226 | IN = .000 | SS = −.023 | Δχ2(1) = 0.19 |
| Shifting set to 0 | χ2(23) = 20.58, p = .61 | 1.00 | .870 | .000 | IQ = −.218 | IN = −.074 | SS = .000 | Δχ2(1) = 0.00 |
| Filled pauses | ||||||||
| Saturated Model | χ2(22) = 24.70, p = .31 | .978 | .845 | .034 | IQ = .095 | IN = .109 | SS = .015 | |
| IQ set to 0 | χ2(23) = 25.22, p = .34 | .982 | .842 | .030 | IQ = .000 | IN = .122 | SS = .070 | Δχ2(1) = 0.52 |
| Inhibition set to 0 | χ2(23) = 24.98, p = .35 | .984 | .844 | .029 | IQ = .103 | IN = .000 | SS = .055 | Δχ2(1) = 0.28 |
| Shifting set to 0 | χ2(23) = 24.71, p = .34 | .986 | .845 | .027 | IQ = .100 | IN = .117 | SS = .000 | Δχ2(1) = 0.01 |
| Repetitions | ||||||||
| Saturated Model | χ2(22) = 22.23, p = .45 | .998 | .859 | .010 | IQ = −.018 | IN = −.245 | SS = .048 | |
| IQ set to 0 | χ2(23) = 22.25, p = .51 | 1.00 | .859 | .000 | IQ = .000 | IN = −.245 | SS = .037 | Δχ2(1) = 0.02 |
| Inhibition set to 0 | χ2(23) = 23.87, p = .41 | .993 | .848 | .019 | IQ = −.026 | IN = .000 | SS = −.042 | Δχ2(1) = 1.64 |
| Shifting set to 0 | χ2(23) = 22.32, p = .50 | 1.00 | .858 | .000 | IQ = .001 | IN = −.226 | SS = .000 | Δχ2(1) = 0.00 |
| Repairs | ||||||||
| Saturated Model | χ2(22) = 24.24, p = .34 | .984 | .860 | .031 | IQ = −.176 | IN = −.329 | SS = −.112 | |
| IQ set to 0 | χ2(23) = 26.18, p = .29 | .977 | .849 | .036 | IQ = .000 | IN = −.353 | SS = −.207 | Δχ2(1) = 1.94 |
| Inhibition set to 0 | χ2(23) = 30.10, p = .15 | .948 | .826 | .054 | IQ = −.158 | IN = .000 | SS = −.254 | Δχ2(1) = 5.86* |
| Shifting set to 0 | χ2(23) = 24.75, p = .36 | .987 | .857 | .027 | IQ = −.215 | IN = −.387 | SS = .000 | Δχ2(1) = 0.49 |
Note.
p < .10,
p < .05,
p < .01
4.0 Discussion
The main finding of this study relates to repair disfluencies and the relationship with inhibition. Results showed that model fits were significantly worse when the pathway from inhibition was set to zero, and factor loadings suggested that approximately one-third of the variance in repairs can be accounted for by individual differences in inhibitory control. A relationship between disfluent speech and populations associated with inhibition deficits (i.e. older adults and ADHD) have been previously reported in the literature (Engelhardt, Ferreira, & Nigg, 2011; Kemper, 1992; Mortensen, Meyer, & Humphreys, 2006; Schmitter-Edgecombe, Vesneski, & Jones, 2000). The main contribution of the current study is that it shows the relationship also exists in typically-developing individuals. A couple of further points are warranted concerning this result. First, the bi-variate correlations indicated a significant relationship between two of the intelligence subtests and repair disfluencies (see Table 2). Interestingly, the two inhibition tasks and the two set shifting tasks split, there was one significant task for each (i.e. Stroop and perseveration errors). One possibility is that the significant correlations between intelligence and repairs is attributable to shared variance between intelligence and executive function. Our latent variable approach allowed us examine the relationship between disfluency production and individual differences, while at the same time accounting for (or permitting) inter-correlations between intelligence and the two executive functions.
In a recent review paper, Miyake and Friedman (2012) proposed a framework for interpreting the shared and unique variance associated with different executive functions (i.e. inhibition, updating, and set shifting). More specifically, they argued that after accounting for the shared variance in inhibition, there was no unique variance “left over”, which suggests that inhibitory control may represent common variance across most, if not all cognitive tasks. If so, then it is also likely that inhibition would also have some common/shared variance with intelligence, and thus, the Unity-Diversity framework may accommodate the somewhat mixed pattern of bivariate correlations that we observed.
As mentioned previously, repairs refer to cases in which a speaker suspends articulation and then restarts with a new word or phrase (e.g. the boy … the girl had ridden the bicycle). Thus, these disfluencies typically occur when the wrong lemma is selected, and we refer to these as lexical-type repairs. In the current study however, most repairs (~60%) were cases in which the participant began with one noun phrase and then switched, reversing grammatical roles (e.g. the girl … the bicycle was ridden by the girl.). These types of repairs are referred to as false starts, and the assumption is that there is a syntactic difficulty (e.g. problems inserting the auxiliary verb) that results in a change of structure (Shriberg, Bates, & Stolcke, 1997).
With respect to lexical-type repairs, there is a body of work investigating object naming, which is a sub-component of the sentence production task used in this study. It is generally assumed that when a picture is viewed, there is spreading activation across conceptual-semantic representations (Dell, 1986; Levelt et al., 1991). Following the spread of activation, the second process is to select one of the activated alternatives (Kempen, 1978; Wheeldon & Levelt, 1995). The selected lemma is then passed on for phonological encoding (i.e. accessing phonemes and assigning metrical and segmental features). With lexical-type repairs, it is easy to conceptualize that inhibition of activated but ultimately not selected lemmas would reduce the chances of articulating the wrong word. Computational models of word production typically include lateral inhibition as a basic mechanism in their processing architectures (Berg & Schade, 1992; Dell, 1986; Dell & O’Seghdha, 1992; Dell, Burger, & Svec, 1997). In a recent study, Shao, Roelofs, and Meyer (2012) reported data from a group of undergraduates, and they found that Stop task performance correlated with object naming speed. Thus, it is likely that inhibitory control plays a role in object naming, but research has not conclusively linked inhibition to particular levels or processes within the production system (e.g. conceptual processing, lemma retrieval, phonological encoding, monitoring, etc.).
The role of inhibition in syntactic processing is less well understood compared to word production (cf. Dell, Chang, & Griffin, 1999; Engelhardt, Corley, Nigg, & Ferreira, 2010; Vosse & Kempen, 2000). However, it stands to reason that if a task requires additional demands beyond single word production, then the role of cognitive control would be even larger as multiple words need to be arranged into a hierarchical structure with grammatical roles, tense markers, function words, etc. (Larson, Merritt, & Williams, 1988; Piai, Roelofs, & Schriefers, 2011). Thus, there is an additional layer of planning and integration in sentence production compared to producing single words.
There were several non-significant findings worth mentioning. First, unfilled pauses revealed a trend (p = .0948) when the pathway from intelligence was set to zero. Unfilled pauses were the most common type of disfluency produced, and results indicated that approximately one-quarter of the variance in unfilled pauses could be accounted for by intelligence. The highest correlation was with vocabulary, which is a measure of verbal intelligence. Second, filled pauses did not correlate with any of the variables in our dataset except for unfilled pauses and repairs. However, it is interesting to note that the factor loadings were all positive, whereas the other disfluency measures showed primarily negative factor loadings (see Table 3). Recall that some researchers (e.g. Brennan & Williams, 1995; Clark & Fox Tree, 2002; O’Connell & Kowal, 2005) have argued that filled pauses are collateral signals that speakers produce in order to convey certain information to listeners, and by such accounts, filled pauses should be more frequently produced by higher-functioning individuals. Our results are partially consistent with this view, as all of the factor loadings on filled pauses were positive. However, the factor loadings were quite low overall, and none were statistically significant.
4.1 Limitations
This study had several limitations. The first concerns the nature and size of the sample, which was small-to-moderate for an individual differences study. The NFI fit statistic is sensitive to sample size, and therefore, has a tendency to underestimate fit with small samples. This is the likely reason why NFI consistently showed fits between .85 and .90 (Hu & Bentler, 1999). A second aspect of the sample was that it consisted of a large age range and ability level. Some might argue that this is a strength rather than a limitation. However, it is potentially problematic for a couple of reasons. The adolescents and adults were administered different intelligence tests. In order to address this potential problem, we split the data file by age group and then saved the standardized values as variables. In addition, based on the correlations, we determined that it was best to use matrix reasoning (for adults) and block design (for adolescents) as the third variable for intelligence, as both measure perceptual organization, but again, ideally the measures and tests for the entire sample would be uniform.
The second limitation was that the data were collected for the purposes of a clinical investigation, and so the dataset was not a priori designed for the analyses we conducted. One consequence of this was that we did not have measures of working memory or attention (Oomen & Postma, 2001, 2002). These kinds of measures will be needed in order to gain a complete picture of the role individual difference variables in language production. The third limitation concerns inherent properties of disfluency. The production of disfluency (in typically-developing individuals) is a relatively rare occurrence. As mentioned previously, corpus analyses have indicated an overall mean rate of 6 – 10 disfluencies per 100 words. However, the disfluencies are then categorized into different subtypes (i.e. filled and unfilled pauses, repetitions, and repairs), which leads to potential issues regarding range restriction. The final limitation concerns our choice of task. This particular sentence production task was chosen because it offered control over the non-verbal messages that speakers were trying to convey. However, we must add the standard experimental caveat that laboratory production tasks are not the same as naturalistic conversation (e.g. no interlocutor, no alternating between production and comprehension, etc.). For these reasons, we think our task is less demanding than naturalistic conversation, but at this point, it remains an open issue whether executive function effects would be larger or smaller in more naturalistic production situations.
4.2 Conclusions
In evaluating the contribution of this work, we feel that it ties together a unique literature, bringing together in one place, important observations about the role of executive function in sentence production and overall rates of “normal” disfluency production. We also believe that the long-term impact of this work is what the findings will do to stimulate additional research into the role that executive control and intelligence have in theories and models of language production. This study demonstrates the feasibility of individual differences studies using controlled language production tasks, something which is surprisingly absent in existing literature. Including individual difference variables into models and theories of language production will make questions about intervening processes and mechanisms clearer, which should then lead to further investigations of how executive functions and/or intelligence mediate the relationship between particular task manipulations and language outputs. Based on our data, we conclude that inhibitory control influences speaker’s tendency to produce repair disfluencies.
Highlights.
We examined the role of intelligence and executive function on disfluency production
Structural equation modeling revealed that repairs are related to inhibitory control
Conclusions focus on individual differences in theories of language production
Acknowledgments
The authors would like to thank Laurie A. Carr and Elizabeth Davis for their help collecting the data. We would also like to thank D. Zachary Hambrick, Michelle M. Martel, Martin Corley, Michael J. Kane, and J. Kathryn Bock for helpful comments on earlier drafts of the manuscript and on the statistical analyses. This research was supported by the National Institute of Mental Health Grant R01-MH63146 awarded to Joel T. Nigg and Fernanda Ferreira.
Footnotes
Publisher's Disclaimer: This is a PDF file of an unedited manuscript that has been accepted for publication. As a service to our customers we are providing this early version of the manuscript. The manuscript will undergo copyediting, typesetting, and review of the resulting proof before it is published in its final citable form. Please note that during the production process errors may be discovered which could affect the content, and all legal disclaimers that apply to the journal pertain.
References
- Achenbach T. Manual for the Young Adult Self-Report and Young Adult Behavior Checklist. Burlington, VT: University of Vermont; 1991. [Google Scholar]
- Ackerman PL, Beier ME, Boyle MO. Working memory and intelligence: the same or different constructs? Psychological Bulletin. 2005;131:30–60. doi: 10.1037/0033-2909.131.1.30. [DOI] [PubMed] [Google Scholar]
- Anderson JC, Gerbing DW. Structural equation modeling in practice: A review and recommended two-step approach. Psychological Bulletin. 1988;103:411–423. [Google Scholar]
- Anderson SW, Damasio H, Jones RD, Tranel D. Wisconsin card sorting performance as a measure of frontal lobe damage. Journal of Clinical and Experimental Neuropsychology. 1991;13:909–922. doi: 10.1080/01688639108405107. [DOI] [PubMed] [Google Scholar]
- Arbuthnott K, Frank J. The Trail Making Test, Part B as a measure of executive control: validation using a set-shifting paradigm. Journal of Clinical Experimental Neuropsychology. 2000;22:518–528. doi: 10.1076/1380-3395(200008)22:4;1-0;FT518. [DOI] [PubMed] [Google Scholar]
- Ardila A, Pineda D, Rosselli M. Correlation between intelligence test scores and executive function measures. Archives of Clinical Neuropsychology. 2000;15:31–36. [PubMed] [Google Scholar]
- Arnold JE, Tanenhaus MK, Altmann RJ, Fagnano M. The old and thee, uh, new - Disfluency and reference resolution. Psychological Science. 2004;15:578–582. doi: 10.1111/j.0956-7976.2004.00723.x. [DOI] [PubMed] [Google Scholar]
- Barkley RA. Behavioral inhibition, sustained attention, and executive functions: Constructing a unifying theory of ADHD. Psychological Bulletin. 1997;1:65–94. doi: 10.1037/0033-2909.121.1.65. [DOI] [PubMed] [Google Scholar]
- Barkley RA, Murphy KR. Attention deficit hyperactivity disorder: A clinical workbook. 3. New York: Guilford Press; 2006. [Google Scholar]
- Barr DJ. Trouble in mind: Paralinguistic indices of effort and uncertainty in communication. In: Cavé C, Guaïtella I, Santi S, editors. Oralité et gestualité: Interactions et comportements multimodaux dans la communication. Paris: L’Harmattan; 2001. pp. 597–600. [Google Scholar]
- Berg T, Schade U. The role of inhibition in a spreading activation model of language production, Part 1: The psycholinguistic perspective. Journal of Psycholinguistic Research. 1992;22:405–434. [Google Scholar]
- Blackmer ER, Mitton JL. Theories of monitoring and timing of repairs in spontaneous speech. Cognition. 1991;39:173–194. doi: 10.1016/0010-0277(91)90052-6. [DOI] [PubMed] [Google Scholar]
- Bock K. Language production: Methods and methodologies. Psychonomic Bulletin & Review. 1996;3:395–421. doi: 10.3758/BF03214545. [DOI] [PubMed] [Google Scholar]
- Bock JK, Levelt WJM. Language production: Grammatical encoding. In: Gernsbacher MA, editor. Handbook of psycholinguistics. San Diego, CA: Academic Press; 1994. pp. 945–984. [Google Scholar]
- Bortfeld H, Leon SD, Bloom JE, Schober MF, Brennan SE. Disfluency rates in spontaneous speech: Effects of age, relationship, topic, role, and gender. Language and Speech. 2001;44:123–147. doi: 10.1177/00238309010440020101. [DOI] [PubMed] [Google Scholar]
- Brennan SE, Williams M. The feeling of another’s knowing: Prosody and filled pauses as cues to listeners about the metacognitive states of speakers. Journal of Memory and Language. 1995;34:383–398. [Google Scholar]
- Burgess PW. Theory and methodology in executive function research. In: Rabbitt P, editor. Methodology of frontal and executive function. Hove, UK: Psychology Press; 1997. pp. 81–116. [Google Scholar]
- Burgess PW, Alderman N, Evans J, Emslie H, Wilson BA. The ecological validity of tests of executive function. Journal of the International Neuropsychological Society. 1998;4:547–558. doi: 10.1017/s1355617798466037. [DOI] [PubMed] [Google Scholar]
- Casey BJ, Castellanos X, Giedd J, Marsh W, Hamburger S, Schubert A, et al. Involvement of right front ostriatal circuitry in response inhibition deficits of ADHD. Journal of the American Academy for Child and Adolescent Psychiatry. 1997;36:374–383. doi: 10.1097/00004583-199703000-00016. [DOI] [PubMed] [Google Scholar]
- Clark HH. Managing problems in speaking. Speech Communication. 1994;15:243–250. [Google Scholar]
- Clark HH, Fox Tree JE. Using uh and um in spontaneous speaking. Cognition. 2002;84:73–111. doi: 10.1016/s0010-0277(02)00017-3. [DOI] [PubMed] [Google Scholar]
- Clark HH, Wasow T. Repeating words in spontaneous speech. Cognitive Psychology. 1998;37:201–242. doi: 10.1006/cogp.1998.0693. [DOI] [PubMed] [Google Scholar]
- Conners CK, Erhardt D, Sparrow E. Adult ADHD Rating Scales: Technical manual. Toronto, Ontario, Canada: Multi-Health Systems; 1999. [Google Scholar]
- Dell GS. A spreading activation theory of retrieval in language production. Psychological Review. 1986;93:283–321. [PubMed] [Google Scholar]
- Dell GS, Burger LK, Svec WR. Language production and serial order: A functional analysis and a model. Psychological Review. 1997;104:123–147. doi: 10.1037/0033-295x.104.1.123. [DOI] [PubMed] [Google Scholar]
- Dell GS, Chang F, Griffin ZM. Connectionist models of language production: Lexical access and grammatical encoding. Cognitive Science. 1999;23:517–542. [Google Scholar]
- Dell GS, O’Seaghdha PG. Stages of lexical access in language production. Cognition. 1992;42:287–314. doi: 10.1016/0010-0277(92)90046-k. [DOI] [PubMed] [Google Scholar]
- Dempster FN, Corkill AJ. Individual differences in susceptibility to interference and general cognitive ability. Acta Psychologica. 1999;101:395–416. [Google Scholar]
- Denckla MB. A theory and model of executive function: A neuropsychological perspective. In: Lyon GR, Krasnegor NA, editors. Attention, memory, and executive function. Baltimore, MD: Brookes; 1996. pp. 263–278. [Google Scholar]
- Deese J. Pauses, prosody, and the demands of production in language. In: Dechert HW, Raupach M, editors. Temporal Variables in Speech. The Hague: Mouton; 1984. pp. 69–84. [Google Scholar]
- Duncan J, Johnson R, Swales M, Freer C. Frontal lobe deficits after head injury: Unity and diversity of function. Cognitive Neuropsychology. 1997;14:713–741. [Google Scholar]
- Engelhardt PE, Corley M, Nigg JT, Ferreria F. The role of inhibition on the production of disfluencies. Memory and Cognition. 2010;38(5):617–628. doi: 10.3758/MC.38.5.617. [DOI] [PMC free article] [PubMed] [Google Scholar]
- Engelhardt PE, Ferreira F, Nigg JT. Priming sentence production in adolescents and adults with attention-deficit/hyperactivity disorder. Journal of Abnormal Child Psychology. 2009;37:955–1006. doi: 10.1007/s10802-009-9323-3. [DOI] [PMC free article] [PubMed] [Google Scholar]
- Engelhardt PE, Ferreira F, Nigg JT. Language production strategies and disfluencies in multi-clause network descriptions: A study of adult attention-deficit hyper-activity disorder. Neuropsychology. 2011;25:442–453. doi: 10.1037/a0022436. [DOI] [PMC free article] [PubMed] [Google Scholar]
- Ferreira F, Engelhardt PE. Syntax and Production. In: Traxler M, Gernsbacher MA, editors. Handbook of psycholinguistics. Oxford, UK: Elsevier Inc; 2006. pp. 61–91. [Google Scholar]
- Fox Tree JE. The effects of false starts and repetitions on the processing of subsequent words in spontaneous speech. Journal of Memory and Language. 1995;34:709–738. [Google Scholar]
- Fox Tree JE, Clark HH. Pronouncing “the” as “thee” to signal problems in speaking. Cognition. 1997;62:151–167. doi: 10.1016/s0010-0277(96)00781-0. [DOI] [PubMed] [Google Scholar]
- Friedman NP, Haberstick BC, Willcutt EG, Miyake A, Young SE, Corley RP, Hewitt JK. Greater attention problems during childhood predict poorer executive functioning in late adolescents. Psychological Science. 2007;18:893–900. doi: 10.1111/j.1467-9280.2007.01997.x. [DOI] [PubMed] [Google Scholar]
- Friedman NP, Miyake A. The relations among inhibition and interference control processes: A latent variable analysis. Journal of Experimental Psychology: General. 2004;133:101–135. doi: 10.1037/0096-3445.133.1.101. [DOI] [PubMed] [Google Scholar]
- Friedman NP, Miyake A, Corley RP, Young SE, DeFries JC, Hewitt JK. Not all executive functions are related to intelligence. Psychological Science. 2006;17:172–179. doi: 10.1111/j.1467-9280.2006.01681.x. [DOI] [PubMed] [Google Scholar]
- Garrett MF. Production of speech; Observations from normal and pathological language use. In: Ellis A, editor. Normality and pathology in cognitive functions. London: Academic Press; 1982. pp. 19–76. [Google Scholar]
- Golden CJ. Stroop Color and Word Test: A Manual for Clinical and Experimental Issues. Wood Dale, IL: Stoelting; 1978. [Google Scholar]
- Gonzalez R, Griffin D. Testing parameters in structural equation modeling: Every “one” matters. Psychological Methods. 2001;6:258–269. doi: 10.1037/1082-989x.6.3.258. [DOI] [PubMed] [Google Scholar]
- Hartsuiker RJ, Kolk HHJ. Error monitoring in speech production: a computational test of the perceptual loop theory. Cognitive Psychology. 2001;42:113–157. doi: 10.1006/cogp.2000.0744. [DOI] [PubMed] [Google Scholar]
- Hu L, Bentler PM. Evaluating model fit. In: Hoyle RH, editor. Structural equation modeling: Concepts, issues, and applications. Thousand Oaks, CA: Sage; 1995. pp. 76–99. [Google Scholar]
- Hu L, Bentler PM. Fit indices in covariance structure modeling: Sensitivity to under-parameterized model misspecification. Psychological Methods. 1998;3:424–453. [Google Scholar]
- Hu L, Bentler PM. Cuttoff criteria for fit indexes in covariance structure analysis: Conventional criteria versus new alternatives. Structural Equation Modeling: A Multidisciplinary Journal. 1999;6:1–55. [Google Scholar]
- Jester JJ, Nigg JT, Puttler LI, Long J, Fitzgerald HE, Zucker RA. Intergenerational transmission of neuropsychological executive functioning. Brain and Cognition. 2009;70:145–153. doi: 10.1016/j.bandc.2009.01.005. [DOI] [PMC free article] [PubMed] [Google Scholar]
- Kane MJ, Hambrick DZ, Wilhelm O, Payne T, Tuholski S, Engle RW. The generality of working memory capacity: A latent variable approach to verbal and visuo-spatial memory span and reasoning. Journal of Experimental Psychology: General. 2004;133:189–217. doi: 10.1037/0096-3445.133.2.189. [DOI] [PubMed] [Google Scholar]
- Kempen G. Sentence construction by a psychologically plausible formulator. In: Campbell R, Smith P, editors. Recent advances in the psychology of language: Formal and experimental approaches. New York: Plenum Press; 1978. [Google Scholar]
- Kemper S. Adults’ sentence fragments Who, What, When, Where, and Why. Communication Research. 1992;19:444–458. [Google Scholar]
- Kline P. Intelligence: the psychometric view. London: Routledge; 1991. [Google Scholar]
- Kline RB. Principles and practice of structural equation modeling. New York: Guilford; 1998. [Google Scholar]
- Larson GE, Merritt CR, Williams SE. Information processing and intelligence: Some implications of task complexity. Intelligence. 1988;12:131–147. [Google Scholar]
- Levelt WJM. Monitoring and self-repair in speech. Cognition. 1983;14:41–104. doi: 10.1016/0010-0277(83)90026-4. [DOI] [PubMed] [Google Scholar]
- Levelt WJM. Speaking: From intention to articulation. Cambridge, MA: MIT; 1989. [Google Scholar]
- Levelt WJM. Producing spoken language: A blueprint for the speaker. In: Brown CM, Hagoort P, editors. The neurocognition of language. Oxford: Oxford University Press; 1999. pp. 83–122. [Google Scholar]
- Levelt WJM, Schriefers H, Vorberg D, Meyer AS, Pechmann T, Havinga J. The time course of lexical access in speech production: A study of picture naming. Psychological Review. 1991;98:122–142. [Google Scholar]
- Logan GD. Executive control of thought and action. Acta Psychologica. 1985;60:193–210. [Google Scholar]
- Logan GD. On the ability to inhibit thought and action: A user’s guide to the stop signal paradigm. In: Dagenbach D, Carr TH, editors. Inhibitory processes in attention, memory, and language. San Diego, CA: Academic Press; 1994. pp. 189–239. [Google Scholar]
- Maclay H, Osgood CE. Hesitation phenomenon in spontaneous English speech. Word. 1959;15:19–44. [Google Scholar]
- Marslen-Wilson W, Welsh A. Processing interactions and lexical access during word-recognition in continuous speech. Cognitive Psychology. 1978;10:29–63. [Google Scholar]
- Martin NG. Genetic covariance among measures of information processing speed, working memory, and IQ. Behavior Genetics. 2001;31:581–592. doi: 10.1023/a:1013397428612. [DOI] [PubMed] [Google Scholar]
- Martel M, Nikolas M, Nigg JT. Executive function in adolescents with ADHD. Journal of the American Academy of Child and Adolescent Psychiatry. 2007;46:1437–1444. doi: 10.1097/chi.0b013e31814cf953. [DOI] [PubMed] [Google Scholar]
- Mayr U, Kliegl R. Task-set switching and long-term memory retrieval. Journal of Experimental Psychology: Learning, Memory, and Cognition. 2000;26:1124–1140. doi: 10.1037//0278-7393.26.5.1124. [DOI] [PubMed] [Google Scholar]
- McCartney K, Burchinal MR, Bub KL. Best practices in quantitative methods for developmentalists. Monographs of the Society for Research in Child Development. 2006;71:1–145. doi: 10.1111/j.1540-5834.2006.07103001.x. [DOI] [PubMed] [Google Scholar]
- Miyake A, Friedman NP. The nature and organization of individual differences in executive functions: Four general conclusions. Current Directions in Psychological Science. 2012;21:8–14. doi: 10.1177/0963721411429458. [DOI] [PMC free article] [PubMed] [Google Scholar]
- Miyake A, Friedman NP, Emerson MJ, Witzki AH, Howerter A, Wager TD. The unity and diversity of executive functions and their contributions to complex “frontal lobe” tasks: A latent variable analysis. Cognitive Psychology. 2000;41:49–100. doi: 10.1006/cogp.1999.0734. [DOI] [PubMed] [Google Scholar]
- Miyake A, Friedman NP, Rettinger DA, Shah P, Hegarty M. How are visuospatial working memory, executive functioning, and spatial abilities related? A latent variable analysis. Journal of Experimental Psychology: General. 2001;130:621–640. doi: 10.1037//0096-3445.130.4.621. [DOI] [PubMed] [Google Scholar]
- Mortensen L, Meyer AS, Humphreys GW. Age-related changes in object naming: A review. Language and Cognitive Processes. 2006;21:238–290. [Google Scholar]
- Nigg JT. Is ADHD a disinhibtion disorder? Psychological Bulletin. 2001;127:571–598. doi: 10.1037/0033-2909.127.5.571. [DOI] [PubMed] [Google Scholar]
- Nigg JT, Blaskey LG, Huang-Pollock CL, Rappley MD. Neuropsychological executive functions and DSM-IV ADHD subtypes. Journal of the American Academy of Child and Adolescent Psychiatry. 2002;41:59–66. doi: 10.1097/00004583-200201000-00012. [DOI] [PubMed] [Google Scholar]
- Nigg JT, Carr LA, Martel MM, Henderson JM. Concepts of inhibition and developmental psychopathology. In: MacCleod C, Gorfein D, editors. Inhibition in Cognition. American Psychological Association Press; 2007. pp. 259–277. [Google Scholar]
- Nooteboom SG. Speaking and unspeaking: detection and correction of phonological and lexical errors in spontaneous speech. In: Fromkin VA, editor. Errors in linguistic performance: slips of the tongue, ear, pen, and hand. New York: Academic Press; 1980. [Google Scholar]
- O’Connell DC, Kowal S. Uh and UmRevisited: Are They Interjections for Signaling Delay? Journal of Psycholinguistic Research. 2005;31:555–576. doi: 10.1007/s10936-005-9164-3. [DOI] [PubMed] [Google Scholar]
- Oomen CCE, Postma A. Effects of time pressure on mechanisms of speech production and self-monitoring. Journal of Psycholinguistic Research. 2001;30:163–184. doi: 10.1023/a:1010377828778. [DOI] [PubMed] [Google Scholar]
- Oomen CCE, Postma A. Limitations in processing resources and speech monitoring. Language and Cognitive Processes. 2002;17:163–184. [Google Scholar]
- Pennington BF, Ozonoff S. Executive functions and developmental psychopathology. Journal of Child Psychology and Psychiatry. 1996;37:51–87. doi: 10.1111/j.1469-7610.1996.tb01380.x. [DOI] [PubMed] [Google Scholar]
- Piai V, Roelofs A, Schriefers H. Semantic interference in immediate and delayed naming and reading: Attention and task decisions. Journal of Memory and Language. 2001;64:404–423. [Google Scholar]
- Postma A. On the mechanisms of speech monitoring. In: Hulstijn W, Peters H, Van Lieshout P, editors. Speech production: motor control, brain research, and fluency disorders. Amsterdam: Elsevier; 1997. [Google Scholar]
- Postma A. Detection of errors during speech production: A review of speech monitoring models. Cognition. 2000;77:97–131. doi: 10.1016/s0010-0277(00)00090-1. [DOI] [PubMed] [Google Scholar]
- Postma A, Kolk H, Povel DJ. On the relation among speech errors, disfluencies, and self-repairs. Language and Speech. 1990;33:19–29. doi: 10.1177/002383099003300102. [DOI] [PubMed] [Google Scholar]
- Puig-Antich J, Ryan N. The Schedule for Affective Disorders and Schizophrenia for School-Age Children (Kiddie-SADS) 1986. Pittsburg, PA: Western Psychiatric Institute and Clinic; 1986. [Google Scholar]
- Rabbitt P, editor. Methodology of frontal and executive function. Hove, UK: Psychology Press; 1997. [Google Scholar]
- Reitan RM. Validity of the Trail Making Test as an indicator of organic brain damage. Perceptual and Motor Skills. 1958;8:271–276. [Google Scholar]
- Rogers RD, Monsell S. Costs of a predictable switch between simple cognitive tasks. Journal of Experimental Psychology: General. 1995;124:207–231. [Google Scholar]
- Satorra A, Bentler PM. A scaled difference chi-square test statistic for moment structure analysis. Psychometrika. 2001;66:507–514. doi: 10.1007/s11336-009-9135-y. [DOI] [PMC free article] [PubMed] [Google Scholar]
- Sattler JM. Assessment of children. Cognitive applications. 4. San Diego, CA: Author; 2001. [Google Scholar]
- Schachar R, Tannock R, Marriott M, Logan GD. Deficient inhibitory control and attention deficit hyperactivity disorder. Journal of Abnormal Child Psychology. 1995;23:411–437. doi: 10.1007/BF01447206. [DOI] [PubMed] [Google Scholar]
- Schachter S, Christenfeld N, Ravina B, Bilous F. Speech disfluency and the structure of knowledge. Journal of Personality and Social Psychology. 1991;60:362–367. [Google Scholar]
- Schmitter-Edgecombe M, Vesneski M, Jones DWR. Aging and word-finding: A comparison of spontaneous and constrained naming tests. Archives of Clinical Neuropsychology. 2000;15:479–493. [PubMed] [Google Scholar]
- Shafer JL, Graham JW. Missing data: Our view of the state of the art. Psychological Methods. 2002;7:147–177. [PubMed] [Google Scholar]
- Shao Z, Roelofs A, Meyer AS. Sources of individual differences in the speed of naming objects and actions: The contribution of executive control. Quarterly Journal of Experimental Psychology. 2012 doi: 10.1080/17470218.2012.670252. [DOI] [PubMed] [Google Scholar]
- Shriberg E. Disfluencies in Switchboard. Proceedings, International Conference on Spoken Language Processing (ICSLP), Vol. Addendum; Philadelphia, PA. 3–6 October.1996. pp. 11–14. [Google Scholar]
- Shriberg E. The ‘errr’ is human: ecology and acoustics of speech disfluencies. Journal of the International Phonetic Assocaition. 2001;31:153–169. [Google Scholar]
- Shriberg E, Bates R, Stolcke A. A prosody-only decision-tree model for disfluency detection. Proceedings of EUROSPEECH; Rhodes, Greece. 1997. pp. 2383–2386. [Google Scholar]
- Spearman C. The abilities of man. London: Macmillan; 1927. [Google Scholar]
- Spector A, Biederman I. Mental set and mental shift revisited. American Journal of Psychology. 1976;89:669–679. [Google Scholar]
- Stevens JP. Applied multivariate statistics for the social sciences. Hillsdale, N.J: Earlbaum; 2002. [Google Scholar]
- Stroop JR. Studies of interference in serial verbal reactions. Journal of Experimental Psychology. 1935;18:643–662. [Google Scholar]
- Studebaker GA. A “rationalized” arcsine transform. Journal of Speech and Hearing Research. 1985;28:455–462. doi: 10.1044/jshr.2803.455. [DOI] [PubMed] [Google Scholar]
- Stuss DT, Benson DF. The frontal lobes. New York: Raven Press; 1986. [Google Scholar]
- Tannock R, Schachar R. Executive dysfunction as an underlying mechanism of behavior and language problems in attention deficit hyperactivity disorder. In: Beitchman J, Cohen N, Konstantearas MM, Tannock R, editors. Language, learning, and behavior disorders. Cambridge: University Press; 1996. pp. 128–155. [Google Scholar]
- Teuber HL. Unity and diversity of frontal lobe functions. Acta Neurobiologiae Experimentalis. 1972;32:615–656. [PubMed] [Google Scholar]
- Vosse T, Kempen G. Syntactic structure assembly in human parsing: a computational model based on competitive inhibition and lexicalist grammar. Cognition. 2000;75:105–143. doi: 10.1016/s0010-0277(00)00063-9. [DOI] [PubMed] [Google Scholar]
- Wechsler D. Wechsler Adult Intelligence Scale. 3. San Antonio, TX: The Psychological Corporation; 1997a. [Google Scholar]
- Wechsler D. Wechsler Intelligence Scale for Children. 4. San Antonio: The Psychological Corporation; 1997b. [Google Scholar]
- Wheeldon LR, Levelt WJM. Monitoring the time course of phonological encoding. Journal of Memory and Language. 1995;34:311–334. [Google Scholar]
- Wilcox RR. Understanding the practical advantages of modern ANOVA. Journal of Clinical Child and Adolescent Psychology. 2002;31:399–412. doi: 10.1207/S15374424JCCP3103_12. [DOI] [PubMed] [Google Scholar]
- Wilcox RR, Keselman HJ, Kowalchuk RK. Can tests for treatment group equality be improved? The bootstrap and trimmed means conjecture. British Journal of Mathematical and Statistical Psychology. 1998;51:123–134. [Google Scholar]