Abstract
Background and purpose
The ability to track changes in gene expression following viral infection is paramount to understanding viral pathogenesis. This study was undertaken to evaluate the nCounter, a high throughput digital gene expression system, as a means to better understand West Nile virus (WNV) dissemination and the inflammatory response against WNV in the outbred Swiss Webster (SW) mouse model over the course of infection.
Methodology
The nCounter Mouse Inflammation gene expression kit containing 179 inflammation related genes was used to analyze gene expression changes in multiple tissues over a nine day course of infection in SW mice following intraperitoneal injection with WNV. Protein expression levels for a subset of these cytokine/chemokine genes were determined using a multiplex protein detection system (BioPlex) and comparisons of protein/RNA expression levels made.
Results
Expression analysis of spleen, lung, liver, kidney and brain of SW mice infected with WNV revealed that Cxcl10 and Il12b are differentially expressed in all tissues tested except kidney. Data stratification of positively confirmed infected (WNV (+)) versus non-infected (WNV (−) tissues allowed differentiation of the systemic inflammatory gene response from tissue-specific responses arising from WNV infection. Significant (p<0.05) decrease in C3ar1 was found in WNV (−) spleen. Il23a was significantly upregulated, while Il10rb was down-regulated in WNV (−) lung. Il3 and Mbl2 were down-regulated in WNV (−) liver. In WNV (+) livers, Stat1, Tlr2, chemokines Cxcl1, Cxcl3, Cxcl9, Cxcl10, cytokines Il6, Il18, cytokine-related gene Il1r and cytokine agonist Ilrn were significantly upregulated. In WNV (−) brain tissues, Csf2 and Cxcl10 were significantly upregulated. Similar gene and protein expression kinetics were found for Ccl2, Ccl3, Ccl4 and Ccl5 and correlated with the presence of infectious virus. In summary, the utility of the nCounter platform for rapid identification of gene expression changes in SW mice associated with WNV infection was demonstrated.
Author Summary
The nCounter, a high throughput digital molecular detection and quantitation system, was used to define the inflammatory response of SW mice to WNV infection following intraperitoneal injection in multiple tissues over a 9 day course of viral infection. Data analysis identified expression profiles common and unique to major tissues. Complementary protein suspension array analysis of a subset of genes demonstrated the expression kinetics of RNA and protein expression compared to infectious virus production. Data stratification of WNV (+) versus WNV (−) tissues allowed differentiation of the systemic inflammatory gene response versus tissue-specific responses due to infection with WNV over time. The results generated from this study will allow for further hypothesis generation and testing.
Introduction
West Nile virus (WNV) is a neurotropic flavivirus endemic to parts of the Americas, Africa, Europe, the Middle East and Asia. WNV naturally cycles between mosquitoes and birds but also infects humans and other animals [1]. Humans infected with WNV develop a febrile illness that is self-resolving but a subset of cases, 20–25% will develop a febrile illness and 1 out of 150–250 WNV infections will progress to develop meningitis or encephalitis [2]–[4]. There are currently no approved antiviral therapies or vaccines for human use. Since its introduction to North America in 1999, WNV has become the leading cause of mosquito-borne epidemic encephalitis in the United States (US) and now poses a significant public health risk. From 1999 to 2012 the number of WNV infections has totaled 37,088 cases of which 16,114 cases were reported to be neuroinvasive and 1,549 were fatal (http://www.cdc.gov/ncidod/dvbid/westnile/index.htm). Since its introduction, the US has experienced annual epidemics of WNV disease that peaked in 2002–2003. Subsequently, the numbers of WNV cases remained relatively constant until a steady decline was observed beginning in 2008. However, 2012 saw a dramatic resurgence in the number of WNV cases reported [5] reinforcing the ongoing risk that WNV poses to human and animal health in North America and the unpredictable nature of outbreaks. Over the past few years, relatively large outbreaks of neuroinvasive disease in humans and horses involving multiple lineages of WNV have also been reported from several European countries [6]–[8]. Rapid screening technologies, coupled with a better understanding of the host response to viral infections would be of great value in responding to future outbreaks of such diseases.
Over the past decade, inbred mouse strains (i.e. C57BL/6, 129 Sv/Ev, BALB/C and C3H) of varying ages have been used extensively as model systems to study host responses and determinants of WNV neuroinvasive disease [9]–[11]. Using various inbred and knockout mouse strains, several laboratories have shown varying degrees of susceptibility to WNV infection, in addition to identifying aspects of innate and adaptive immune responses that offer protection against WNV infection [12]–[18]. Alternatively, ICR (CD-1) outbred mice have been used to demonstrate loss of neuroinvasiveness for some attenuated WNV strains. NIH Swiss or Swiss Webster outbred mice have been utilized to demonstrate differences in neuroinvasiveness and neurovirulence between naturally occurring and engineered WNV strains [19], to study molecular determinants of neuroinvasiveness in related lineage 1 WNV strains [20], and for evaluation of candidate vaccines and therapeutics [21]–[23].
In recent studies, microarray analysis has been used to detect changes in gene expression after viral infection to help better understand the immune mechanisms governing viral pathogenesis. Gene expression profiling of human embryonic kidney cells, human glioma cells and human retinal pigmented cells, as well as various mouse cell lines, infected with WNV in vitro have been reported [24]–[29]. With the development of multiple WNV mouse models, gene expression analysis has been applied to whole tissues of WNV-infected mice. The first microarray analysis of WNV mouse model used NIH Swiss mice and gene expression analysis focused primarily on brain, spleen and liver tissue [30]. A more recent study used Mavs−/−, Ifnar−/− or Mavs−/−Ifnar−/− double-knockout mice to demonstrate complex innate immune signaling regulated tissue tropism between the spleen and liver of WNV infected mice [31].
To better understand the dynamic changes in gene expression profiles across multiple peripheral tissues, high-throughput digital gene expression analysis was utilized to investigate the inflammatory response throughout the course of infection in the WNV Swiss Webster (SW) weanling mouse model. The nCounter molecular detection and quantitation system was used to examine how infection with highly neuroinvasive WNV strain 382–99 (often termed “NY99”) altered the kinetics of the inflammatory response through the course of infection in a common outbred mouse model of neuroinvasive WNV disease. The nCounter identifies and quantitates RNA transcripts free of enzymatic amplification, with high levels of sensitivity, linearity, and multiplexing, and can simultaneously analyze up to 850 individual transcripts at concentrations as low as 0.5fMs [32]. In this study, the utility of the nCounter system enabling rapid gene expression analysis for in vivo studies of WNV infection in mice was demonstrated. Genes common to multiple tissues that are differentially expressed when WNV RNA is detected and genes that are differentially expressed in a tissue-specific manner following active WNV infection across multiple tissues over the entire course of infection are reported.
Materials and Methods
Ethics Statement
All animal procedures complied with USDA guidelines and were conducted at the AAALAC-accredited Galveston National Laboratory ABSL-3 Laboratory at The University of Texas Medical Branch (UTMB; Galveston, TX) under protocol number 0508048A approved by the UTMB Institutional Animal Care and Use Committee.
Cells and Viruses
West Nile virus (WNV) strain 382–99 was obtained from the World Reference Center for Emerging Viruses and Arboviruses (WRCEVA) at the University of Texas Medical Branch (UTMB). The virus was passaged once each in chicken embryo fibroblast cells (CE) and rhesus monkey kidney cells (LLC-MK2) prior to receipt at WRCEVA, and then twice in African green monkey kidney cells (Vero) to generate the stock used for this study. Vero E6 cells (ATCC, CRL1586) were maintained in MEM, supplemented with 10% heat-inactivated fetal bovine serum, 1,000 IU/ml penicillin, and 1,000 µg/ml streptomycin at 37°C/5% CO2.
Viral Titers
WNV titers in culture supernatants, serum and homogenized tissue samples from animal experiments were determined by standard plaque assay on Vero cells. Briefly, samples were serially diluted in PBS in the range 1∶101 to 1∶106. One hundred microliters (100 µl) of sample was added to each well of a 12-well plate with a confluent monolayer of Vero cells. The plates were incubated for 30 minutes at room temperature, then 2 ml of overlay was added to each well (final concentration = 1% agar with 1× MEM, 2% Bovine Growth Serum, 0.6 mM L-glutamine, 1,000 IU/ml penicillin, 1,000 µg/ml streptomycin, and 1× MEM non-essential amino acids). Plates were incubated in a 37°C/5% CO2 incubator. At 2 days post-infection, 1 ml of overlay supplemented with 2% neutral red (Sigma) was added. Plaques were enumerated using a light box at day 3 post-infection.
Mouse Experiments
A nine-day serial-sacrifice experiment was performed using thirty 3 to 4-week-old female Swiss Webster mice (Charles River Laboratories) injected intraperitoneally (i.p.) with 1,000 plaque-forming units (PFU) of WNV in a volume of 100 µl of PBS. Three mice were euthanized per day during days 1 to 9 post infection (p.i.). Three PBS mock infected control mice were sacrificed on day 1 p.i. Serum, brain, lung, liver, kidney, and spleen tissue were collected from each mouse. Each tissue sample was divided into two equivalent sized pieces. One piece was placed in 1 ml TRIzol (Life Technologies, Carlsbad CA) for RNA extraction. The other piece was placed in 500 µl PBS and homogenized for viral titer determination. Animal studies were performed at UTMB under ABSL3 conditions in accordance with a protocol approved by UTMB's Institutional Animal Care and Use Committee.
Chemokine Analysis
Tissue homogenates were gamma-irradiated (5 megarads) prior to analysis at BSL2. Samples were processed according to manufacturer instructions and then analyzed using a Bio-Plex 200 system (Bio-Rad, Hercules, CA). Briefly, the tissue homogenates were centrifuged for 10 minutes at 1,000 rpm at 4°C to remove cellular debris. The cleared supernatants were aliquoted into 96-well plates in pre-determined wells; this plate was centrifuged at 1,250 rpm to remove any remaining debris. The supernatant was transferred to a 96-well flat bottom plate and processed for use on the Bio-Plex system. The cytokines were coupled to cytokine-specific multiplex beads (Bio-Rad) following the manufacturer's instructions using the pre-designed assays Bio-Plex Pro mouse cytokine 23-plex immunoassay. This panel measures the concentrations of cytokines and chemokines and includes interleukin (IL)-1α/β, IL-2, IL-3, IL-4, IL-5, IL-6, IL-9, IL-10, IL-12 (p40, p70), IL-13, IL-17, eotaxin (CCL11), IFN-γ, KC (CXCL1), monocyte chemoattractant protein (MCP)-1/(CCL2), granulocyte colony-stimulating factor (G-CSF/CSF3), granulocyte macrophage colony-stimulating factor (GM-CSF/CSF2), macrophage inflammatory protein (MIP)1α/β (CCL3/CCL4), tumor necrosis factor (TNF)-α and RANTES (CCL5).
Nucleic Acid Extractions
All sample RNAs were extracted from TRIzol (Life Technologies) treated brain, lung, kidney, liver and spleen tissue homogenates according to the manufacturer's instructions. One-fifth of the total volume of chloroform was added, mixed, incubated 15 min at 25°C and centrifuged at 5,000 rpm 15 min at 4°C. To the aqueous layer, a 70% volume of 100% isopropyl alcohol was added. Samples were mixed, incubated 10 min at 25°C then centrifuged at 13,000 rpm for 10 min at 4°C. The pellet was washed with 70% ethanol then centrifuged at 13,000 rpm for 10 min at 4°C, air dried briefly at room temperature (RT) and resuspended in RNase-free, DEPC treated water (Ambion, Austin, TX) and stored at −80°C until needed.
qRT-PCR
All reactions were performed on 96 well FAST PCR plates (Applied Biosystems, Foster City, CA) in a total volume of 25 µl (20 µl master mix plus 5 µl sample) optimized for quantitative reverse transcriptase polymerase chain reaction (qRT-PCR). A volume of 20 µl qRT-PCR master mix was prepared per manufacturer instructions (AgPath-ID One-Step RT-PCR Kit, Life Technologies, Foster City, CA). Tissue homogenates were analyzed using 1 ng total RNA and reactions performed in triplicate. Each plate contained 3 negative (no template controls) and 3 positive controls containing 1,000 copies of Alien-armored RNA (Asuragen, Austin, TX). Alien armored RNA was prepared per manufacturer instructions and diluted to 200 copies/µl in water. Reactions were performed on ABI 7500 thermal cyclers (Life Technologies) under the following Real-Time Fast thermal cycling conditions: 45°C for 10 minutes for reverse transcription of cDNA synthesis, 95°C for 10 minutes for inactivation of the reverse transcriptase, activation of 25X RT-PCR Enzyme Mix, and denaturation of the RNA/cDNA hybrid; followed by amplification at 40 cycles of 97°C for 2 seconds and 60°C for 30 seconds. Oligonucleotide primers and probes were purchased from Biosearch Technologies, Inc. (Novato, CA). Primer and probe sequences were as follows; WNV 19-F 5′AGGTCCTTCGCAAGAGGT 3′, WNV 19-R 5′GYGCCAAGTGYACVACGT 3′, WNV 19-Probe 5′ FAM-GCCAAGATCAGCDTKCCAGCBA-BHQ1 3′. Upon receipt, oligos were reconstituted in sterile 1× Tris-EDTA Buffer (10 mM Tris-Cl, 1 mM EDTA, pH 8.0, Teknova, Hollister, CA) to a concentration of 100 mM. Working stocks were made by diluting primers and probes to a concentration of 10 mM with TE Buffer.
A standard curve of Cq vs. amount of infectious virus RNA added to each reaction was generated and used to determine the PFU equivalent viral RNA amounts reported using standard plaque assays on Vero cells and total RNA extracts from viral culture supernatants.
nCounter Gene Expression Profiling
The nCounter Mouse Inflammation gene expression Kit was purchased from NanoString Technologies (Seattle, WA) and consists of 179 inflammation-related mouse genes (see Table S1) and 6 internal reference genes (http://www.nanostring.com/products/gene_expression_panels). The nCounter assay was performed using 100 ng of total RNA. Hybridization reactions were performed according to the manufacturer's instructions with 5 µl diluted sample preparation reaction and incubated at 65°C for a minimum of 18 h. Hybridized reactions were purified using the nCounter Prep Station (NanoString Technologies) and data collection was performed on the nCounter Digital Analyzer (NanoString Technologies) following the manufacturer's instructions. For each assay data collection was performed at maximum density (1155 fields of view). RNA concentrations were determined using a Qubit (1.0) Fluorometer (Life Technologies, Grand Island, NY).
The raw data were normalized to six genes within each tissue type with the lowest coefficient of variation using the nSolver software following manufacturer's instructions (NanoString Technologies). The normalized results are expressed as total mRNA counts.
Statistical Analysis
Gene expression analysis was performed in Excel using a heteroscedastic Student's t-test and changes in gene expression profiles were consider significant if p<0.05; uncorrected for multiple T-test. For graphing purposes Prism version 6.0a (GraphPad Software, La Jolla, CA) was used. Correlation coefficient was measured using Pearson's r. To adjust for values equal 0 for PFU and genome equivalents, log (x+c) was used to normalize all PFU and genome values prior to statistical analysis; c = lowest measured value/2.
Gene Association Analysis
The analysis used the raw Nanostring mouse gene expression data, captured as mRNA counts harvested from brain, liver, lung, spleen and kidney tissue. Each of the organ-specific datasets consisted of 179 distinct gene rows and 30 columns. The number of columns corresponded to 3 mice sacrificed each day for 9 days post-infection with WNV. An additional three columns corresponded to a single set of three “mock” values, harvested from un-infected mice to serve as a reference. The columns were further annotated by a ‘1’ if viral RNA was detected in the harvested tissue and ‘0’ if viral RNA was not detected. For each organ dataset, the data between ‘0’ and ‘1’ states was binned separately. Separate time series for ‘0’ and ‘1’ were generated by averaging over the ‘0’ and ‘1’ mice separately each day. Changes in gene expression between ‘0’ and ‘1’ states were then quantified. The expression level of a specific gene y was deemed to be up-regulated if the sign of median (y(1))-median(y(0)) was positive and down-regulated if the sign was negative. The magnitude of the change was quantified by calculating the Kullbeck-Leibler divergence [33] between the gene expression distributions in ‘0’ and ‘1’ states. Finally, a weighted gene expression correlation network was constructed by calculating the Pearson correlation coefficient between each pair of genes. The sign of the Pearson coefficient determined whether the time series were correlated (+) or anti-correlated(−).
KEGG Pathway Enrichment and Protein-Protein Interaction Network Analysis
The Database for Annotation, Visualization and Integrated Discovery (DAVID) [34], [35] was used to perform KEGG functional enrichment of biological pathways significantly enriched with DEGs from individual tissues. A minimum count of 4 genes was used as the cut-off for determination of enriched biological pathways. The Benjamini-Hochberg correction was used to calculate the FDR of the p values; FDR<0.05.
Protein-protein interaction (PPI) networks were constructed using Search Tool for the Retrieval of Interacting Genes/Proteins (STRING) [36]. DEG list from individual tissues were used to construct PPI networks. PPI confidence networks were generated using the confidence view option at a medium confidence of 0.400. KEGG pathway annotation was visualized by using the KEGG enrichment function in STRING.
Results
WNV Infection in the Swiss Webster Mouse Model
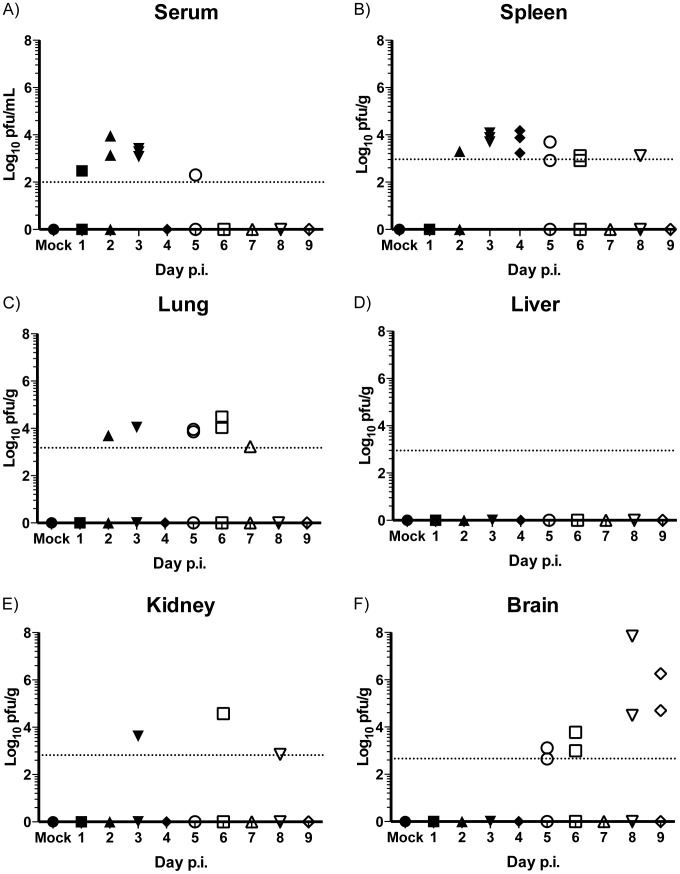
Outbred Swiss mice are highly susceptible to peripheral challenge with neuroinvasive strains of WNV [19], [23]. Despite these studies the WNV Swiss mouse model remains poorly characterized compared to inbred mouse models used to study WNV pathogenesis [12], [13]. To better characterize the WNV Swiss outbred mouse model, 3 to 4 week old Swiss Webster (SW) female mice were infected with the prototypical North American WNV NY99 (strain 382–99) via intraperitoneal (i.p.) injection. Three mice were randomly chosen and sacrificed daily during days 1 to 9 post infection (p.i.) and serum, spleen, lung, liver, kidney and brain were collected for determination of infectious WNV loads using a standard plaque assay and qRT-PCR protocol. Mice first displayed clinical signs of disease (hunching, ruffled fur, and tremors) on day 6 p.i. and one mouse was paralyzed on day 9 p.i. Consistent with previous studies in outbred and inbred mouse strains [12], [14], peak viremia (∼103.5 PFU/mL) was detected 48–72 hours (h) p.i. and dropped below the plaque assay limit of detection (LOD) by day 6 p.i. (Figure 1A).
Figure 1. WNV viral titers in peripheral tissue of Swiss Webster outbred mice.
Kinetics and levels of infectious WNV in (A) serum, (B) spleen, (C) lung, (D) liver, (E) kidney and (F) brain of infected SW mice determined by plaque assay. Data are presented as Log10 PFU per mL (serum) or per gram of tissue homogenate; n = 3 mice per time point. Dotted lines represent the limit of detection (LOD) of the assay, n = 3 mice per time point.
Dissemination of WNV to peripheral organs was detected by plaque assay as early as day 2 p.i. in the spleen and lungs (Figure 1B and 1C, respectively). In the spleen, the amount of infectious virus peaked at day 4 p.i. (∼104 PFU/g) and was detectable up to day 8 p.i. Levels of infectious virus in the lung remained constant beginning on day 2 through day 7 p.i. (∼104 PFU/g). No infectious virus was detected in the liver throughout the entire time course (Figure 1D). Infectious WNV was detected at day 3 p.i. in the kidney and was detectable up to day 8 p.i. (∼103.5 PFU/g) (Figure 1E). Low levels of infectious virus (103 PFU/g) were detected in the brain beginning at day 5 p.i. and with a marked increased at days 8 and 9 (>106 PFU/g) (Figure 1 F). Increased viral titers correlated well with the onset of tremors at day 6 p.i.
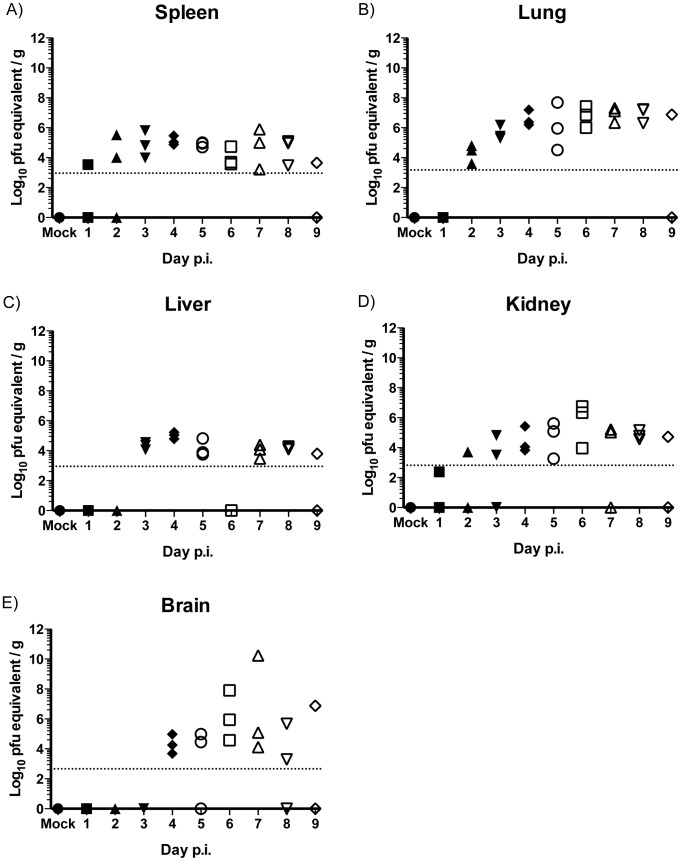
Total RNA was extracted from brain, lung, liver, kidney and spleen homogenates for analysis using a WNV specific qRT-PCR protocol to determine infection by the presence or absence of genomic viral RNA. Using this method, viral RNA was detected on day 1 p.i. in the spleen (Figure 2A) and day 2 p.i. in the lung (Figure 2B). In contrast to the plaque assay, viral RNA was detected in the liver on day 3 p.i. (Figure 2C), on day 1 p.i. in the kidney (Figure 2D) and on day 4 p.i. in the brain (Figure 2E). The qRT-PCR method enabled determination of WNV RNA spread (and by extension, presence of virus) to visceral tissues with greater sensitivity than plaque-assay (summarized in Table 1). As with the infectious virus titers, at least some of the viral RNA detected in organ samples collected at days 1–3 may be attributed to presence of virus or virus-infected cells in blood. For the liver, viral RNA was detected only starting at day 3. Viral RNA “titer” in the liver from day 3 through day 9 was stable at 103 to 105 PFU equivalent/gram, potentially indicating that the viral RNA detected had a source other than infected liver tissue.
Figure 2. Levels of viral RNA in peripheral tissue of Swiss Webster outbred mice quantified by qRT-PCR.
Total RNA was extracted from (A) spleen, (B) lung, (C) liver, (D) kidney and (E) brain of infected SW and levels of viral RNA determined. Data are presented as Log10 PFU equivalents per gram (g); Dotted lines are set at the same LOD as figure 1 for visual comparison of the two assays, n = 3 mice per time point.
Table 1. WNV dissemination per tissue.
| Tissue | plaque assay | qRT-PCR |
| Spleen | 12/27 | 22/27 |
| Lung | 7/27 | 22/27 |
| Liver | 0/27 | 16/27 |
| Kidney | 3/27 | 19/27 |
| Brain | 8/27 | 14/27 |
Summary of WNV dissemination per tissue as determined by plaque assay and qRT-PCR.
Dynamic Gene Expression Profile of Tissue-Specific Inflammatory Responses
The dynamic gene expression profiles of the inflammatory response in WNV-infected SW outbred mice were analyzed using the nCounter system, a next generation digital gene expression system that allows for multiplex-gene expression analysis in one reaction without the need of enzymatic RNA amplification. A predefined 179-gene expression mouse inflammation (Table S1) panel was used to analyze daily changes in gene expression profiles (GEP) in the spleen, lung, liver, kidney and brain in mice infected with WNV compared to mock control SW mice. A general picture of GEP trends was obtained by comparing significance versus fold changes for each gene per day. This preliminary analysis identified 41 differentially expressed genes (DEG) in the spleen, 114 in the lung, 19 in the kidney, 61 in the liver and 9 in the brain (Figure S1). The very large number of DEG identified in the lung from 4 to 8 days p.i. was an unexpected finding and to our knowledge no previous studies have shown this.
Genes which had changes in their expression levels most strongly correlated with detection of viral RNA were identified (Red and Blue circles, Figure 3) by generating gene expression networks for brain, liver, spleen, and kidney. This analysis identified genes that changed their expression levels above the 95th percentile of the tissue-specific Kullbeck-Leibler (K-L) divergence [33] calculated between gene expression in WNV RNA(+) tissue relative to WNV RNA(−) tissue. This general analysis revealed that expression of DNA damage inducible transcript 3 (DDIT3), an apoptosis promoter gene was down-regulated in infected brain tissue and was associated with a reduction in expression of 14 of other genes in that tissue. For spleen, Stat1, Max, and C1qb, were all upregulated in infected tissue and showing an association with a large number of other genes in that tissue (large blue circles). Cd401g was down-regulated in spleen and also showed association with a large number of other genes in this tissue (large red circle). For kidney, two transcriptional effectors, Nr3c1 and Creb1 were the genes showing an association with a large number of other genes. Even though the lung showed 114 DEG, no connections between genes were found at the significance threshold used in this analysis. Liver analysis is not shown as we could not conclusively demonstrate liver infection thus rendering correlations non-informative.
Figure 3. Maximally transition-relevant gene expression networks for (A) brain, (B) spleen, and (C) kidney in WNV-infected Swiss Webster mice.
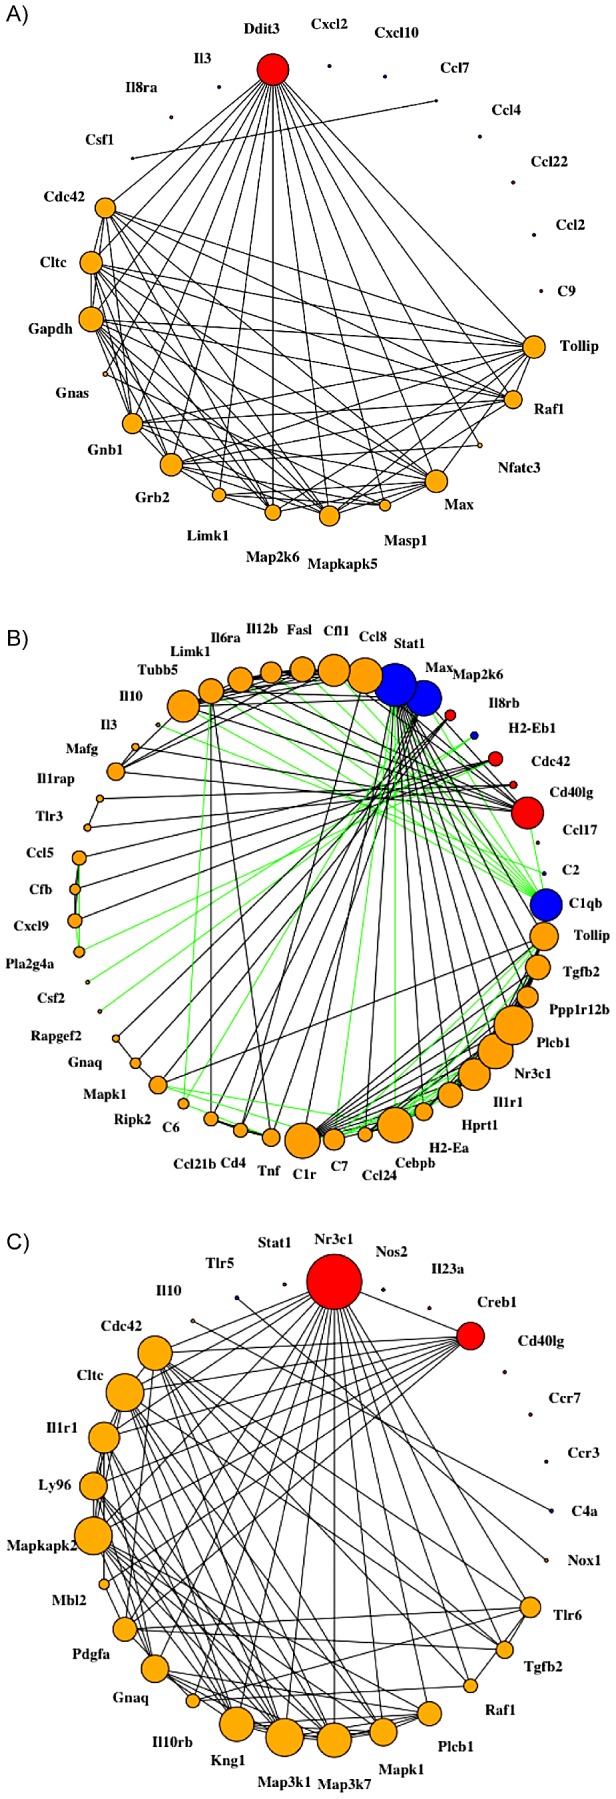
Blue and red nodes are maximally transition-relevant (MTR) genes, defined as those genes that changed their expression levels above the 95th percentile of the tissue-specific K-L divergence calculated between gene expression in WNV RNA(+) infected tissue relative to WNV RNA(−) infected tissue. Blue indicates upregulation of the gene and red labels down-regulation. Edges between two genes X and Y in the networks indicate a Pearson correlation coefficient P(X,Y) with an absolute value over 97.5-th percentile. Orange nodes are first-degree neighbors of the MTR genes. Black edges indicate a positive correlation coefficient (i.e. between the two genesand green indicates a negative coefficient (anti-correlation). Nodes are sized by degree, i.e. how many other genes the node is connected to. Lung is not shown because there were no connections present at the significance threshold used. Liver is not shown as there was no conclusive evidence of liver infection.
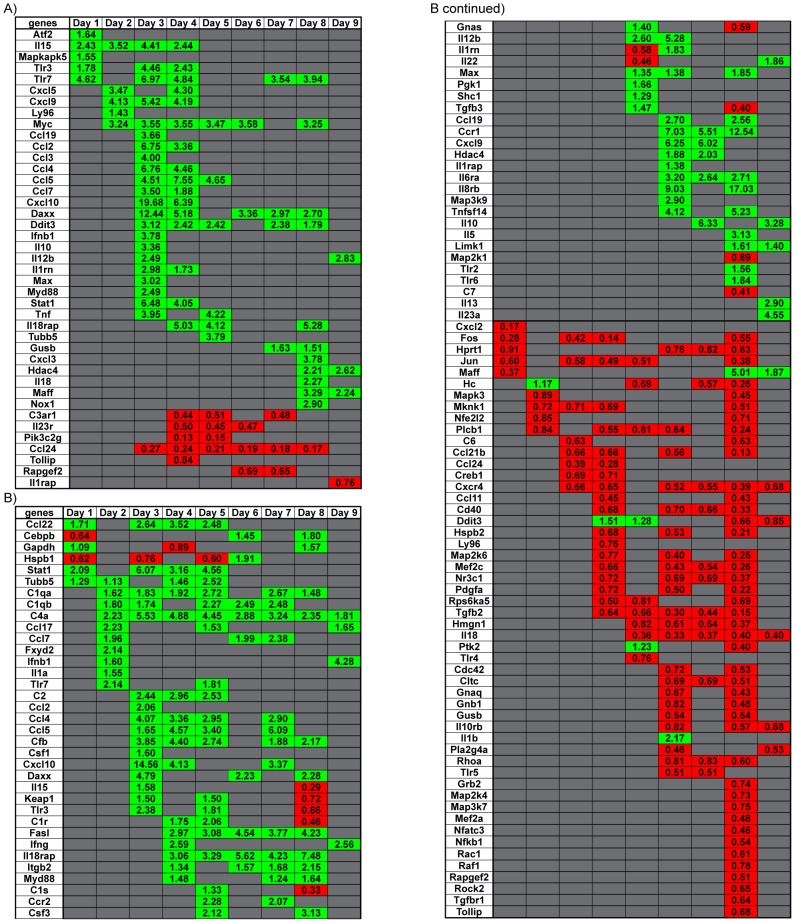
Gene clustering revealed the majority of the DEG in the spleen was observed on days 3 to 5 p.i. (Figure 4A) coinciding with observed peak viral titers in the spleen (Figure 1B). In the lung, the number of up-regulated genes roughly equaled that of down-regulated genes between days 5 to 8 p.i. (Figure 4B) around the time peak viral titers were observed (Figure 1C). No infectious virus was detectable in the liver. However, the number of DEG that were upregulated between days 4 to 9 p.i. (Figure 5A) followed similar trends when compared to observed genomic WNV RNA detected (Figure 2C). In the kidney, the number of DEG peaks at day 8 p.i. (Figure 5B), although infectious virus was not consistently detected and viral RNA peaked at day 6 (Figure 2D). Interestingly, after day 1 p.i., all DEG in the kidney were down-regulated. In the brain, the number of DEG was small compared to the spleen and lung and these were mostly down regulated (Figure 5C).
Figure 4. Dynamic Gene Expression profiles in various tissues over course of infection.
Heatmap of specific genes in (A) spleen, and (B) lung that had a significant change in gene expression per day over the course of infection. Green shaded boxes represent genes that were upregulated and red shaded boxes represent genes that were downregulated. Fold change for each gene is denoted within each shaded box. Data points represent n = 3 mice per day, p<0.05 consider statistically significant.
Figure 5. Dynamic Gene Expression profiles in various tissues over course of infection.
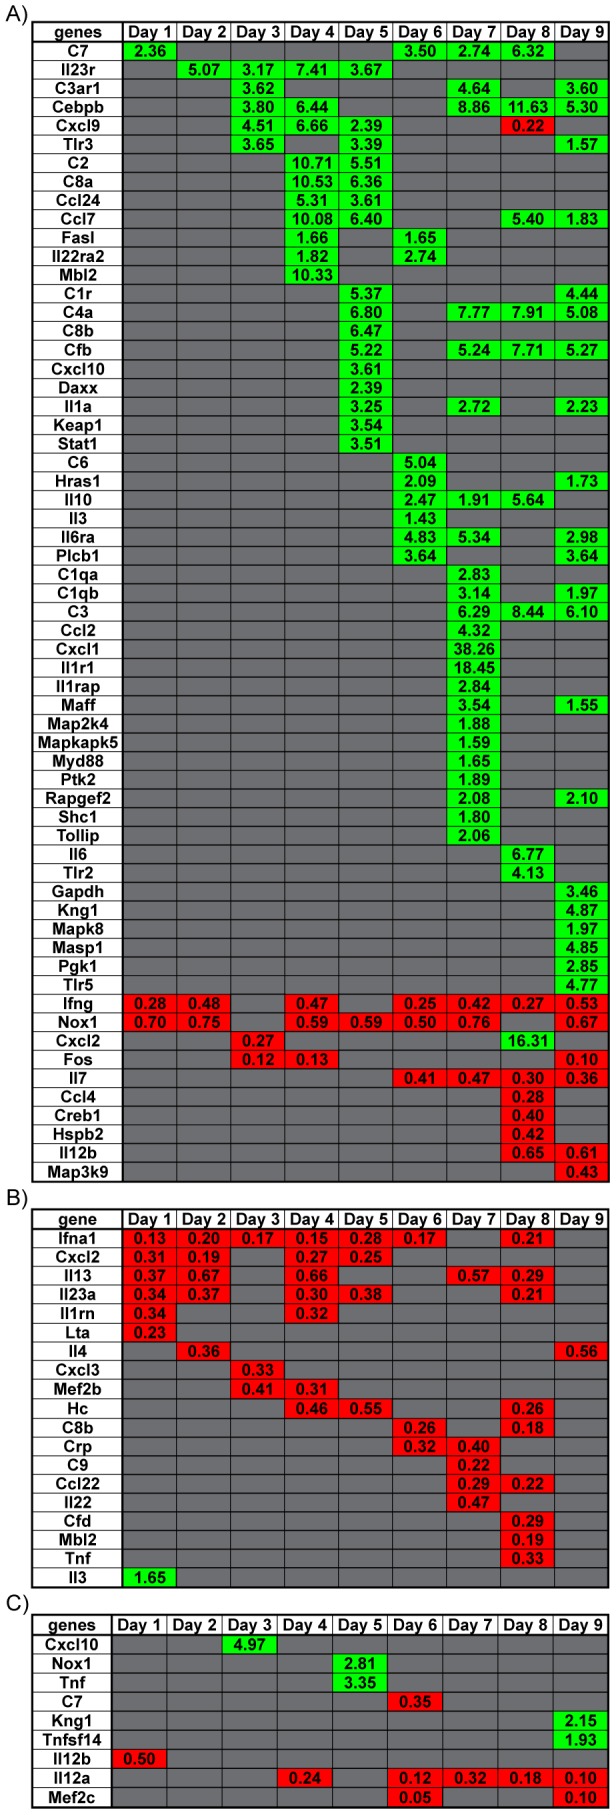
Heatmap of specific genes in (A) liver, (B) kidney, and (C) brain that had a significant change in gene expression per day over the course of infection. Green shaded boxes represent genes that were upregulated and red shaded boxes represent genes that were downregulated. Fold change for each gene is denoted within each shaded box. Data points represent n = 3 mice per day, p<0.05 consider statistically significant.
Differentially Expressed Genes Common or Uniquely Expressed Across Multiple Tissues
Using the nCounter system, changes in gene expression profiles were tracked in multiple tissues through an entire course of infection and genes that are commonly and uniquely differentially expressed in multiple tissues were identified. To our knowledge, such a comprehensive analysis of the inflammatory response to viral infection in an outbred animal model has not been previously described or attempted through other methods.
Chemokine gene Cxcl10 and the cytokine gene Il12b were differentially expressed in four of five tissues (Figures 4 & 5 and Table 2). Consistent with previous reports, Cxcl10 was highly expressed in the brain [37]–[39], spleen [37], liver [31] and lung (described here). The expression of Il12b has been reported to decrease in the blood and brain of Tlr7−/− mice infected with WNV [40]. This study also showed Il12b expression levels lowered in the brain and liver, while Il12b expression levels were higher in the spleen and lung.
Table 2. Common and uniquely differentially expressed genes in tissues from WNV infected SW mice.
| Distribution | Tissues | Number of Genes | Gene Function | |||||
| Chemokine Ligands & Receptors | Cytokine Lignads & Receptors | Complement | Signal Transduction | Toll-like Receptors and Associated Proteins | Transcriptional Regulators | |||
| Common in 4 tissues | Spleen/Lung/Liver/Brain | 2 | Cxcl10 | Il12b | ||||
| Common in 3 tissues | Spleen/Lung/Liver | 14 | Ccl2 Ccl4 Ccl7 Ccl24 Cxcl9 | Il1rap Il10 | Myd88 Rapgef2 Daxx | Tollip Tlr3 | Maff Stat1 | |
| Spleen/Lung/Kidney | 1 | Il1rn | ||||||
| Spleen/Liver/Brain | 1 | Nox1 | ||||||
| Spleen/Kidney/Brain | 1 | Tnf | ||||||
| Lung/Liver/Brain | 1 | Cxcl2 | ||||||
| Lung/Liver/Brain | 1 | C7 | ||||||
| Common in 2 tissues | Spleen/Lung | 13 | Ccl5 Ccl19 | Il15 Il18 Il18rap Ifnb1 | Gusb Tubb5 | Tlr7 Ly96 | Ddit3 Hdac4 Max | |
| Spleen/Liver | 3 | C3ar1 | Il23r | Mapkapk5 | ||||
| Spleen/Kidney | 1 | Cxcl3 | ||||||
| Lung/Liver | 25 | Il1a Il6ra Ifng | C1qa C1qb C1r C2 C4a C6 Cfb | Fasl Fos Gapdh Hspb2 Map3k9 Map2k4 Pgk1 Plcb1 Ptk2 Shc1 | Tlr2 Tlr5 | Cebpb Creb1 Keap1 | ||
| Lung/Kidney | 5 | Ccl22 | Il13 Il22 Il23a | Hc | ||||
| Lung/Brain | 2 | Tnfsf14 | Mef2c | |||||
| Liver/Kidney | 3 | Il3 | C8b Mbl2 | |||||
| Liver/Brain | 1 | Kng1 | ||||||
| Tissue-Specific | Spleen | 5 | Ccl3 Cxcl5 | Pik3c2g | Atf2 Myc | |||
| Lung | 48 | Ccl11 Ccl17 Ccl21b Ccr1 Ccr2 Csf1 Csf3 Cxcr4 | Il1b Il10rb Il5 Il8rb | Cd40 Cdc42 Cltc Fxyd2 Gnas Gnaq Gnb1 Grb2 Hprt1 Hspb1 Itgb2 Limk1 Map2k1 Map2k6 Mapk3 Map3k7 Mknk1 Nfkb1 Pdgfa Pla2g4a Rac1 Raf1 Rhoa Rps6ka5 Rock2 Tgfb2 Tgfb3 Tgfbr1 | Tlr4 Tlr6 | Hmgn Jun Mef2a Nfatc3 Nfe2l2 Nr3c1 | ||
| Liver | 10 | Cxcl1 | Il1r1 Il22ra2 Il6 Il7 | C3 C8a Masp1 | Hras1 Mapk8 | |||
| Kidney | 7 | Il4 Ifna1 Lta | C9 Cfd Crp | Mef2b | ||||
| Brain | 1 | Il12a | ||||||
Commonly and uniquely expressed genes that were differentially expressed in spleen, lung liver, kidney and brain. All changes were found to be statistically significant, p<0.05.
DEG in three of the five tissues collected were then analyzed. DEG common to the spleen, lung and liver totaled 14 and included seven chemokine and cytokine genes, 3 signal transduction genes, 2 TLR genes and 2 transcriptional regulators (summarized in Table 2). DEG common to the lung, liver and kidney were alternative complement pathway gene Cfb, and chemokine gene Cxcl2. A complement factor gene (C7) is differentially expressed (DE) in the lung, liver and brain. A signal transduction gene (Nox1) is DE in the spleen, liver and brain. A cytokine gene (Tnf) is DE in the spleen, kidney and brain (Table 2). Large numbers of DEG were found to be common to two tissue types and a number of genes were uniquely expressed in a tissue-specific manner (summarized in Table 2).
In order to better understand biological mechanisms that may be involved in the inflammatory response against WNV infection, the list of DEG from each individual tissue was then used to perform a KEGG pathway enrichment analysis using DAVID [34], [35]. This analysis identified several biological pathways that were consistently activated in the tissues studied (Table 3). Among the top pathways identified in most tissues were cytokine-cytokine receptor interactions, Toll-like receptor signaling, chemokine signaling, JAK-STAT signaling, MAPK signaling and complement and coagulation cascades. The complete pathway enrichment for each tissue is summarized in (Table 3). Brain was not included in this analysis due to an insufficient number of DEG identified.
Table 3. KEGG pathway enrichment from tissue-specific, differentially expressed genes.
| Spleen | |||||
| Term | Genes | Count | % | p Value | Benjamini |
| Cytokine-cytokine receptor interaction | CCL3, IL18RAP, TNF, CCL2, IL23R, CXCL5, IL18, CXCL9, CCL19, IL15, CCL5, CCL4, IL10, CCL7, CXCL10, CCL24, IFNB1, IL1RAP, IL12B | 19 | 46.3 | 4.90E-16 | 2.31E-14 |
| Toll-like receptor signaling pathway | CCL3, TNF, TOLLIP, LY96, CXCL9, TLR3, CCL5, STAT1, TLR7, CCL4, CXCL10, MYD88, IFNB1, IL12B | 14 | 34.1 | 8.93E-15 | 2.31E-13 |
| Chemokine signaling pathway | CCL24, CCL3, CCL2, CXCL5, CXCL9, CCL19, CCL5, STAT1, CCL4, CCL7, CXCL10 | 11 | 26.8 | 1.00E-07 | 1.73E-06 |
| Jak-STAT signaling pathway | IL23R, IFNB1, IL12B, IL15, STAT1, MYC, IL10 | 7 | 17.1 | 3.16E-04 | 4.10E-03 |
| Cytosolic DNA-sensing pathway | IFNB1, IL18, CCL5, CCL4, CXCL10 | 5 | 12.2 | 3.54E-04 | 3.68E-03 |
| NOD-like receptor signaling pathway | TNF, CCL2, IL18, CCL5, CCL7 | 5 | 12.2 | 5.62E-04 | 4.86E-03 |
| MAPK signaling pathway | MAX, TNF, MAPKAPK5, RAPGEF2, DAXX, MYC, DDIT3, ATF2 | 8 | 19.5 | 1.09E-03 | 8.07E-03 |
| *RIG-I-like receptor signaling pathway | TNF, IFNB1, IL12B, CXCL10 | 4 | 9.8 | 8.60E-03 | 5.46E-02 |
KEGG pathway enrichment from tissue specific DEGs: FDR<0.05.
* Indicates Biological pathway greater than the set FDR but is included, as this pathway has been implicated in WNV infections.
STRING (Search Tool for the Retrieval of Interacting Genes/Proteins) was used to identify protein-protein interactions (PPI) networks for all DEG within each tissue [36]. STRING is a database of known and predicted functions that are derived from direct (physical) and indirect (functional) associations derived from genomic context, high throughput experiments, conserved coexpression and previous knowledge [36]. Networks for spleen, kidney, lung, liver and brain were generated (shown in Figure S2A–E). Brain was included in this analysis even though no biological pathways were identified for this organ using DAVID as a PPI network could be generated using STRING with the limited number of DEG. Consistent with the analysis of DEGs described above, the most significantly activated pathways within the PPI network for each tissue (with the exception of the brain) were cytokine-cytokine receptor interactions for the lung (Figure S3), liver (Figure S4), spleen (Figure S5) and kidney (Figure S6), followed by Toll-like receptor signaling pathways for the lung (Figure S7) and spleen (Figure S8), complement and coagulation cascades for the liver (Figure S9) and JAK-STAT signaling pathway for the kidney (Figure S10). High throughput gene expression analysis enabled identification of common and differentially expressed genes in various tissues and a pathway enrichment analysis that allowed for the identification and visualization of relevant pathways that were enriched with DEG to better understand biological processes involved in WNV of the SW mouse model.
Expression of Inflammatory Response Genes and Their Correlation to Infectious WNV Titers
Having determined DEG in the various tissues analyzed, correlations between amounts of virus and/or viral RNA (as determined by viral titers and/or viral RNA via qRT-PCR) and DEG identified were sought. Pearson correlation was performed with cutoff for significance at p<0.05.
Significant correlation was observed between virus titers and DEG in the spleen and lung (Figure 6 A and B) but not the kidney and brain (data not shown). For example, in the spleen Ccl2, Ccl3, Ccl4, Ccl5, Daxx, Il1rn, Myc, Myd88, Stat1 and Tlr3 were shown to have a significant positive correlation with WNV titers (Figure 6A), while genes that had a significant positive correlation with virus titers in the lung were Stat1, C1qa, C1qb and C3ar1 (Figure 6B).
Figure 6. Correlation of inflammatory response genes to WNV viral titers in spleen and lung.
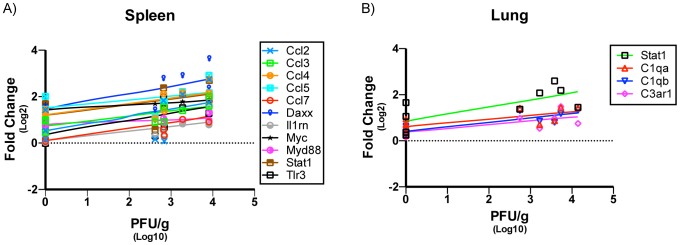
Following gene expression analysis a Pearson's correlation test was performed on all genes that were determined to be significant. Gene expression versus viral titers (PFU/g) correlation was determined to be significant if p<0.05. A positive linear dependence was found for several genes in the A) Spleen and B) Lung of WNV infected SW mice; n = 3 mice per day.
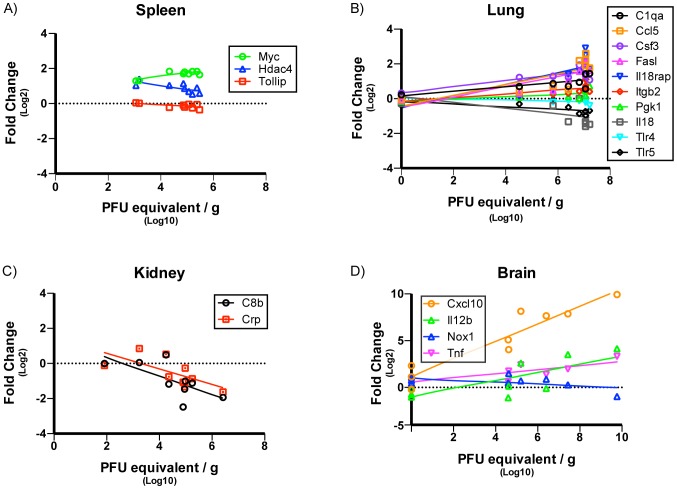
Significant correlation was detected between amount of viral RNA present (expressed as PFUequivalents/g) and DEG in the spleen, lung, kidney and brain (Figure 7). No such correlations could be made for any genes in the liver. A positive correlation for Myc and negative correlations for Hdac4 and Tollip were observed in the spleen (Figure 7A). In the lung, positive correlations were found for C1qa, Ccl5, Csf3, Il18rap, Itgb2, Fasl and Pgk1 and negative correlations were found for Il18, Tlr4 and Tlr5 (Figure 7B). In the kidney there were negative correlations for C8b and Crp (Figure 7C). Positive correlations for Cxcl10, Il12b and Tnf were found in the brain while a negative correlation was found for Nox1 in that tissue (Figure 7D). Overall the analysis performed here has allowed correlation of gene expression profiles using two parameters (i.e. infectious virus and genomic RNA titers) commonly used to quantitate WNV infections. Whether these host gene changes are correlates of protection or disease in the individual tissues remains to be investigated in future studies.
Figure 7. Correlation of inflammatory response genes to WNV PFU equivalents in spleen, lung, kidney and Brain.
A Pearson's correlation test was performed as previously described. Gene expression versus PFU equivalents (PFU/g) correlation was determined to be significant if p<0.05. Both positive and negative linear dependence were found for several genes in the (A) spleen, (B) lung and (C) kidney and (D) brain of WNV infected SW mice; n = 3 mice per day.
Protein Expression and Viral Kinetics in Tissue-Specific Responses
Expression levels for 23 cytokine proteins in homogenized tissue extracts (constituting a subset of the 179 genes analyzed by the nCounter) were determined using a multiplex immunoassay (Bio-Plex Pro). Changes in protein expression, measured as mean fluorescence intensity (MFI), were analyzed using a heteroscedastic student's t-test and changes in protein expression were considered significant for p<0.05. A general picture of protein expression trends was obtained by comparing significance versus fold changes for each protein MFI per day on a volcano plot for spleen, lung, liver, kidney and brain (data not shown). These analyses identified 19 cytokine proteins in the kidney, 18 in the liver, 17 in spleen, 14 in the brain and 10 in the lung that were differentially expressed (data not shown). In the spleen, multiple proteins were down-regulated at day 1 p.i. however, the majority of proteins were significantly upregulated at later time points and DE proteins peaked between days 3 and 4 p.i. (Figure 8A). In the lung and kidney, the numbers of DE proteins were mostly upregulated and peaked at day 4 p.i. for the lung and day 7 p.i. for the kidney (Figures 8B and 8D). In the liver, all significantly DE proteins were upregulated with maximal numbers of such DE proteins observed on days 3, 8 and 9 (Figure 8C). In contrast to the other tissues where a number of proteins were DE over multiple days, in the brain DE proteins were concentrated at day 7 (Figure 8E).
Figure 8. Dynamic Protein Expression profiles in various tissues over course of infection.
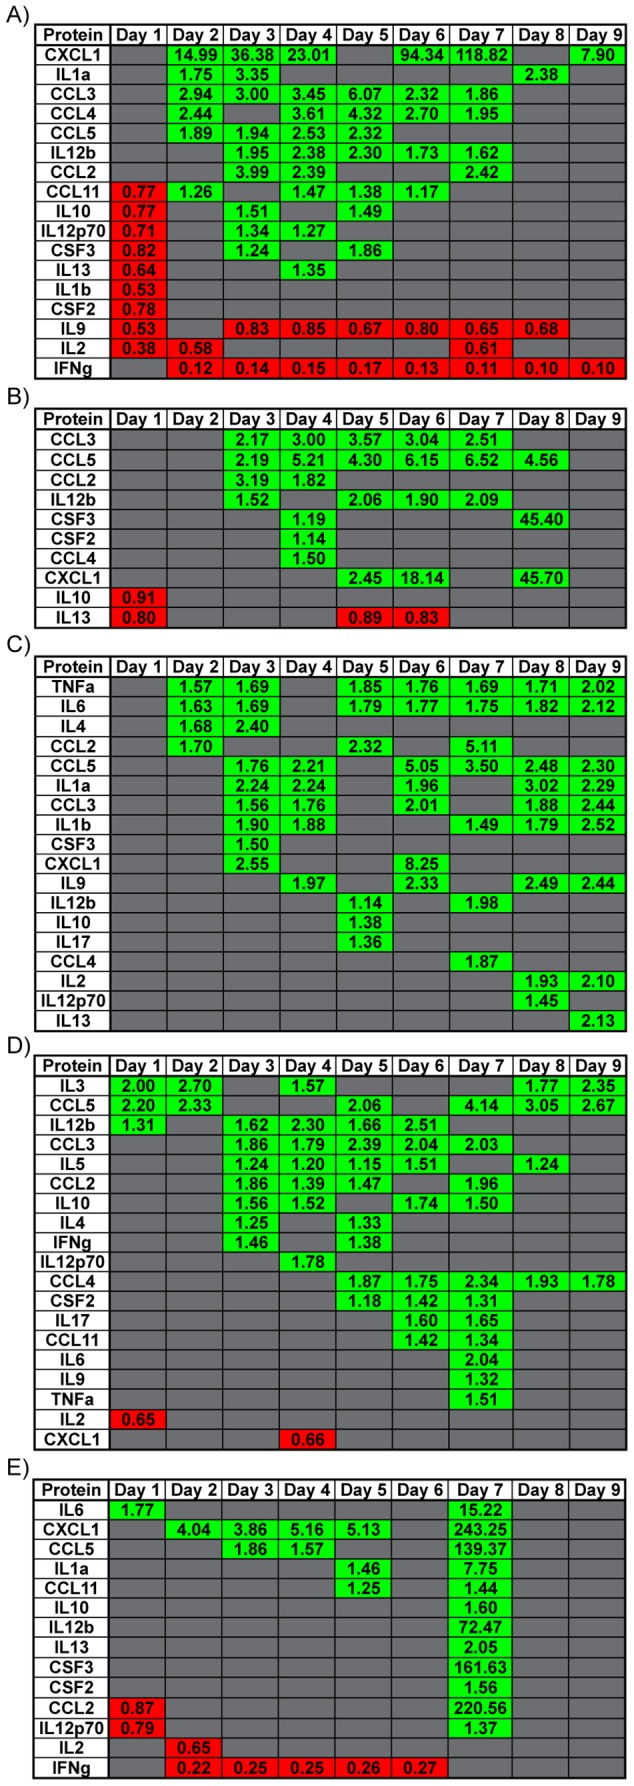
Heatmap of specific genes in (A) spleen, (B) lung, (C) liver, (D) kidney and (E) brain that had a significant change in protein expression per day over the course of infection. Green shaded boxes represent genes that were upregulated and red shaded boxes represent genes that were downregulated. Fold change for each gene is denoted within each shaded box. Data points represent n = 3 mice per day, p<0.05 consider statistically significant.
Viral Infection and Chemokine Expression Kinetics
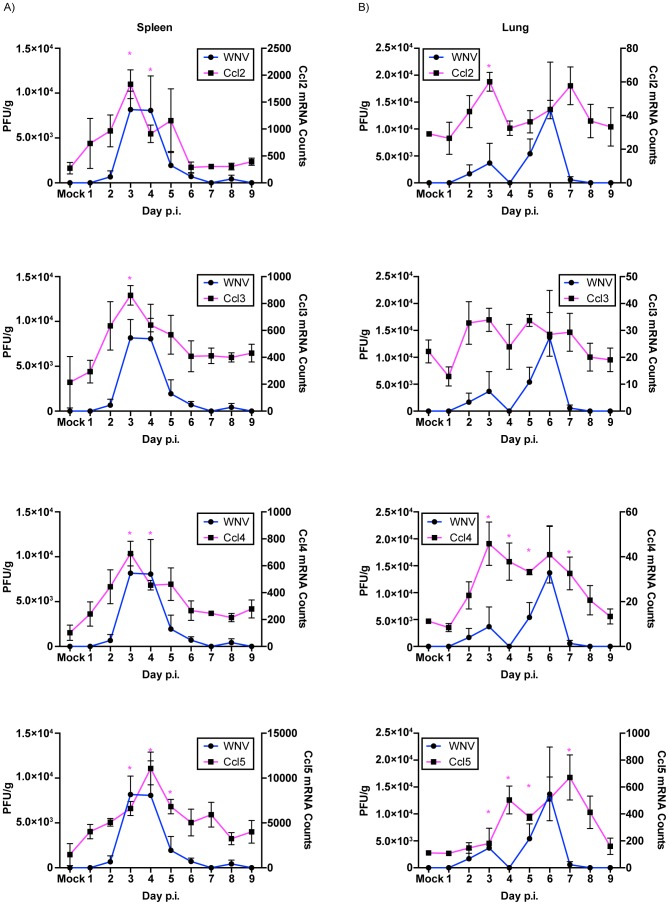
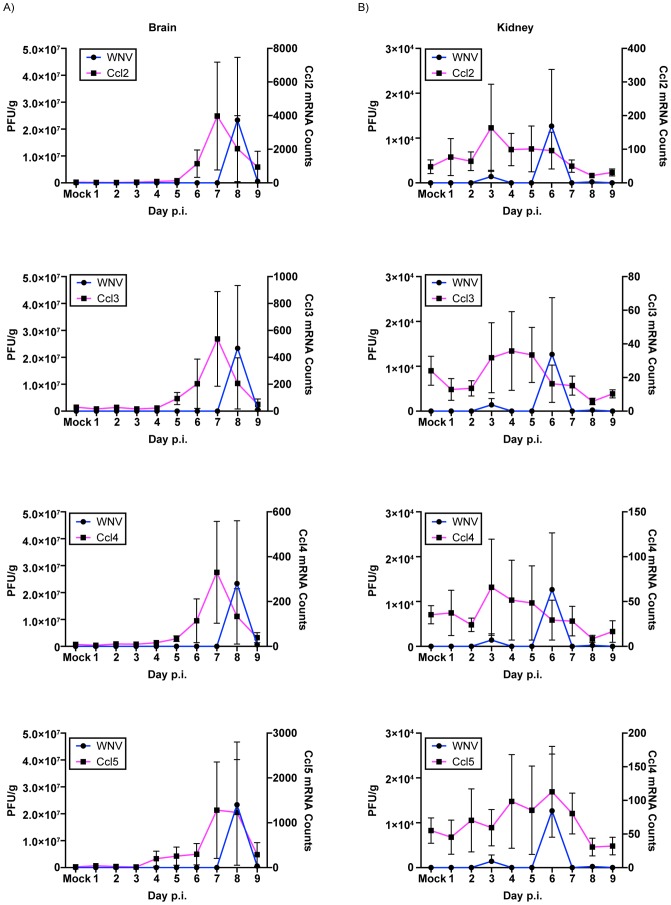
A subset of chemokine genes was then examined to assess their expression kinetics relative to viral infections in the spleen, lung, kidney and brain. Due to the fact that no infectious virus was recovered from the liver in this study, no correlations between viral infection and chemokine expression kinetics could be undertaken. Previous studies using inbred mouse strains have reproducibly shown the up-regulation of chemokines such as Ccl2, Ccl3, Ccl4 and Ccl5 in various tissues in response to WNV infection [37], [38], [41]–[43]. Our study also found these chemokines to be differentially expressed in various tissues. To test whether the chemokine expression kinetics correlated with viral replication kinetics, total mRNA counts of the individual genes and viral titers (PFU) over the course of infection for spleen, lung, kidney and brain were plotted. As shown in Figure 8 the expression kinetics of Ccl2, Ccl3 and Ccl4 were observed to mirror the kinetics of infectious virus for the spleen (Figure 9A), lung (Figure 9B) and brain (Figure 10A) but not the kidney (Figure 10B). Expression of Ccl5 had similar kinetics as infectious virus for spleen, lung and brain but not kidney (Figures 9 & 10).
Figure 9. Kinetics of gene expression and WNV viral titers in the (A) spleen and (B) lung of WNV infected SW mice.
WNV titers (left Y-axis) and gene expression levels (right Y-Axis) were plotted over time and the kinetics of viral titers and gene expression analyzed. CCL2, CCL3, CCL4 and CCL5 had similar expression kinetics that mirrored those of WNV titers in the tissues. Error bars represent SEM; n = 3 mice per day. * represents statistically significant changes for mRNA (magenta).
Figure 10. Kinetics of gene expression and WNV viral titers in the (A) kidney and (B) brain of WNV infected SW mice.
WNV titers (left Y-axis) and gene expression levels (right Y-Axis) were plotted over time and the kinetics of viral titers and gene expression analyzed. CCL2, CCL3, CCL4 and CCL5 had similar expression kinetics that mirrored those of WNV titers in the tissues. Error bars represent SEM; n = 3 mice per day. * represents statistically significant changes for mRNA (magenta).
The kinetics between peak viral infection in individual tissues and gene expression and protein expression profiles for a few select chemokines for spleen, lung, kidney and brain were investigated and similar patterns for both RNA and protein expression for all but CCL4 in the kidney were found (data not shown).These data demonstrate the successful use of complementary high throughput gene and protein expression as reliable methods to determine specific immune responses elicited by viral infection and how these changes relate to the kinetics of viral replication.
Specific Gene Expression Analysis of WNV infected Tissues
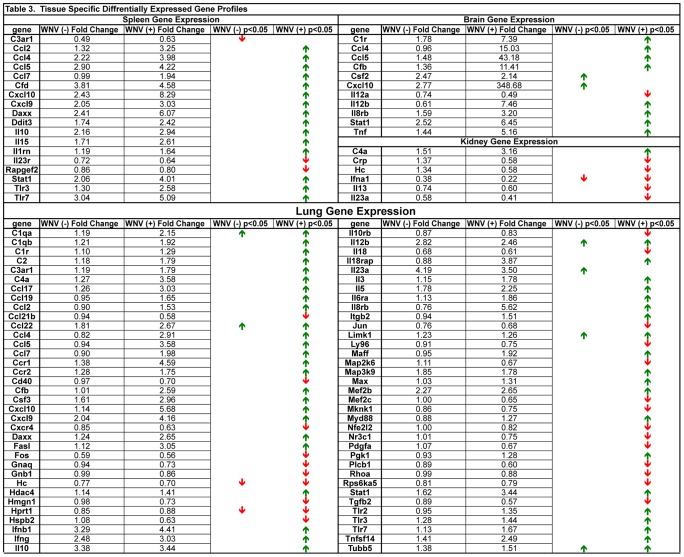
The present study allowed analysis of the dynamic gene expression profiles of the inflammatory response over the course of WNV infection in outbred SW mice. Gene expression data was stratified to evaluate whether any significant changes in gene expression could be determined in tissues that were confirmed infected (WNV (+)) versus tissues that were negative for infection (WNV (−)) and PFU equivalents determined using qRT-PCR and compared both to mock-infected SW mice (Table 1). WNV (−) spleen tissue had a significantly lower C3ar1 expression compared to WNV infected spleen (Figure 11). In WNV (−) lung, Il23a was significantly upregulated while Il10rb, an accessory protein for the IL10 receptor, was significantly down-regulated. Genes that were significantly upregulated only in WNV (−) brain tissue were Csf2 and Cxcl10 (Figure 11). A large number of genes in the lung were determined to have changes in their expression in WNV (+) lung tissue vs. WNV (−) lung tissue.
Figure 11. Stratification of genes that were differentially expressed in tissues determined to be infected (WNV (+)) or uninfected (WNV (−)) based on sensitive qRT-PCR detection of WNV RNA.
Fold change is indicated in the columns based on mock-infected tissues. Red arrows indicate decreased gene expression and green arrows increased gene expression. Absence of arrows indicates no statistically significant change observed. Mock for all tissues n = 3; spleen WNV (−) n = 5 and WNV (+) n = 22; lung WNV (−) n = 5 and WNV (+) n = 22; liver WNV (−) n = 11 and WNV (+) n = 16; kidney WNV (+) n = 8 and WNV (+) n = 19; brain WNV (−) n = 13 and WNV (+) n = 14; p<0.05 considered significant.
The same analysis was performed for protein expression levels using the Bio-Plex Pro data and the results are summarized in Figure 12. Overall these analyses enabled distinction between RNA and protein expression changes that may be associated with a general inflammatory response compared to genes and proteins that were specific for WNV (+) and WNV (−) tissues from WNV infected SW mice.
Figure 12. Stratification of proteins that were differentially expressed in tissues determined to be infected (WNV (+)) or uninfected (WNV (−)) based on sensitive qRT-PCR detection of WNV RNA. Fold change are indicated in the columns based on mock-infected tissues.
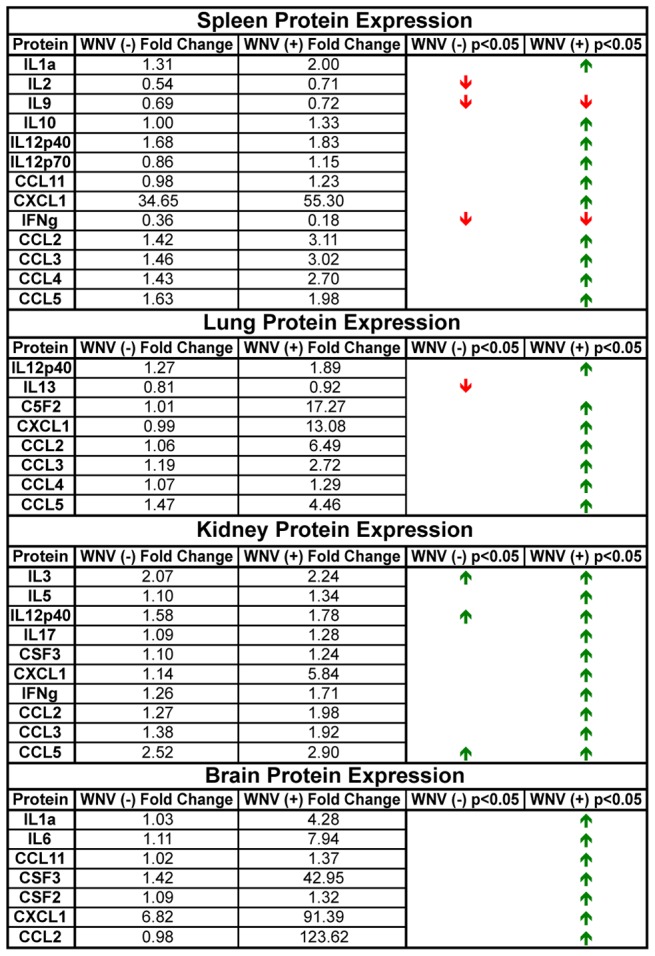
Red arrows indicate decreased gene expression and green arrows increased gene expression. Absence of arrows indicates no statistically significant change observed. Mock for all tissues n = 3; spleen WNV (−) n = 5 and WNV (+) n = 22; lung WNV (−) n = 5 and WNV (+) n = 22; liver WNV (−) n = 11 and WNV (+) n = 16; kidney WNV (+) n = 8 and WNV (+) n = 19; brain WNV (−) n = 13 and WNV (+) n = 14; p<0.05 considered significant.
Discussion
Technological advances have allowed profiling of living systems at the genome, transcriptome, and proteome levels in response to various stressors or disease states. In this study, the first in-depth characterization of WNV infection in the SW outbred weanling mouse model was performed using the nCounter platform for multiplex-gene expression analysis in a single reaction without the need of enzymatic target amplification. Unlike other platforms, (such as microarray and/or next generation sequencing) the nCounter platform enables high throughput, sensitive, quantitative, and reproducible gene expression analysis of multiple samples over the course of infection without the need for complex data analysis or confirmation of results by qRT-PCR. Thus, the nCounter enabled rapid gene expression profiling of a large number of inflammatory response genes from multiple tissues over the course of WNV infection in an outbred mouse model and to rapidly differentiate between general versus specific gene expression changes in WNV (+) vs. WNV (−) tissues.
The temporal and dynamic analyses of viral burdens, kinetics and tissue tropisms generated results similar to those described for WNV infection using inbred mouse models, such as the C3H/HeN, C57BL/6 and BABL/C (for extensive reviews see [12], [13]). Therefore, despite the high susceptibility of SW mice to neuroinvasive WNV disease, their responses to infection are generally comparable to those of more resistant inbred strains such as C57BL/6. Following peak viremia, WNV dissemination to secondary tissues was observed in the spleen, lung, kidney, and brain of infected SW outbred mice. Although the animals used in these studies were not perfused prior to collection of tissues, we assumed some of the infectious virus detectable at days 1 to 3 could be present from blood. However, in all cases but the liver the tissue titers were high enough (equal to or greater than the concurrent PFU/mL virus titer in serum) to suggest local replication was occurring. Overall, these studies demonstrated similar viral kinetics and tissue tropisms in SW outbred mice and inbred mice used to study WNV infection. Brown et al [9] described differences in survival rates of 6-week-old C3H and C57BL/6 mice despite comparable levels of neuroinvasion and similar virus loads in the periphery. Use of the nCounter system, coupled with other genomic and proteomic tools, in focused comparative studies between mouse strains and assessing other host variables that appear to influence susceptibility, such as age, should provide novel insights into specific responses that correlate with protection against neuroinvasion and/or lethal WNV disease following peripheral infection.
Infection of the lung had only been previously described in wild-type (WT) C3H/HeN and C57BL/6 [9] and in IFN-α/βR−/− mice [17]. Relevant to this observation, recent studies found a strong correlation between respiratory insufficiency and mortality in WNV infected hamsters where infection of the ventrolateral medulla, responsible for respiratory control, was reported [44]. In this study, DEG profiles of the lung revealed an increase in expression for TLR2, TLR3, TLR6 and TLR7 genes. Previous studies in TLR3−/− mice have shown increased susceptibility and resistance to WNV infection [45], [46]. TLR7 and the adaptor protein MYD88 have been shown to be required against lethal WNV infection [40], [47]. In other systems TLR2 signaling has been shown to be activated by the hemagglutinin protein of measles virus [48], Core/NS3 protein of HCV [49] and in mice infected with HCMV, LCMV [50], [51] and HSV-1 [52]. Interestingly a recent study on influenza demonstrated TLR2/6 signaling to induce a protective role in mice [53]. Whether this increased expression of TLR2 and TLR6 mediates protective immunity against WNV infection in the lung remains to be further studied.
In the context of WNV infection, the liver is generally considered to be non-or poorly permissive to WNV infection [9]. Although the studies presented here demonstrated detection of genomic WNV RNA using qRT-PCR despite lack of recovery of infectious virus from this tissue at any timepoint, it is unclear whether this represents a low level of viral replication in this organ. Similar to this observation, in another recent study, the livers of WT C57BL/6 infected subcutaneously with a Texas 2002 WNV strain (lineage I) were shown to be infected using sensitive qRT-PCR but not plaque assay [31]. The data presented here also indicate that expression of complement factors during WNV infection in SW mice is tissue specific, and suggest complement expression in the liver to be the result of a systemic acute phase response to WNV infection and not necessarily the result of infection of the liver.
In the kidney, chemoattractant genes CXCL2, CXCL3 and CCL22 were down-regulated. Previous studies have shown that polymorphonuclear leukocytes have increased CXCL1 and CXCL2 expression when infected with WNV [54]. Interestingly, this study also found increased expression of CXCL1, CCL2, CCL3 and CCL5 proteins in WNV-infected kidney tissue. Expression of locally secreted chemokines has been shown to aid in the recruitment of leukocytes in the initiation and amplification phase of renal inflammation. However, these can also cause renal damage through the release of pro-inflammation and pro-fibrotic factors [55]. Thus the rapid down modulation of these genes can serve to limit acute inflammation and prevent renal damage. Whether the decreased expressions in these studies are associated with this balance response remains to be determined.
Consistent with earlier studies in inbred mouse strains, DEG that were identified in the spleen, lung, kidney, liver and brain were primarily associated with chemokine, cytokine, complement, cytoskeletal and signal transduction, pathogen-associate molecular patterns and transcriptional regulator functions [9], [26], [30], [31]. KEGG pathway enrichment analysis of DEG using DAVID also helped identify chemokine/cytokine interactions [34], [56], Toll-like receptor signaling [57]–[60], NOD-like receptor signaling [13], [57], [61] and complement and coagulation pathways [13], [18] which are known to control WNV infection in inbred mouse models. Data stratification of infected vs. non-infected tissues from WNV infected SW mouse allowed differentiation of gene expression responses that we considered to be a general inflammatory response to WNV infection versus tissue specific responses due to infection with WNV. Complementary high throughput protein analysis enabled gene and protein expression kinetics that serve to further validate the gene expression analysis alone.
The nCounter system and complementary methods employed here provide a powerful platform for detailed comparative analysis of the kinetics and magnitude of host responses to WNV infection. Gene expression profiling using the nCounter system provided a rapid and sensitive platform to follow dynamic gene expression changes through the course of WNV infection. Future applications for this technology include comparable studies using variably attenuated WNV strains in the SW mouse model, or virulent WNV strains such as NY99 in more resistant mouse models, to comprehensively define specific innate and adaptive immune responses associated with protection and immunity for the purpose of designing and testing of antiviral therapies and vaccines against WNV infection and neuroinvasive disease. Finally, similar studies using other flaviviruses in similar or different animal models should enhance understanding of host responses common to infection by these viruses.
Supporting Information
Volcano plot of changes in Gene Expression in WNV infected SW outbred Mice. Gene expression profiles for spleen, lung, liver, kidney and brain were analyzed over the course on infection. Changes in gene expression profiles for each tissue was plotted on the Y-axis based on statistical significance in reverse order and fold change (log2) was plotted on the X-axis. Data points represent n = 3 mice per day, p<0.05 considered statistically significant.
(TIFF)
Protein-protein interaction networks identified for all differentially expressed genes in (A) spleen, (B) kidney, (C) lung, (D) liver, and (E) brain using the search tool for the retrieval of interacting genes/proteins (STRING). Confidence view of protein-protein interaction network from DEGs from the liver of WNV infected SW mice. Network clustering was performed with Kmeans = 5. The thickness of the blue line connecting genes and nodes indicates the confidence score of association identified.
(SVG)
Confidence view of cytokine-cytokine receptor interactions in the lung protein-protein interaction network of WNV-infected SW mice. Network clustering was performed with Kmeans = 2. The thickness of the blue line connecting genes and nodes indicates the confidence score of association identified.
(TIF)
Confidence view of cytokine-cytokine receptor interactions in the liver protein-protein interaction network of WNV-infected SW mice. Network clustering was performed with Kmeans = 2. The thickness of the blue line connecting genes and nodes indicates the confidence score of association identified.
(TIF)
Confidence view of cytokine-cytokine receptor interactions in the spleen protein-protein interaction network of WNV-infected SW mice. Network clustering was performed with Kmeans = 2. The thickness of the blue line connecting genes and nodes indicates the confidence score of association identified.
(TIF)
Confidence view of cytokine-cytokine receptor interactions in the kidney protein-protein interaction network of WNV-infected SW mice. Network clustering was performed with Kmeans = 2. The thickness of the blue line connecting genes and nodes indicates the confidence score of association identified.
(TIF)
Confidence view of Toll-like receptor signaling pathways interactions in the lung protein-protein interaction network of WNV-infected SW mice. Network clustering was performed with Kmeans = 2. The thickness of the blue line connecting genes and nodes indicates the confidence score of association identified.
(TIF)
Confidence view of Toll-like receptor signaling pathways interactions in the spleen protein-protein interaction network of WNV-infected SW mice. Network clustering was performed with Kmeans = 2. The thickness of the blue line connecting genes and nodes indicates the confidence score of association identified.
(TIF)
Confidence view of complement and coagulation cascade interactions in the liver protein-protein interaction network of WNV-infected SW mice. Network clustering was performed with Kmeans = 2. The thickness of the blue line connecting genes and nodes indicates the confidence score of association identified.
(TIF)
Confidence view of JAK-STAT signaling pathway interactions in the kidney protein-protein interaction network of WNV-infected SW mice. Network clustering was performed with Kmeans = 2. The thickness of the blue line connecting genes and nodes indicates the confidence score of association identified.
(TIF)
List of genes for which mRNA was quantitated using the Nanostring nCounter system in this study with corresponding accession numbers.
(PDF)
Acknowledgments
This work was performed under the auspices of the U.S. Department of Energy by Lawrence Livermore National Laboratory under Contract DE-AC52-07NA27344. We thank Dr. Gregg Milligan and Dr. Michael S. Diamond for their helpful comments and suggestions on this manuscript. This work was performed under the auspices of the U.S. Department of Energy by Lawrence Livermore National Laboratory under Contract DE-AC52-07NA27344. Document LLNL-JRNL-635401.
Data Availability
The authors confirm that all data underlying the findings are fully available without restriction. They are contained in the manuscript.
Funding Statement
This work was supported by National Institutes of Health grant AI093500 to PNA. JAP was supported by the Biodefense Training Program, NIH grant T32-AI060549. The funders had no role in study design, data collection and analysis, decision to publish, or preparation of the manuscript.
References
- 1. Lim SM, Koraka P, Osterhaus ADME, Martina BEE (2011) West Nile Virus: Immunity and Pathogenesis. Viruses 3: 811–828. [DOI] [PMC free article] [PubMed] [Google Scholar]
- 2. Mostashari F, Bunning ML, Kitsutani PT, Singer DA, Nash D, et al. (2001) Epidemic West Nile encephalitis, New York, 1999: results of a household-based seroepidemiological survey. Lancet 358: 261–264. [DOI] [PubMed] [Google Scholar]
- 3. Petersen LR, Marfin AA (2002) West Nile virus: a primer for the clinician. Ann Intern Med 137: 173–179. [DOI] [PubMed] [Google Scholar]
- 4. Watson JT, Pertel PE, Jones RC, Siston AM, Paul WS, et al. (2004) Clinical characteristics and functional outcomes of West Nile Fever. Ann Intern Med 141: 360–365. [DOI] [PubMed] [Google Scholar]
- 5. Beasley DWC, Barrett ADT, Tesh RB (2013) Resurgence of West Nile neurologic disease in the United States in 2012: What happened? What needs to be done? Antiviral Research 99: 1–5. [DOI] [PubMed] [Google Scholar]
- 6. Chowers MY, Lang R, Nassar F, Ben-David D, Giladi M, et al. (2001) Clinical characteristics of the West Nile fever outbreak, Israel, 2000. Emerg Infect Dis 7: 675–678. [DOI] [PMC free article] [PubMed] [Google Scholar]
- 7. Danis K, Papa A, Theocharopoulos G, Dougas G, Athanasiou M, et al. (2011) Outbreak of West Nile virus infection in Greece, 2010. Emerg Infect Dis 17: 1868–1872. [DOI] [PMC free article] [PubMed] [Google Scholar]
- 8. Danis K, Papa A, Papanikolaou E, Dougas G, Terzaki I, et al. (2011) Ongoing outbreak of West Nile virus infection in humans, Greece, July to August 2011. Euro Surveill 16. [PubMed] [Google Scholar]
- 9. Brown AN, Kent KA, Bennett CJ, Bernard KA (2007) Tissue tropism and neuroinvasion of West Nile virus do not differ for two mouse strains with different survival rates. Virology 368: 422–430. [DOI] [PMC free article] [PubMed] [Google Scholar]
- 10. Wang Y, Lobigs M, Lee E, Koskinen A, Mullbacher A (2006) CD8+ T cell-mediated immune responses in West Nile virus (Sarafend strain) encephalitis are independent of gamma interferon. Journal of General Virology 87: 3599–3609. [DOI] [PubMed] [Google Scholar]
- 11. Shrestha B, Diamond MS (2004) Role of CD8+ T cells in control of West Nile virus infection. J Virol 78: 8312–8321. [DOI] [PMC free article] [PubMed] [Google Scholar]
- 12. Samuel MA, Diamond MS (2006) Pathogenesis of West Nile Virus Infection: a Balance between Virulence, Innate and Adaptive Immunity, and Viral Evasion. Journal of Virology 80: 9349–9360. [DOI] [PMC free article] [PubMed] [Google Scholar]
- 13. Suthar MS, Diamond MS, Gale M Jr (2013) West Nile virus infection and immunity. Nat Rev Micro 11: 115–128. [DOI] [PubMed] [Google Scholar]
- 14. Diamond MS, Shrestha B, Marri A, Mahan D, Engle M (2003) B Cells and Antibody Play Critical Roles in the Immediate Defense of Disseminated Infection by West Nile Encephalitis Virus. Journal of Virology 77: 2578–2586. [DOI] [PMC free article] [PubMed] [Google Scholar]
- 15. Wang Y, Lobigs M, Lee E, Maullbacher A (2003) CD8+ T Cells Mediate Recovery and Immunopathology in West Nile Virus Encephalitis. Journal of Virology 77: 13323–13334. [DOI] [PMC free article] [PubMed] [Google Scholar]
- 16. Mehlhop E, Whitby K, Oliphant T, Marri A, Engle M, et al. (2005) Complement Activation Is Required for Induction of a Protective Antibody Response against West Nile Virus Infection. Journal of Virology 79: 7466–7477. [DOI] [PMC free article] [PubMed] [Google Scholar]
- 17. Samuel MA, Diamond MS (2005) Alpha/Beta Interferon Protects against Lethal West Nile Virus Infection by Restricting Cellular Tropism and Enhancing Neuronal Survival. Journal of Virology 79: 13350–13361. [DOI] [PMC free article] [PubMed] [Google Scholar]
- 18. Mehlhop E, Diamond MS (2006) Protective immune responses against West Nile virus are primed by distinct complement activation pathways. The Journal of Experimental Medicine 203: 1371–1381. [DOI] [PMC free article] [PubMed] [Google Scholar]
- 19. Beasley DWC, Li L, Suderman MT, Barrett ADT (2002) Mouse Neuroinvasive Phenotype of West Nile Virus Strains Varies Depending upon Virus Genotype. Virology 296: 17–23. [DOI] [PubMed] [Google Scholar]
- 20. Beasley DWC, Whiteman MC, Zhang S, Huang CYH, Schneider BS, et al. (2005) Envelope Protein Glycosylation Status Influences Mouse Neuroinvasion Phenotype of Genetic Lineage 1 West Nile Virus Strains. Journal of Virology 79: 8339–8347. [DOI] [PMC free article] [PubMed] [Google Scholar]
- 21. Seregin A, Nistler R, Borisevich V, Yamshchikov G, Chaporgina E, et al. (2006) Immunogenicity of West Nile virus infectious DNA and its noninfectious derivatives. Virology 356: 115–125. [DOI] [PubMed] [Google Scholar]
- 22. Yu L, Robert Putnak J, Pletnev AG, Markoff L (2008) Attenuated West Nile viruses bearing 3′SL and envelope gene substitution mutations. Vaccine 26: 5981–5988. [DOI] [PubMed] [Google Scholar]
- 23. Zhang S, Vogt MR, Oliphant T, Engle M, Bovshik EI, et al. (2009) Development of Resistance to Passive Therapy with a Potently Neutralizing Humanized Monoclonal Antibody against West Nile Virus. Journal of Infectious Diseases 200: 202–205. [DOI] [PMC free article] [PubMed] [Google Scholar]
- 24. Koh WL, Ng ML (2005) Molecular mechanisms of West Nile virus pathogenesis in brain cell. Emerg Infect Dis 11: 629–632. [DOI] [PMC free article] [PubMed] [Google Scholar]
- 25. Munoz-Erazo L, Natoli R, Provis JM, Madigan MC, King NJ (2012) Microarray analysis of gene expression in West Nile virus-infected human retinal pigment epithelium. Mol Vis 18: 730–743. [PMC free article] [PubMed] [Google Scholar]
- 26. Fredericksen BL, Smith M, Katze MG, Shi PY, Gale M Jr (2004) The host response to West Nile Virus infection limits viral spread through the activation of the interferon regulatory factor 3 pathway. J Virol 78: 7737–7747. [DOI] [PMC free article] [PubMed] [Google Scholar]
- 27. Scherbik SV, Stockman BM, Brinton MA (2007) Differential expression of interferon (IFN) regulatory factors and IFN-stimulated genes at early times after West Nile virus infection of mouse embryo fibroblasts. J Virol 81: 12005–12018. [DOI] [PMC free article] [PubMed] [Google Scholar]
- 28. Fredericksen BL, Keller BC, Fornek J, Katze MG, Gale M Jr (2008) Establishment and maintenance of the innate antiviral response to West Nile Virus involves both RIG-I and MDA5 signaling through IPS-1. J Virol 82: 609–616. [DOI] [PMC free article] [PubMed] [Google Scholar]
- 29. Cho H, Diamond M (2013) Immune Responses to West Nile Virus Infection in the Central Nervous System. Viruses 4: 3812–3830. [DOI] [PMC free article] [PubMed] [Google Scholar]
- 30. Venter M, Myers TG, Wilson MA, Kindt TJ, Paweska JT, et al. (2005) Gene expression in mice infected with West Nile virus strains of different neurovirulence. Virology 342: 119–140. [DOI] [PubMed] [Google Scholar]
- 31. Suthar MS, Brassil MM, Blahnik G, McMillan A, Ramos HJ, et al. (2013) A Systems Biology Approach Reveals that Tissue Tropism to West Nile Virus Is Regulated by Antiviral Genes and Innate Immune Cellular Processes. PLoS Pathog 9: e1003168. [DOI] [PMC free article] [PubMed] [Google Scholar]
- 32. Geiss GK, Bumgarner RE, Birditt B, Dahl T, Dowidar N, et al. (2008) Direct multiplexed measurement of gene expression with color-coded probe pairs. Nat Biotechnol 26: 317–325. [DOI] [PubMed] [Google Scholar]
- 33. Kasturi J, Acharya R, Ramanathan M (2003) An information theoretic approach for analyzing temporal patterns of gene expression. Bioinformatics 19: 449–458. [DOI] [PubMed] [Google Scholar]
- 34. Huang da W, Sherman BT, Lempicki RA (2009) Systematic and integrative analysis of large gene lists using DAVID bioinformatics resources. Nat Protoc 4: 44–57. [DOI] [PubMed] [Google Scholar]
- 35. Huang da W, Sherman BT, Lempicki RA (2009) Bioinformatics enrichment tools: paths toward the comprehensive functional analysis of large gene lists. Nucleic Acids Res 37: 1–13. [DOI] [PMC free article] [PubMed] [Google Scholar]
- 36. Jensen LJ, Kuhn M, Stark M, Chaffron S, Creevey C, et al. (2009) STRING 8–a global view on proteins and their functional interactions in 630 organisms. Nucleic Acids Res 37: D412–416. [DOI] [PMC free article] [PubMed] [Google Scholar]
- 37. Shirato K, Kimura T, Mizutani T, Kariwa H, Takashima I (2004) Different chemokine expression in lethal and non-lethal murine west nile virus infection. Journal of Medical Virology 74: 507–513. [DOI] [PubMed] [Google Scholar]
- 38. Klein RS, Lin E, Zhang B, Luster AD, Tollett J, et al. (2005) Neuronal CXCL10 Directs CD8+ T-Cell Recruitment and Control of West Nile Virus Encephalitis. Journal of Virology 79: 11457–11466. [DOI] [PMC free article] [PubMed] [Google Scholar]
- 39. Zhang B, Chan YK, Lu B, Diamond MS, Klein RS (2008) CXCR3 Mediates Region-Specific Antiviral T Cell Trafficking within the Central Nervous System during West Nile Virus Encephalitis. The Journal of Immunology 180: 2641–2649. [DOI] [PubMed] [Google Scholar]
- 40. Town T, Bai F, Wang T, Kaplan AT, Qian F, et al. (2009) Toll-like receptor 7 mitigates lethal West Nile encephalitis via interleukin 23-dependent immune cell infiltration and homing. Immunity 30: 242–253. [DOI] [PMC free article] [PubMed] [Google Scholar]
- 41. Glass WG, Lim JK, Cholera R, Pletnev AG, Gao J-L, et al. (2005) Chemokine receptor CCR5 promotes leukocyte trafficking to the brain and survival in West Nile virus infection. The Journal of Experimental Medicine 202: 1087–1098. [DOI] [PMC free article] [PubMed] [Google Scholar]
- 42. Glass WG, McDermott DH, Lim JK, Lekhong S, Yu SF, et al. (2006) CCR5 deficiency increases risk of symptomatic West Nile virus infection. J Exp Med 203: 35–40. [DOI] [PMC free article] [PubMed] [Google Scholar]
- 43. Bardina SV, Lim JK (2012) The role of chemokines in the pathogenesis of neurotropic flaviviruses. Immunol Res 54: 121–132. [DOI] [PubMed] [Google Scholar]
- 44. Morrey JD, Siddharthan V, Wang H, Hall JO (2012) Respiratory Insufficiency Correlated Strongly with Mortality of Rodents Infected with West Nile Virus. PLoS ONE 7: e38672. [DOI] [PMC free article] [PubMed] [Google Scholar]
- 45. Wang T, Town T, Alexopoulou L, Anderson JF, Fikrig E, et al. (2004) Toll-like receptor 3 mediates West Nile virus entry into the brain causing lethal encephalitis. Nat Med 10: 1366–1373. [DOI] [PubMed] [Google Scholar]
- 46. Daffis S, Samuel MA, Suthar MS, Gale M Jr, Diamond MS (2008) Toll-like receptor 3 has a protective role against West Nile virus infection. J Virol 82: 10349–10358. [DOI] [PMC free article] [PubMed] [Google Scholar]
- 47. Szretter KJ, Daffis S, Patel J, Suthar MS, Klein RS, et al. (2010) The innate immune adaptor molecule MyD88 restricts West Nile virus replication and spread in neurons of the central nervous system. J Virol 84: 12125–12138. [DOI] [PMC free article] [PubMed] [Google Scholar]
- 48. Bieback K, Lien E, Klagge IM, Avota E, Schneider-Schaulies J, et al. (2002) Hemagglutinin protein of wild-type measles virus activates toll-like receptor 2 signaling. J Virol 76: 8729–8736. [DOI] [PMC free article] [PubMed] [Google Scholar]
- 49. Dolganiuc A, Oak S, Kodys K, Golenbock DT, Finberg RW, et al. (2004) Hepatitis C core and nonstructural 3 proteins trigger toll-like receptor 2-mediated pathways and inflammatory activation. Gastroenterology 127: 1513–1524. [DOI] [PubMed] [Google Scholar]
- 50. Zhou S, Kurt-Jones EA, Mandell L, Cerny A, Chan M, et al. (2005) MyD88 is critical for the development of innate and adaptive immunity during acute lymphocytic choriomeningitis virus infection. Eur J Immunol 35: 822–830. [DOI] [PubMed] [Google Scholar]
- 51. Zhou S, Halle A, Kurt-Jones EA, Cerny AM, Porpiglia E, et al. (2008) Lymphocytic choriomeningitis virus (LCMV) infection of CNS glial cells results in TLR2-MyD88/Mal-dependent inflammatory responses. J Neuroimmunol 194: 70–82. [DOI] [PMC free article] [PubMed] [Google Scholar]
- 52. Kurt-Jones EA, Chan M, Zhou S, Wang J, Reed G, et al. (2004) Herpes simplex virus 1 interaction with Toll-like receptor 2 contributes to lethal encephalitis. Proc Natl Acad Sci U S A 101: 1315–1320. [DOI] [PMC free article] [PubMed] [Google Scholar]
- 53. Tuvim MJ, Gilbert BE, Dickey BF, Evans SE (2012) Synergistic TLR2/6 and TLR9 activation protects mice against lethal influenza pneumonia. PLoS One 7: e30596. [DOI] [PMC free article] [PubMed] [Google Scholar]
- 54. Bai F, Kong KF, Dai J, Qian F, Zhang L, et al. (2010) A paradoxical role for neutrophils in the pathogenesis of West Nile virus. J Infect Dis 202: 1804–1812. [DOI] [PMC free article] [PubMed] [Google Scholar]
- 55. Anders H-J, Vielhauer V, Schlondorff D (2003) Chemokines and chemokine receptors are involved in the resolution or progression of renal disease. Kidney Int 63: 401–415. [DOI] [PubMed] [Google Scholar]
- 56. Tobler LH, Cameron MJ, Lanteri MC, Prince HE, Danesh A, et al. (2008) Interferon and interferon-induced chemokine expression is associated with control of acute viremia in West Nile virus-infected blood donors. J Infect Dis 198: 979–983. [DOI] [PMC free article] [PubMed] [Google Scholar]
- 57. Qian F, Chung L, Zheng W, Bruno V, Alexander RP, et al. (2013) Identification of genes critical for resistance to infection by West Nile virus using RNA-Seq analysis. Viruses 5: 1664–1681. [DOI] [PMC free article] [PubMed] [Google Scholar]
- 58. Carty M, Reinert L, Paludan SR, Bowie AG (2014) Innate antiviral signalling in the central nervous system. Trends Immunol 35: 79–87. [DOI] [PubMed] [Google Scholar]
- 59. Fredericksen BL (2014) The neuroimmune response to West Nile virus. J Neurovirol 20: 113–121. [DOI] [PMC free article] [PubMed] [Google Scholar]
- 60. Diamond MS, Gale M Jr (2012) Cell-intrinsic innate immune control of West Nile virus infection. Trends Immunol 33: 522–530. [DOI] [PMC free article] [PubMed] [Google Scholar]
- 61. Quicke KM, Suthar MS (2013) The innate immune playbook for restricting West Nile virus infection. Viruses 5: 2643–2658. [DOI] [PMC free article] [PubMed] [Google Scholar]
Associated Data
This section collects any data citations, data availability statements, or supplementary materials included in this article.
Supplementary Materials
Volcano plot of changes in Gene Expression in WNV infected SW outbred Mice. Gene expression profiles for spleen, lung, liver, kidney and brain were analyzed over the course on infection. Changes in gene expression profiles for each tissue was plotted on the Y-axis based on statistical significance in reverse order and fold change (log2) was plotted on the X-axis. Data points represent n = 3 mice per day, p<0.05 considered statistically significant.
(TIFF)
Protein-protein interaction networks identified for all differentially expressed genes in (A) spleen, (B) kidney, (C) lung, (D) liver, and (E) brain using the search tool for the retrieval of interacting genes/proteins (STRING). Confidence view of protein-protein interaction network from DEGs from the liver of WNV infected SW mice. Network clustering was performed with Kmeans = 5. The thickness of the blue line connecting genes and nodes indicates the confidence score of association identified.
(SVG)
Confidence view of cytokine-cytokine receptor interactions in the lung protein-protein interaction network of WNV-infected SW mice. Network clustering was performed with Kmeans = 2. The thickness of the blue line connecting genes and nodes indicates the confidence score of association identified.
(TIF)
Confidence view of cytokine-cytokine receptor interactions in the liver protein-protein interaction network of WNV-infected SW mice. Network clustering was performed with Kmeans = 2. The thickness of the blue line connecting genes and nodes indicates the confidence score of association identified.
(TIF)
Confidence view of cytokine-cytokine receptor interactions in the spleen protein-protein interaction network of WNV-infected SW mice. Network clustering was performed with Kmeans = 2. The thickness of the blue line connecting genes and nodes indicates the confidence score of association identified.
(TIF)
Confidence view of cytokine-cytokine receptor interactions in the kidney protein-protein interaction network of WNV-infected SW mice. Network clustering was performed with Kmeans = 2. The thickness of the blue line connecting genes and nodes indicates the confidence score of association identified.
(TIF)
Confidence view of Toll-like receptor signaling pathways interactions in the lung protein-protein interaction network of WNV-infected SW mice. Network clustering was performed with Kmeans = 2. The thickness of the blue line connecting genes and nodes indicates the confidence score of association identified.
(TIF)
Confidence view of Toll-like receptor signaling pathways interactions in the spleen protein-protein interaction network of WNV-infected SW mice. Network clustering was performed with Kmeans = 2. The thickness of the blue line connecting genes and nodes indicates the confidence score of association identified.
(TIF)
Confidence view of complement and coagulation cascade interactions in the liver protein-protein interaction network of WNV-infected SW mice. Network clustering was performed with Kmeans = 2. The thickness of the blue line connecting genes and nodes indicates the confidence score of association identified.
(TIF)
Confidence view of JAK-STAT signaling pathway interactions in the kidney protein-protein interaction network of WNV-infected SW mice. Network clustering was performed with Kmeans = 2. The thickness of the blue line connecting genes and nodes indicates the confidence score of association identified.
(TIF)
List of genes for which mRNA was quantitated using the Nanostring nCounter system in this study with corresponding accession numbers.
(PDF)
Data Availability Statement
The authors confirm that all data underlying the findings are fully available without restriction. They are contained in the manuscript.


