

Background: AlkB is an iron/2-oxoglutarate dioxygenase that repairs alkylated DNA.
Results: Enzymological and biophysical methods are used to develop a quantitative mechanistic scheme.
Conclusion: A conformational transition controls the order of substrate binding and the coupling of the two sequential sub-reactions catalyzed by AlkB.
Significance: These results provide a striking example of the importance of protein dynamics for efficient catalysis of a multistep reaction.
Keywords: DNA Repair, Enzyme Mechanism, Nuclear Magnetic Resonance (NMR), Protein Dynamic, X-ray Crystallography, AlkB, Fe-2OG Dioxygenase, Catalytic Efficiency, Fluorescence Spectroscopy
Abstract
A central goal of enzymology is to understand the physicochemical mechanisms that enable proteins to catalyze complex chemical reactions with high efficiency. Recent methodological advances enable the contribution of protein dynamics to enzyme efficiency to be explored more deeply. Here, we utilize enzymological and biophysical studies, including NMR measurements of conformational dynamics, to develop a quantitative mechanistic scheme for the DNA repair enzyme AlkB. Like other iron/2-oxoglutarate-dependent dioxygenases, AlkB employs a two-step mechanism in which oxidation of 2-oxoglutarate generates a highly reactive enzyme-bound oxyferryl intermediate that, in the case of AlkB, slowly hydroxylates an alkylated nucleobase. Our results demonstrate that a microsecond-to-millisecond time scale conformational transition facilitates the proper sequential order of substrate binding to AlkB. Mutations altering the dynamics of this transition allow generation of the oxyferryl intermediate but promote its premature quenching by solvent, which uncouples 2-oxoglutarate turnover from nucleobase oxidation. Therefore, efficient catalysis by AlkB depends upon the dynamics of a specific conformational transition, establishing another paradigm for the control of enzyme function by protein dynamics.
Introduction
Fe(II)/2-oxoglutarate (2OG)4-dependent dioxygenases represent the largest superfamily of non-heme iron enzymes catalyzing oxidation of bioorganic substrates by molecular oxygen (O2) (1–3). Humans encode at least 24 superfamily members (4) involved in processes as diverse as O2-sensing, epigenetic regulation of transcription, and tissue vascularization (5). Nine belong to the AlkB family (4, 6–8), which is named after an Escherichia coli enzyme (EC 1.14.11.33, Fig. 1) that directly repairs the damage to DNA/RNA bases caused by a variety of SN2-alkylating agents, including methyl methanesulfonate, dimethyl sulfate, and methyl halides (9–13). Hydroxylation of alkyl lesions by AlkB-family enzymes produces an unstable adduct that spontaneously hydrolyzes after release from the enzyme to regenerate the unmodified base (Fig. 1A) (14).
FIGURE 1.

A conformational transition in the NRL of E. coli AlkB controls the catalytic reaction cycle. A, one reaction catalyzed by AlkB. B, ribbon diagram showing the crystal structure of AlkB-ΔN11 with bound Fe(II) (orange), 2OG (blue), and 5′-TmAT-3′ (yellow) (PDB code 2FD8). The Fe(II)/2OG core and NRL are colored cyan and red, respectively, and the residues used as spectroscopic probes are shown in space-filling representation (Trp-69, -89, and -178 in magenta, Met-49, -57, -61, and -92 in darker green, and Leu-99 and Ile-119 in lighter green). C, diagram colored equivalently to B schematizing the two-state conformational transition controlling enzyme activity. Backbone amide hydrogen-deuterium exchange data in the presence and absence of DNA were reported previously (23). D, catalytic mechanism and dissociation/rate constants at 10 °C. The two alternative reaction pathways (lower right) produce 2OG turnover coupled to (left branch) or uncoupled from (right branch) DNA repair, depending on the relative rates of substrate hydroxylation versus release. Kd values come from Fig. 3, conformational transition rate constants from Fig. 5, and catalytic rate constants from Fig. 13 and Yu and Hunt (31). Dissociation constants were calculated as described under “Experimental Procedures.” The upper limit for the rate of 2OG oxidation is the maximum observed rate of 2OG turnover (Table 4), and methylated nucleobase oxidation rates are equal to kcat (31). The equivalence of kcat for trimer and pentamer substrates with the same alkylated base (31), despite trimer being released ∼50-fold faster (Fig. 13, D and E), suggests that product release is not rate-limiting. The inference that nucleobase oxidation by the oxyferryl intermediate (i.e. quantum chemistry) is rate-limiting is supported by the equivalence of the observed catalytic but not conformational rate constants at 10 and 37 °C (Tables 1 and 4).
Extensive kinetic and spectroscopic studies have demonstrated that Fe(II)/2OG dioxygenases face a series of mechanistic challenges in achieving efficient catalysis (15–22). These enzymes catalyze similar multistep reactions in which the Fe(II) cofactor and 2OG co-substrate activate O2 for hydroxylation of a bioorganic substrate, an alkylated nucleobase in the case of AlkB (12, 13). This so-called “primary substrate” occludes the binding sites for Fe(II) and 2OG in available crystal structures (as shown for AlkB in Fig. 1B (23)), consistent with the conclusion from kinetic studies (24–26) that the enzymes bind the various cofactor and substrates sequentially, with the primary substrate binding only after both Fe(II) and 2OG (Fig. 1A). Subsequent binding of O2 to the Fe(II) cofactor triggers relatively rapid decarboxylation of 2OG to generate carbon dioxide (CO2), succinate (Suc), and a reactive oxyferryl (Fe(IV)=O) intermediate (16, 27–29) that slowly hydroxylates the nucleobase substrate (21, 22). This long lived oxyferryl intermediate must remain tightly sequestered in the active site to avoid reaction with oxidizable compounds in the buffer (solvent-quenching), which results in uncoupled 2OG turnover (12, 13, 30) and release of toxic reactive oxygen species. Several mechanistic features contribute to the very slow occurrence of these adventitious processes in well characterized Fe(II)/2OG dioxygenases (26). First, O2 does not bind to Fe(II) efficiently until after the binding of the primary substrate (23, 31). Second, the release rate of the unreacted primary substrate must be slower than its hydroxylation rate by the oxyferryl intermediate. However, overly slow release of the hydroxylated product would impair catalytic efficiency. Therefore, substrate/product release kinetics must be tuned to optimize the catalytic efficiency of Fe(II)/2OG dioxygenases.
Although kinetic and spectroscopic studies have identified these mechanistic challenges, little information is available on the biophysical mechanisms employed by Fe(II)/2OG dioxygenases to surmount them. Significant ligand-dependent protein conformational changes have been observed in several Fe(II)/2OG dioxygenases, including AlkB (32), as well as in some homologous halogenases for which crystal structures have been solved in open or closed conformations depending on 2OG binding (33, 34). Changes in resonance frequencies and line shapes in 1H one-dimensional and 1H–15N two-dimensional NMR spectra also suggest that the conformational dynamics of AlkB are ligand-dependent (32, 35), and these data have been interpreted to reflect increased backbone dynamics that serve to accelerate ligand release from the enzyme upon oxidation of 2OG to Suc. However, given the slow reaction rate of the oxyferryl intermediate generated in parallel with Suc, such accelerated ligand release would be expected to promote quenching of the oxyferryl intermediate (due to premature release of the primary substrate) and adventitious release of reactive oxygen species.
In this study, we explicitly verify that enhanced conformational dynamics in AlkB can increase turnover of the 2OG co-substrate uncoupled from hydroxylation/repair of the primary substrate. Furthermore, we establish a quantitative mechanistic description of the catalytic cycle of AlkB. A key feature of this mechanism is a specific conformational transition in E. coli AlkB that simultaneously controls both the proper order of substrate binding and the kinetics of sequestration of the enzyme-bound oxyferryl intermediate (Fig. 1, C and D). Sophisticated biophysical methods have been used to demonstrate that protein dynamics play an important role in controlling substrate binding and product release in some enzymes (36–45). The results reported in this paper demonstrate that protein dynamics can also control the coupling of sequential sub-reactions in a multistep enzyme-bound reaction sequence. Our results provide a striking example of the importance of protein dynamics for efficient catalysis of a complex chemical reaction.
EXPERIMENTAL PROCEDURES
Overview of Experimental Conditions
Enzymological, fluorescence, and circular dichroism experiments were conducted in 1H2O buffer containing 75 mm KCl and either 10 mm Tris-Cl or 20–50 mm Na-HEPES at pH 7.6 (23, 31). NMR experiments were conducted in 99% 2H2O buffer containing 75 mm KCl and either 50 mm NaH2PO4 at pD 5.5 or 50 mm Na-HEPES-d12 at pD 7.6. Calibration experiments demonstrate that E. coli AlkB exhibits similar turnover rates, similar affinities for the 2OG co-substrate and the alkylated DNA substrate (Table 1), and essentially equivalent 2OG/DNA coupling ratios in the deuterated acidic buffer used for most of the NMR experiments and the neutral pH buffer used for most other experiments (data not shown). Some experiments employed Mn(II) as a redox-inactive analog of Fe(II), whereas others, including all NMR experiments, employed Zn(II) instead because it is diamagnetic and therefore does not interfere with NMR measurements. Measurements of thermal stability in the presence and absence of 2OG demonstrate that these three divalent cations interact with E. coli AlkB with roughly similar affinities but that Zn(II) produces somewhat greater thermal stabilization of the enzyme than Fe(II) or Mn(II) (data not shown). In general, buffers and reagent solutions were passed through uncharged Profinity IMAC resin (Bio-Rad) to remove trace metal ions. Mechanistic characterization focused on experiments at 10 °C to minimize interference from protein aggregation, which is enhanced at higher temperature. AlkB catalyzes repair of alkylated nucleobases at a similar rate at either 10 or 37 °C (data not shown), consistent with quantum mechanical processes being rate-determining in the reaction cycle (46).
TABLE 1.
Kinetic and equilibrium constants of WT and mutant AlkB-ΔN11 enzymes
Dissociation constants were obtained by intrinsic tryptophan fluorescence or fluorescence polarization anisotropy measurements. An asterisk in the protein name indicates that the first residue (preceding Gln-12 in the ΔN11 construct) is methionine rather than glycine (see “Experimental Procedures”). The entry (NMR) in the Conditions column indicates that the experiment was performed in NMR buffer, i.e. in a demetallated buffer containing 50 mm NaH2PO4, 75 mm KCl, and 99% 2H2O, pD 5.5.
| Ligand | Protein | Kd | Conditions | T | Method |
|---|---|---|---|---|---|
| μm | °C | ||||
| 2OG | WT | 0.3 ± 0.1 | + Mn(II) | 10 | Tryptophan fluorescence |
| W69Y/W178Y* | 0.9 ± 0.2 | ||||
| W89Y | 5.9 ± 1.3 | ||||
| M61L | 0.6 ± 0.1 | ||||
| WT | 0.5 ± 0.1 | + Zn(II) (NMR) | |||
| Suc | WT | 57 ± 14 | + Mn(II) | ||
| W69Y/W178Y* | 74 ± 19 | ||||
| WT | 90 ± 5 | + Zn(II) (NMR) | |||
| 5′-CAmCAT-3′ | WT | 0.3 ± 0.1 | + Mn(II) + 2OG | ||
| 0.6 ± 0.1 | + Mn(II) + Suc | ||||
| 4.5 ± 1.3 | + EDTA | ||||
| 0.04 ± 0.02 | + Zn(II) + 2OG (NMR) | ||||
| 0.06 ± 0.04 | + Zn(II) + Suc (NMR) | ||||
| 5′-CACAT-3′ | WT | 26.0 ± 6.0 | + Mn(II) + 2OG | ||
| 5′-CAmCAT-3′ | WT | 0.1 ± 0.01 | + Mn(II) + 2OG | Fluorescence anisotropy | |
| 1.8 ± 0.3 | + Mn(II) | ||||
| 2.2 ± 0.4 | + 2OG + EDTA | ||||
| 9.6 ± 1.5 | + EDTA | ||||
| 0.030 ± 0.003 | + Mn(II) + Suc | ||||
| 5′-CACAT-3′ | WT | 29.6 ± 2.3 | + Mn(II) + Suc | ||
| 2OG | WT* | 4.1 ± 0.6 | + Mn(II) | 24 | Tryptophan fluorescence |
| W69Y* | 4.1 ± 0.8 | ||||
| W89Y* | 34.2 ± 4.8 | ||||
| W178Y* | 16.6 ± 2.5 | ||||
| W69Y/W178Y* | 44.1 ± 5.2 |
Synthetic DNA Substrates and Other Reagents
The DNA oligonucleotides 5′-dC-dA-(3-me-dC)-dA-dT-3′, 5′-dC-dA-(1-me-dA)-dA-dT-3′, and 5′-dT-(1-me-dA)-dT-3′ are abbreviated as 5′-CAmCAT-3′, 5′-CAmAAT-3′, 5′-TmAT-3′, respectively; they were purchased from The Midland Certified Reagent Co., Inc. (Midland, TX). N1-Methyladenosine-5′-triphosphate ribonucleotide (mA) was purchased from TriLink BioTechnologies, Inc. (San Diego). 6-Carboxyfluorescein (6-FAM), which was covalently attached to the 3′ end of the fluorescent DNA oligonucleotides, was used for binding experiments. The compounds 2H2O (99% 2H), 13Cϵ-l-methionine (99% 13C), [2H]glucose (98% 2H), and Na-HEPES-d12 (98% 2H) were purchased from Cambridge Isotope Laboratories, Inc. (Andover, MA).
Cloning and Site-directed Mutagenesis
PCR cloning was used to insert a TEV protease recognition sequence (ENLYFQG) after the start codon of AlkB-ΔN11, which has the first 11 N-terminal amino acids of the native E. coli protein removed (23). Following amplification of a construct of the truncated protein containing a C-terminal TEV-cleavable hexahistidine tag, the resulting PCR product was cloned into the NdeI and XhoI restriction sites in plasmid pET28b to yield a protein construct with TEV-cleavable hexahistidine tags at both its N and C termini. Cleavage of this construct with TEV protease yields an AlkB-ΔN11 protein differing from the previously studied construct (23) only in the substitution of a glycine residue for the methionine at the N terminus (i.e. the single residue preceding Gln-12 from the native E. coli protein). Most experiments in this study use this construct starting with Gly. For the small number of experiments in which the original construct was used, an asterisk has been added to the protein name in the figure labels and legends. Mutants were made using the QuikChange kit (Agilent Technologies, Santa Clara, CA).
Protein Expression and Purification
Unlabeled wild-type and mutant proteins were expressed and purified as described previously (23, 31). Proteins labeled with [13Cϵ]methionine were expressed in E. coli strain B834λ(DE3), which is auxotrophic for methionine. Cells were grown in M9 medium containing l-[13Cϵ]methionine, NH4Cl, glucose, and 1× Cellgro MEM vitamins to an A600 of 0.6–0.7 at 37 °C. Following induction with 0.8 mm IPTG, growth was continued for 18 h at 20 °C prior to purification of the protein using the published methods (23, 31). For expression and purification of the deuterated protein, every component of the M9 medium was prepared in 99% 2H2O except 1× Cellgro MEM vitamins. To increase labeling efficiency, [2H]glucose was added to the M9 medium at a 1:5 ratio to total glucose. The cells were adapted for growth in 2H2O by first inoculating them from LB into M9 medium with 50% 2H2O and then inoculating the cells grown in this medium into M9 medium with 99% 2H2O. After induction with 0.8 mm IPTG, the protein was expressed for 43 h at 20 °C prior to purification using the published methods (23, 31). AlkB-ΔN11 was then concentrated to between 500 μm and 1 mm and exchanged into the appropriate buffer (99% 2H2O buffer containing 75 mm KCl and either 50 mm NaH2PO4 at pD 5.5 or 50 mm Na-HEPES-d12 at pD 7.6). Purified protein samples were flash-frozen and stored at −80 °C.
Circular Dichroism (CD) Spectroscopy
Measurements were performed using a J-815 CD spectrometer (Jasco, Easton, MD) equipped with a PFD-425 Peltier temperature controlled cell. Wavelength scans were conducted at 50 nm/min from 205 to 300 nm on samples at 10 °C. Thermal denaturation experiments used a 5 °C/min temperature ramp and were monitored either at 217 nm from 13 to 90 °C (samples in Tris buffer) or at 230 nm from 12 to 80 °C (samples in HEPES buffer). Data from these experiments were smoothed using the Savitzky-Golay method with an 11-nm window. Experiments evaluating the effect of Mn(II) and 2OG on the wild-type (WT) enzyme were conducted in 75 mm KCl, 50 μm EDTA, 10 mm Tris-HCl, pH 7.6, whereas experiments comparing WT and mutant enzymes were conducted in 75 mm KCl, 2 mm EDTA, 20 mm Na-HEPES, pH 7.6. The enzyme displays similar binding affinities and enzymatic activities in both buffers. Experiments using Zn(II) were conducted in 99% 2H2O buffer containing 75 mm KCl, 50 μm EDTA, 50 mm sodium phosphate, pD 5.5. The Tris and phosphate buffers were demetallated using uncharged IMAC resin as described above. The concentrations of the M61L, L99M, and I119M mutants were determined via quantitative amino acid analysis following HCl hydrolysis (W. M. Keck Foundation Laboratory, Yale School of Medicine). The concentrations of the WT and W89Y enzymes were determined based on absorbance at 280 nm in 6 m guanidine hydrochloride, 20 mm sodium phosphate, pH 6.4. The extinction coefficient in this buffer was determined based on the quantitative amino acid analysis results from the M61L mutant.
Intrinsic Tryptophan Fluorescence Quenching Assays
Tryptophan fluorescence was monitored as 2OG, Suc, or DNA substrate (5′-CAmCAT-3′), or product (5′-CACAT-3′) was titrated into 0.2 μm protein in the presence of 100 μm MnCl2 at 10 °C in a PTI QuantaMaster C61 fluorimeter using excitation and emission wavelengths of 297 and 329 nm, respectively, and 5 nm slits. Titration steps were less than 30 s apart to minimize time-dependent protein aggregation at sub-saturating 2OG or Suc concentrations. Unless indicated otherwise, experiments were performed in freshly degassed 75 mm KCl, 50 mm HEPES, pH 7.6. DNA titrations were conducted in buffers containing either 2 mm EDTA or 100 μm MnCl2 and, when present, 100 μm 2OG or 2 mm Suc. The dissociation constant (Kd) for each titrant was estimated using the Levenberg-Marquardt algorithm as implemented in the program PRISM (GraphPad, San Diego) to fit the observed data to a quadratic binding Equation 1,
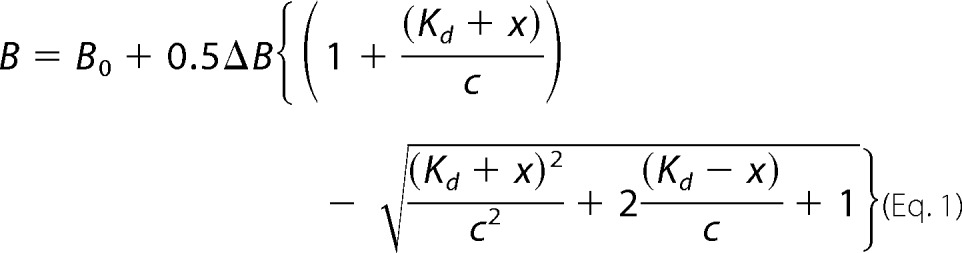 |
where B is the total fluorescence emission intensity observed at total titrant concentration x; B0 is the background intensity in the absence of the titrant; ΔB is the change in intensity at saturating concentration of the titrant; and c is the concentration of the protein.
Fluorescence Anisotropy Assays on Labeled DNA
Fluorescence polarization anisotropy was monitored using 494 and 521 nm excitation and emission wavelengths, respectively, with 5 nm slits as AlkB-ΔN11 was titrated onto a 10 nm concentration of a 6-FAM-labeled DNA oligonucleotide at 10 °C in freshly degassed 75 mm KCl, 50 mm HEPES, pH 7.6. Mn(II) was used at 20 μm, 2OG at 100 μm, and EDTA at 2 mm. Dissociation constants were determined by fitting Equation 1 above with x and c representing the total concentrations of AlkB-ΔN11 and 5′-CAmCAT-(6-FAM)-3′, respectively. Release rates were measured by adding 10 nm 5′-TmAT-FAM-3′ or 5′-CAmCAT-FAM-3′ to buffer at 10 °C containing 20 μm MnCl2 and 2 mm Suc, followed by addition of the protein and then unlabeled 5′-TmAT-3′ or 5′-CAmCAT-3′ to initiate competitive displacement. The release rate (koff) was determined by fitting these data to the exponential decay function given by Equation 2,
where Y is the observed anisotropy at time x; B is the anisotropy upon completion of DNA release; and ΔB is the difference between that value and the initial value at the start of the experiment.
NMR Spectroscopy
All buffers, protein solutions, and titrant stocks (2OG, Suc, or DNA oligonucleotide) were passed through uncharged Profinity IMAC resin (Bio-Rad) to remove trace metal ions, some of which altered the NMR spectral properties of AlkB-ΔN11 when not removed. Immediately before use, protein samples were thawed, centrifuged, and diluted to a final volume of 550 μl. Typical concentrations for WT AlkB-ΔN11 were 450 μm for relaxation experiments and 200–300 μm for other experiments. AlkB-ΔN11 methionine mutant samples (M49L, M57L, M61L, and M92L) were 100–250 μm, although W89Y was 30 μm. ZnCl2 (>99.999%, Sigma) was dissolved in 99% 2H2O to 40–200 mm before use. 2OG and Suc were dissolved in 99% 2H2O to 40–400 mm. Methylated oligonucleotide substrates (mA, 5′-TmAT-3′, and 5′-CAmAAT-3′) were dissolved in either 100% H2O or 99% 2H2O to a final concentration of 5 or 10 mm. Titrant solutions were added to NMR samples using a glass capillary. NMR spectra were acquired at 16.5, 18.8, and 21.1 T on Bruker Avance spectrometers equipped with triple resonance z axis gradient cryoprobes. Sample temperature was calibrated to 283 K using 98% [2H4]methanol (47). The 1H-13C spectra were recorded using between 16 and 512 scans per t1 increment and 1024 × 512 points for the t2 × t1 dimensions. The spectral widths were 7.0 × 7.8 kHz, 9.6 × 8.9 kHz, and 11.0 × 10.0 kHz at 16.5, 18.8, and 21.1 T, respectively. Relaxation data were collected at 21.1 T using 512 t1 increments with 16–32 scans and a t1 spectral width of 5.6 kHz. The 1H-13C single and multiple quantum correlations were measured using sensitivity-enhanced HSQC with gradient selection (48–50) or SOFAST-HMQC (51) pulse sequences. Fast time scale (picosecond to nanosecond) dynamics were measured using a 1H-1H cross-correlated relaxation experiment (52) with a relaxation delay of 2–30 ms. Double- and zero-quantum relaxation rates, RZQ and RDQ, were measured using a Hahn-echo experiment (53) with a relaxation delay of 3.91–31.2 ms.
NMR Data Analysis
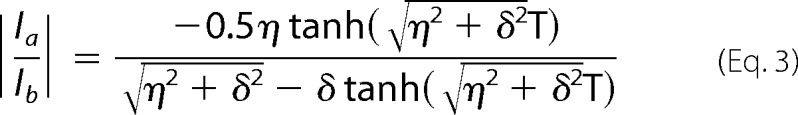
Data were processed with NMRPipe (54, 55) using exponential line broadening or a cosine bell for apodization in the t1 dimension. Assignment and extraction of peak heights were performed in Sparky (T. D. Goddard and D. G. Kneller, University of California, San Francisco). NMR spin-relaxation parameters were determined using nonlinear least squares regression with Python scripts (55–57); parameters were fit to peak heights using either a monoexponential decay (Hahn-echo) or Equation 3 (cross-correlated relaxation) (52),
 |
Residues Met-49 and Met-57 were assigned identical values for η, RZQ, and RDQ due to resonance degeneracy in the presence of Zn(II). In the case of η, the observed trend is not affected, because this value is the smallest of any Met residue over the titration. In the case of RZQ and RDQ, the value of k1 only increased by ∼25% when the values of R̄MQ and ΔRMQ determined for Met-61 in the presence of Zn(II) were substituted in the calculation.
The rate constant for transition to the closed state, k1, was determined by simultaneously fitting both R̄MQ and ΔRMQ for Met-49 to the parameters of the standard two-site exchange Equation 4,
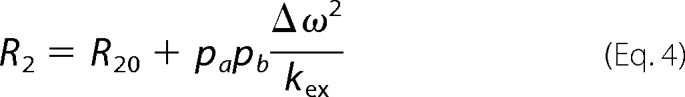 |
In Equation 4, R2 and R20 are the transverse relaxation rate constants in the presence and absence of conformational exchange, respectively. The populations of the open and closed states are pa and pb, respectively. The difference in chemical shift between these two states is represented by Δω, and the conformational exchange rate is denoted by kex, which is the sum of the opening (k−1) and closing (k1) rates. The closing rate was assumed to remain constant throughout the titration. The value of R20 was estimated using the respective relaxation rate constant, R̄MQ or ΔRMQ, determined for AlkB in the presence of DNA. The values of pa and pb were determined from 13C chemical shifts.
Assays for Coupling of 2OG Decarboxylation to DNA Demethylation
Wild-type AlkB-ΔN11 at 0.5 μm, the W89Y mutant at 1.2 μm, or the M61L mutant at 0.7 μm were incubated with 30 μm TmAT at 37 °C for 1, 5, 10, or 30 min in a standard assay buffer containing 150 μm 2OG, 75 μm Fe(NH4)2(SO4)2, 500 μm ascorbate, 150 μm sodium pyruvate, 75 mm KCl, 50 mm Na-HEPES, pH 7.6. Activity on 24 μm 5′-CAmAAT-3′ was assayed using the same conditions but with 0.2 μm WT or 0.5 μm W89Y enzyme at 1-, 5-, 10-, or 20-min time points. After quenching with 8 mm EDTA, the reactions were split to measure 2OG (300 μl) or DNA (30 μl) turnover. Samples for DNA analysis were diluted 10-fold prior to injection onto a Luna C18 column (Phenomenex Inc., Torrance, CA) run as published previously (23, 58). Samples for 2OG analysis were brought to 3% HClO4 (w/w) and then loaded onto an Aminex HPX-87H column (Bio-Rad) at 45 °C running isocratically at 0.5 ml/min in 4 mm H2SO4 on a Beckman System Gold HPLC (Beckman Coulter Inc., Indianapolis, IN). The absorbance of the effluent was monitored at 210 nm. Because the extinction coefficient of the Suc co-product is much lower than that of the 2OG co-substrate, turnover was quantified by monitoring the decrease in 2OG concentration, which was determined by normalizing its peak area to that of 150 μm pyruvate, an internal standard that is stable under the assay conditions. Peaks were integrated using Version 7.0 SP1 of Beckman's 32 Karat chromatographic software system.
Michaelis-Menten Kinetics
Wild-type AlkB-ΔN11 at 0.006 or 0.1 μm concentration was incubated at 10 °C for 2 min with varying concentrations of 5′-CAmCAT-3′ or 5′-TmAT-3′, respectively. The reaction buffer contained 75 mm KCl, 1 mm 2OG, 75 μm Fe(NH4)2(SO4)2, 2 mm ascorbate, 50 mm Na-HEPES, pH 7.6. After quenching with 8 mm EDTA, samples were loaded onto a Phenomenex (Torrance, CA) C18 column. The catalytic rate constant, kcat, and Michaelis-Menten constant, Km, were determined as described previously (23).
Calculation of Microscopic Dissociation Constants Coupled to Conformational Equilibria
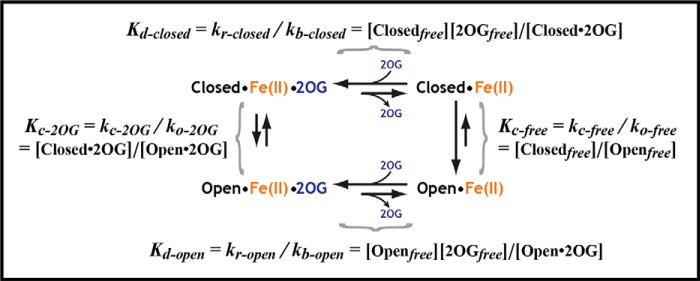
The values shown in Fig. 1D were calculated based on the model for 2OG binding shown in Scheme 1, which yields Equations 5–7 describing the relationships between the indicated microscopic dissociation constants and the observed dissociation constant for 2OG (Kd-app).
Based on the NMR analyses described in the main text, Kc-free ≈0.19 and Kc-2OG ≈1.8. The same approach was used to calculate the microscopic dissociation constants for Suc. An equivalent approach was used to calculate the microscopic dissociation constant for DNA substrate binding to the closed state of the enzyme assuming negligible binding to the open state. The free energy of binding inferred from this calculation was added to the free energy of the protein's conformational transition in the presence of 2OG to determine the free energy of DNA substrate binding to the open conformation of the enzyme with bound 2OG, and thereby the dissociation constant for this binding reaction which is given in Fig. 1D.
SCHEME 1.
RESULTS
Conformational Change in AlkB Coupled to Co-substrate (2OG) or Co-product (Suc) Binding
We used far-UV circular dichroism spectroscopy (CD) (Fig. 2) to evaluate the conformation and thermal stability of apo and ligand-bound AlkB. Our biophysical studies employed Mn(II) or Zn(II) as well established redox-inactive analogs of Fe(II) and N-terminally truncated AlkB constructs that start at residue Gln-12 in the native sequence and retain full enzyme activity (23). The CD spectrum of AlkB does not change significantly upon binding Mn(II) and 2OG (Fig. 2A). Although these observations indicate that there is not a substantial change in the net secondary-structure content of the protein, some change in local secondary structure remains possible due to complexities in the spectral properties of short β-strand structures (59). CD shows that thermal unfolding proceeds via a single transition (Fig. 2, B and D). Under the conditions of these experiments, the midpoint of this transition increases by 3 °C in the presence of the ligands, demonstrating that they thermodynamically stabilize the protein. Calorimetric studies demonstrate substantial enthalpy-entropy compensation (60, 61) upon binding the metal cofactor and also the 2OG co-substrate,5 suggesting the occurrence of a significant change in solvent interaction or protein dynamics even if there is not a substantial change in net secondary structure. The NMR studies presented below show that there is a substantial change in protein dynamics and tertiary structure coupled to 2OG binding.
FIGURE 2.

CD spectroscopy demonstrates that wild-type and mutant AlkB-ΔN11 variants are folded in the apo state. A, far-UV CD spectra collected from 1.6 μm WT enzyme at 10 °C either in the absence of ligands (black), in the presence of 200 μm MnCl2 (orange), or in the presence of 200 μm MnCl2 plus 200 μm 2OG (green). Experiments were conducted in demetallated 1H2O buffer containing 75 mm KCl, 50 μm EDTA, 10 mm Tris-HCl, pH 7.6. B, thermal denaturation of the samples from A monitored by ellipticity at 217 nm, with the corresponding traces shown in the same colors as in A. Heating at 5 °C/min was initiated shortly after spectral acquisition. C and D, equivalent spectral scans and thermal denaturation experiments to those shown in A and B, respectively, but conducted in demetallated NMR buffer (75 mm KCl, 50 μm EDTA, 50 mm sodium phosphate, pD 5.5, in 99% 2H2O) with 150 μm ZnCl2 substituted for MnCl2. The enzyme is slightly more stable and appears to have somewhat higher affinity for the divalent cation in the deuterated buffer. A minor change in the CD of the protein is observed upon cation binding in this buffer that is not observed in 1H buffer at neutral pH (A). E, thermal denaturation of 1.6 μm WT (black), W89Y (red), M61L (blue), L99M (orange), or I119M (cyan) enzymes monitored by ellipticity at 230 nm. Samples in 1H2O buffer containing 75 mm KCl, 2 mm EDTA, 20 mm HEPES, pH 7.6, were heated at 5 °C/min.
We next used intrinsic tryptophan (Trp) fluorescence emission spectroscopy (Fig. 3, A–D) to monitor local conformational changes induced by ligand binding to AlkB. The truncated protein construct used in our studies has three Trp residues (Fig. 1B). Trp-69 is located in the nucleotide-recognition lid (NRL) and makes a stacking interaction with the alkylated nucleic acid base that seals the 2OG co-substrate into the active site. Trp-89 is located at the hinge between the NRL and the dioxygenase core, whereas Trp-178 lines a solvent-filled cavity behind the catalytic Fe(II) center in the core. Trp fluorescence is strongly quenched upon addition of 2OG in the presence of Mn(II). The Suc co-product has a similar effect, although it binds with reduced affinity and quenches fluorescence to a lesser extent (Fig. 3, A and C). The NMR data presented below suggest that the difference in the quenching level in the co-substrate versus co-product complexes does not reflect a significant conformational difference but rather alterations in the electronic interactions of Trp-69 or Trp-178. Their indole groups reside within 8 Å of the metal center and that of Trp-69 also makes van der Waals contacts to two methionine residues (62), as discussed further below. The differential quenching by 2OG versus Suc is likely to derive either from alterations in the electronic properties of the respective metal-chelation complexes or from small perturbations in local stereochemistry; either effect would be expected to change the rate of fluorescence quenching via standard mechanisms, including photo-induced electron transfer and resonance energy transfer (62–66).
FIGURE 3.
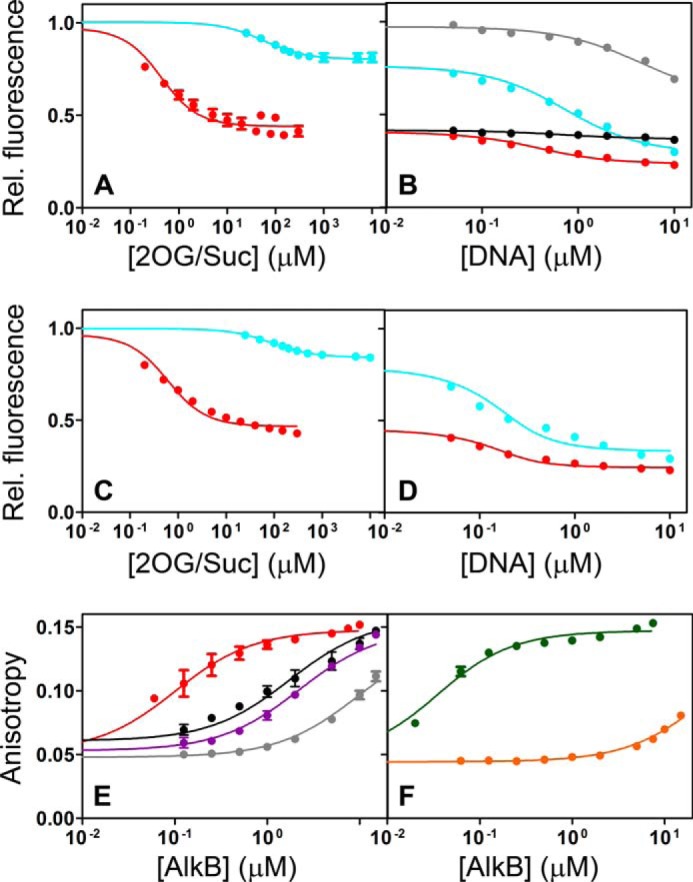
Conformational change induced by 2OG or Suc facilitates binding of alkylated DNA substrate. A–D, intrinsic Trp fluorescence assays of ligand binding to 0.2 μm AlkB-ΔN11. Titrations were conducted at 10 °C in 75 mm KCl, 50 mm Na-HEPES, pH 7.6 (A and B), or in 75 mm KCl, 50 mm sodium phosphate, pD 5.5, in 99% 2H2O (C and D). Equivalent trends are observed in the assays conducted in either buffer in these assays at 10 °C and also in assays conducted at 25 °C (Table 1). A and C show titration of 2OG co-substrate (red) or Suc co-product (cyan) in the presence of 100 μm MnCl2 (panel A) or 100 μm ZnCl2 (panel C). B shows titration with the DNA product (5′-CACAT-3′, black) in the presence of 100 μm MnCl2 and 100 μm 2OG or with the DNA substrate (5′-CAmCAT-3′) in the presence of 100 μm MnCl2 and either 100 μm 2OG (red), 2 mm Suc (cyan), or 2 mm EDTA (gray, in Mn(II)-free buffer). These titrations are effectively continuations of the experiments shown in panel A. D shows titration with 5′-CAmCAT-3′ in the presence of 100 μm ZnCl2 and either 100 μm 2OG (red) or 2 mm Suc (cyan). These titrations are effectively continuations of the experiments shown in panel C. E and F, fluorescence anisotropy assays of the binding of 10 nm labeled DNA substrate (5′-CAmCAT-FAM-3′) or product (5′-CACAT-FAM-3′) to WT AlkB-ΔN11. E shows titration of enzyme onto DNA substrate in the presence of 100 μm 2OG and 20 μm MnCl2 (red), in the presence of 20 μm MnCl2 alone (black), or in the absence of MnCl2 in 2 mm EDTA either in the absence (gray) or presence of 100 μm 2OG (purple). F shows titration of enzyme onto DNA substrate (green) or product (orange) in the presence of 2 mm Suc and 20 μm MnCl2. Error bars represent the standard error of the mean. Solid lines show fits to a quadratic binding equation (Equation 1 under “Experimental Procedures”).
Subsequent addition of a methylated DNA substrate (5′-CAmCAT-3′) to the AlkB complex with Mn(II) and either 2OG or Suc further quenches fluorescence to the same final level (i.e., for both the Mn(II)/2OG and Mn(II)/Suc complexes) (Fig. 3, B and D). These observations are consistent with binding of either 2OG or Suc being coupled to a conformational change in AlkB that produces an equivalent structure after binding methylated DNA substrate, as observed crystallographically (14, 23, 31).
Analyses of ligand-dependent fluorescence changes in Trp-to-Tyr mutants of AlkB (Fig. 4) demonstrate that all three Trp residues probably are quenched during the conformational transition, likely due at least in part to altered electronic interactions of Trp-69/Trp-89 with the following three proximal methionine residues (62): Met-49 and Met-57 in the NRL and Met-61 in the adjacent β-strand in the dioxygenase core. In the available crystal structures (14, 23, 31), all of which have a metal cofactor and either 2OG or Suc bound, Trp-89 is observed in the same conformation buried in the interface between the NRL and the dioxygenase core. Strong 2OG-dependent quenching of Trp-89 in the W69Y/W178Y double mutant (Fig. 4) indicates that this interface must change conformation in the apoenzyme, although without substantial alteration in the net secondary structure content of the enzyme (Fig. 2E). Furthermore, the W89Y single mutant shows ∼18-fold reduced affinity for 2OG as monitored via the conformational transition coupled to 2OG binding (Fig. 4 and Table 1), even though Trp-89 is remote from the active site of the enzyme (Fig. 1B). This observation indicates that the W89Y mutation biases the transition toward the apo conformation by ∼1.6 kcal/mol and provides further evidence for a change in the environment of Trp-89 during the transition.
FIGURE 4.
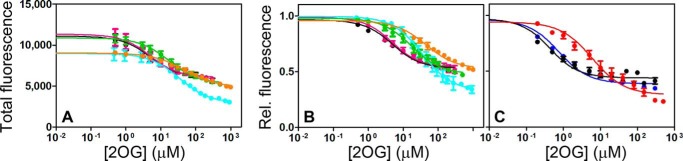
Intrinsic tryptophan fluorescence assays of ligand binding to AlkB-ΔN11 containing tryptophan-to-tyrosine mutations. A and B, total Trp fluorescence emission of concentration-normalized samples (A) and corresponding relative fluorescence emission (B) of 1.5 μm WT* (black), W69Y* (pink), W89Y* (cyan), W178Y* (green), or W69Y/W178Y* (orange) enzymes upon titration with 2OG at room temperature in 100 μm MnCl2, 100 mm NaCl, 10 mm Tris-HCl, pH 7.6. (The asterisk in the name indicates that a single Met residue precedes residue Gln-12 from E. coli AlkB, whereas a single Gly residue occurs at this location in most enzymes used in this paper; see “Experimental Procedures.”) These data demonstrate that the three Trp residues in the WT enzyme are quenched to a roughly comparable extent during the conformational transition coupled to 2OG binding, possibly reflecting the occurrence of fluorescence resonance energy transfer between these residues (which are ∼8, ∼13, and ∼20 Å apart in the closed state of the enzyme, Fig. 1B). C, relative Trp fluorescence of 0.2 μm WT (black), M61L (blue), or W89Y (red) enzymes upon titration with 2OG at 10 °C in 100 μm MnCl2, 75 mm KCl, 50 mm Na-HEPES, pH 7.6. The M61L mutation reduces 2OG binding affinity only slightly, as confirmed by NMR spectroscopy (Fig. 9), whereas the W89Y mutation reduces it by ∼20-fold at 10 °C (Table 1), presumably due primarily to destabilization of the closed state of the enzyme (Fig. 5F, inset).
2OG Binding Substantially Increases Affinity for DNA Substrate
Direct DNA binding assays monitoring fluorescence anisotropy of 5′-CAmCAT-(6-carboxyfluorescein)-3′ in the absence or presence of Mn(II)/2OG or Mn(II)/Suc (Fig. 3, E and F) demonstrate that this conformational transition increases the affinity of AlkB for the methylated DNA substrate by approximately 2 orders of magnitude (32, 67) (Table 1). Therefore, this transition controls the proper sequential order of co-substrate/substrate binding, thereby preventing premature binding of the DNA substrate from occluding the binding site for the metal cofactor and 2OG (as observed in all DNA-bound structures). The similar effects of 2OG and Suc in enhancing binding of the methylated DNA substrate prevent its premature release, an event that leads to quenching of the oxyferryl intermediate by bulk solvent instead of substrate hydroxylation (Fig. 1D). The demethylated DNA product (5′-CACAT-3′) binds to the enzyme >100-fold more weakly than the corresponding substrate, as monitored directly by fluorescence anisotropy of labeled DNA (Fig. 3F) or indirectly by protein Trp fluorescence (Fig. 3B and Table 1). The greatly increased affinity of the enzyme for alkylated substrate versus the repaired product could be influenced by the net positive charge on the methylated nucleobase (12–14, 58), but it is also likely to be influenced by the methyl substituent on the substrate (12–14, 67). Therefore, AlkB has evolved to selectively bind alkylated nucleic acid substrates following a specific conformational transition coupled to binding of the metal cofactor and 2OG co-substrate.
Co-substrate or Co-product Binding Orders Side Chains at the Interface of the NRL
To characterize this conformational transition further, given the likely alteration in the environments of the three methionine residues close to the interface of the NRL with the dioxygenase core, we used 1H-13C NMR spectroscopy of AlkB selectively labeled with [13Cϵ]methionine (Figs. 5–10). Fully protonated methionine methyl groups (13C1H3) were chosen for observation in NMR experiments over approaches involving backbone amide groups due to significantly increased sensitivity, elimination of solvent exchange artifacts, reduction of spectral crowding, and simplification of resonance assignments. The truncated AlkB construct used in our studies also contains a fourth methionine, Met-92, on the surface of the dioxygenase core (Fig. 1B). Two-dimensional 1H-13C NMR spectra were recorded after addition of Zn(II), 2OG, or Suc and methylated nucleotide substrates of varying lengths (5′-CAmAAT-3′, 5′-TmAT-3′, or methylated ATP). Zn(II) was used instead of Mn(II) to avoid paramagnetic shifts and broadening. In apo and Zn(II)-bound AlkB, the Met-49 and Met-57 resonances have chemical shifts consistent with random coil values (13C = 16.96 ppm and 1H = 2.11 ppm), and these two resonances as well as that of Met-61 are broad, indicating disorder in these side chains at the interface between the NRL and dioxygenase core (Fig. 5A). Upon addition of 2OG or Suc, the Met-49 and Met-57 resonances shift downfield in the 1H and 13C dimensions (Figs. 5A and 6, A–D), consistent with increased conformational restriction of these side chains. The line widths of Met-49, Met-57, and Met-61 remain broadened in this state (Figs. 5A and 6, A–D). These resonances and that of the nearby residue Met-61 narrow and shift further downfield upon addition of methylated nucleic acids (Figs. 5A and 6, E and F), indicating a further change in average conformation upon binding the primary substrate.
FIGURE 5.

Conformation and dynamics of the NRL as characterized by 1H-13C NMR. A, methyl-1H-13C spectra for [13Cϵ]Met AlkB-ΔN11 successively titrated with 2.0× Zn(II) (red), 10.0× 2OG co-substrate (green), and 1.5× 5′-CAmAAT-3′ substrate (blue). B, linear correlations of the Met-49 methyl-1H and 13C chemical shifts from A and from additional spectra of the enzyme saturated with the alternative substrates mA (cyan) or 5′-TmAT-3′ (TmAT, magenta). C and D, cross-correlated relaxation rate η (C), R̄MQ = (RDQ + RZQ)/2 (translucent, D), and ΔRMQ = (RDQ − RZQ)/2 (solid, D) for the [13Cϵ]Met resonances in AlkB-ΔN11, colored as in A. RZQ and RDQ represent the zero- and double-quantum relaxation rate constants, respectively. E, two-state chemical exchange model (solid lines) for R̄MQ (circles) or ΔRMQ (squares). Error bars in C–E represent the standard error of the mean calculated using the covariance of parameters from regression analysis. F, correlation of the [13Cϵ]Met chemical shifts of Met-49 (circles) or Met-57 (squares) in the WT enzyme to those in the M49L (red), M57L (blue), M61L (green), M92L (purple), or W89Y (cyan, inset) mutants. For W89Y, complexes with Suc and 5′-TmAT-3′ ligands are compared with the equivalent WT complexes. Error bars in B and F represent the standard error determined from parabolic interpolation of peak position. The slope of the linear correlation for Met-49 chemical shifts is lowest for M61L (0.80 ± 0.14 versus WT) and essentially unity for M57L (0.89 ± 0.37), and M92L (1.05 ± 0.26). All the data reported and analyzed here were collected at 10 °C in 75 mm KCl, 50 mm NaH2PO4, pD 5.5, in 2H2O.
FIGURE 6.
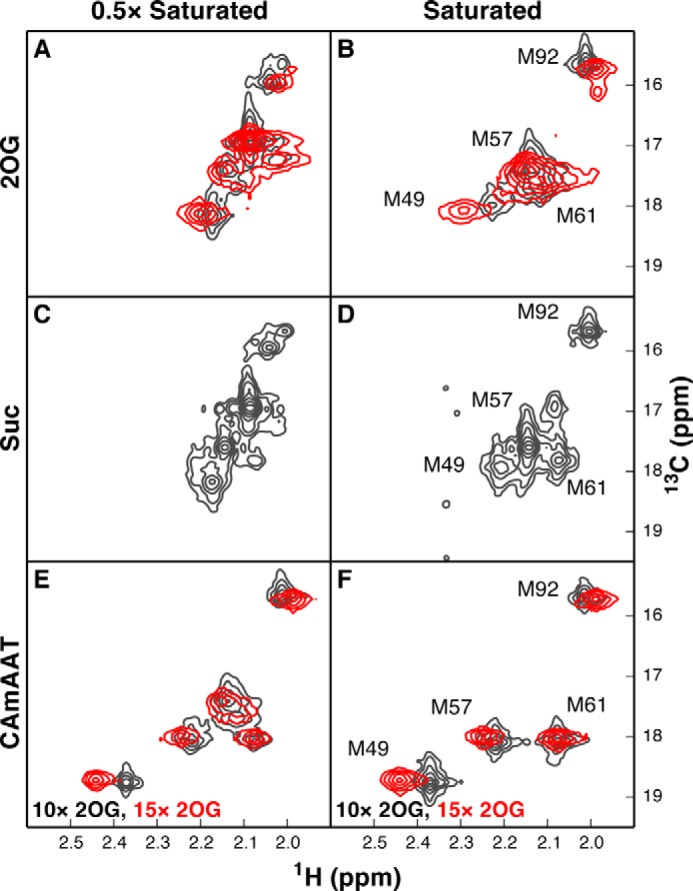
NMR spectra of partially saturated wild-type AlkB-ΔN11 indicate 2OG, Suc, and 5′-CAmAAT-3′ exchange slowly compared with the chemical shift time scale. A–D, spectra acquired at 10 °C in 75 mm KCl, 50 mm NaH2PO4, pD 5.5, in 2H2O (gray contours) or 75 mm KCl, 50 mm Na-HEPES-d12, pD 7.6, in 2H2O (red contours) in the presence of 1.5× Zn(II) and either 0.5× or 10× 2OG (A and B) or 0.5× or 10× Suc (C and D). Ligand-free and ligand-bound resonances are observed simultaneously when the enzyme is partially saturated with co-substrate or co-product, indicating that both ligands exchange slowly on the chemical-shift time scale even though the enzyme is exchanging rapidly on this time scale between the open and closed conformations of the NRL. E and F, spectra from equivalent experiments conducted under conditions of either partial (0.5×, E) or full (1.5×, F) occupancy by the 5′-CAmAAT-3′ DNA substrate, in the presence of saturating concentrations of 2OG (10× in the pD 5.5 buffer or 15× in the pD 7.6 buffer). Simultaneous observation of both substrate-free and substrate-bound resonances indicates that the DNA substrate also exchanges slowly on the chemical-shift time scale.
FIGURE 7.
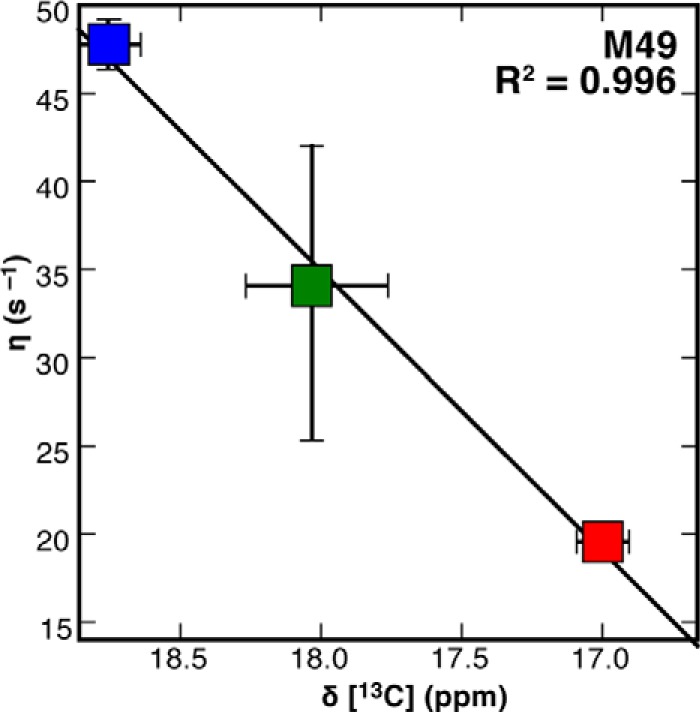
13Cϵ chemical shifts of Met-49 are consistent with the cross-correlated relaxation rate in all protein-ligand complexes. When [13Cϵ]Met AlkB-ΔN11 is successively titrated with 2.0× Zn(II) (red), 10.0× 2OG co-substrate (green), and 1.5× 5′-CAmAAT-3′ substrate (blue), the Met-49 13C chemical shifts are linearly correlated with the methyl cross-correlated relaxation rate, η, with R2 = 0.996. Horizontal error bars represent the standard error determined from parabolic interpolation of peak position, whereas vertical error bars represent the standard error of the mean calculated using the covariance of parameters from regression analysis. The vertical error bars for the Zn(II) complex are obscured by the marker.
FIGURE 8.

NMR spectra of wild-type and W89Y AlkB-ΔN11. Two-dimensional 1H-13C SOFAST HMQC spectra were acquired from WT (A–D) or W89Y (E–H) enzymes selectively labeled with [13Cϵ]methionine. Data are shown from apoenzymes (A and E), in the presence of 1.5× Zn(II) (B and F), 1.5× Zn(II), and 10× Suc (C and G) or 1.5× Zn(II), and 10× Suc and 1.5 × 5′-TmAT-3′ (D and H). Noise in the t1 dimension is caused by sample heating due to the extremely short recycle delay in combination with the sharp line shapes of the Suc and DNA substrates. Measurements were conducted at 10 °C in 75 mm KCl, 50 mm NaH2PO4, pD 5.5.
FIGURE 9.

NMR spectra of AlkB-ΔN11 containing single methionine-to-leucine mutations. The methionine-to-leucine mutations analyzed here were used to assign the resonances in the WT enzyme. Data were acquired using a 1H-13C SOFAST HMQC experiment, except for C, L, and T, which were generated using a 1H-13C HSQC experiment. Measurements were conducted at 10 °C in 75 mm KCl, 50 mm NaH2PO4, pD 5.5. The unlabeled resonances in L and T are attributable to the presence of trace metals, which have been verified not to influence assignments. All spectra from a given mutant enzyme are shown in the same color. A–E, spectra of apo WT (gray in A), M49L (red in B), M57L (blue in C), M61L (green in D), and M92L (purple in F) enzymes. F–I, spectra acquired in the presence of 1.5× Zn(II). J–N, spectra acquired in the presence of 1.5× Zn(II) and 10× 2OG. O–Q, spectra acquired in the presence of 1.5× Zn(II), 10× 2OG, and 1.5× mA. R–V, spectra acquired in the presence of 1.5× Zn(II), 10× 2OG, and 1.5× 5′-CAmAAT-3′.
FIGURE 10.

NMR spectra of the L99M and I119M mutants verify that the conformation of the Fe(II)/2OG dioxygenase core is not significantly influenced by the conformational transition in the NRL. Two-dimensional spectra of WT (A–C), L99M (D–F), or I119M (G–I) enzymes selectively labeled with [13Cϵ]methionine were collected using a 1H-13C HSQC experiment from samples at 10 °C in 75 mm KCl, 50 mm NaH2PO4, pD 5.5. Unlabeled resonances in the Zn(II)/2OG and Zn(II)/2OG/5′-CAmAAT-3′ complexes are caused by the presence of trace metals, which have been verified not to affect resonance assignments. A, D, and G, spectra of the apoenzymes shown in gray. B, E, and H, spectra of the enzymes in the presence of 1.5× Zn(II) and 10× 2OG shown in green. C, F, and I. spectra of the enzymes in the presence of 1.5× Zn(II), 10× 2OG, and 1.5× 5′-CAmAAT-3′ shown in blue.
Negligible perturbation of the 13Cϵ resonance of Met-92 is observed upon binding 2OG/DNA to the zinc-bound enzyme (Fig. 5A), consistent with minimal alteration of the dioxygenase core structure despite the ligand-dependent conformational changes in the NRL. The 13Cϵ resonance of Met-92 is split into two sharp peaks in the apoenzyme prior to collapse into a single sharp peak upon binding the metal cofactor, suggesting that this residue is found in two distinct environments in the apoenzyme that do not exchange on the microsecond time scale of the NMR measurements. This splitting is likely to be caused by local variations in protein conformation or electrostatic environment rather than heterogeneity in global backbone conformation, because a single sharp 13Cϵ resonance is observed when one additional methionine residue is inserted at buried positions Leu-99 or Ile-119 in the Fe/2OG dioxygenase core (Fig. 10). These data indicate that the core adopts a well defined conformation and are inconsistent with the suggestion that apo AlkB adopts a molten globule-like conformation. This suggestion is also inconsistent with the results of 4,4′-dianilino-1,1′-binaphthyl-5,5′-disulfonic acid titration experiments and differential scanning calorimetry experiments that fail to support the presence of a significant population of molten-globule structure in the apoenzyme.5
Substrate and Product Molecules Modulate the Same Discrete Two-state Conformational Transition
Several observations indicate that substrate/product molecules modulate the equilibrium constant for a fast transition on the NMR chemical-shift time scale between two discrete AlkB conformations. One of these is a more dynamic conformation that is dominant in the apo state, while the other is a more ordered conformation that is dominant in the 2OG/Suc/DNA-bound states (Fig. 1, C and D). We designate these conformations as “open” and “closed,” respectively, consistent with longstanding usage of these terms in the enzymology literature as well as with the NMR data reported in this paper and previously reported structural results on AlkB (23, 31). The 1H and 13C chemical shift perturbations of Met-49, which are larger than those of the other methionines, even though Met-49 makes no direct and potentially confounding contacts with substrates, are linearly correlated upon additions of 2OG or Suc and nucleic acid substrates (Fig. 5B). Similar behavior is observed for Met-57, although within a smaller range of chemical shifts. This observation is consistent with all ligands modulating the same two-state transition. Another observation supporting this inference is that 1H and 13C chemical shifts are uniformly downfield for complexes with longer versus shorter nucleic acid substrates, consistent with longer substrates stabilizing the closed conformation somewhat more than shorter substrates. In contrast, the resonance for the more distal Met-92 is minimally perturbed by ligand addition, whereas Met-61 exhibits a complex pattern of shift perturbations likely due to its close proximity to the ligands (Fig. 1B).
Importantly, partial saturation with 2OG, Suc, or nucleic acid substrate yields resolved resonances for unbound versus bound AlkB molecules (Fig. 6). This observation indicates that ligand off-rates (koff) are slow on the NMR time scale and that the observed chemical shift perturbations reflect the relative populations of the open and closed conformations of AlkB in the bound state, rather than ligand-binding kinetics. The intermediate chemical shifts of the 2OG and Suc complexes indicate that the enzyme exchanges between these two conformations rapidly on the NMR time scale in the presence of either ligand. Furthermore, the similarity of the chemical shifts when saturated with either compound indicates that 2OG and Suc stabilize the closed state of AlkB to a similar extent, which conflicts with an earlier claim (32, 35) but is consistent with the need to sequester the oxyferryl intermediate after Suc generation.
Equivalent results are observed when [13Cϵ]methionine NMR measurements are performed in the presence of partially versus fully saturating concentrations of 2OG or methylated DNA substrate either in our standard NMR buffer containing 50 mm NaH2PO4 at pD 5.5 or in an otherwise identical buffer containing 50 mm Na-HEPES-d12 at pD 7.6 (gray versus red contours in Fig. 6, A, B, E, and F). Therefore, the ligand-dependent conformational dynamics of AlkB are similar in both buffers, consistent with the comparable ligand-binding affinities (Table 1) and enzymological parameters (data not shown) of the enzyme in the two environments.
The picosecond-to-nanosecond time scale dynamics of [13Cϵ]Met residues were quantified via the 1H-1H cross-correlated relaxation interference rate constant, η ∝ S2 × τC, with S2 being the generalized order parameter of the methyl symmetry axis and τC being the protein rotational correlation time (52). Values of η are low for the Met residues in and near the NRL of AlkB in the apo/open state, confirming that these side chains are disordered, but their η values increase upon ligand addition (Fig. 5C and Table 2). Values of η for Met-49 are linearly correlated with 13C chemical shifts in the Zn(II), 2OG, and 5′-CAmAAT-3′ complexes (R2 = 0.996, Fig. 7), consistent with reduction in its mobility in the closed conformation. With methylated DNA substrate bound, the more interior residues Met-57 and Met-61 have similar η values to Met-92, which is relatively ordered in all states.
TABLE 2.
Fast time scale dynamics for AlkB-ΔN11 with Zn(II), 2OG, and 5′-CAmAAT-3′
η and δ (Equation 3) were determined using the 1H-1H CCR experiment (52). As discussed in the text, increasing values of η indicate a reduction of motion on the picosecond to nanosecond time scale. Relaxation of the 1H methyl signal by remote 1H spins is measured by δ, in which more negative values indicate increasing relaxation. Saturating concentrations of each titrant were added in succession to the previous complex; thus, 2OG indicates AlkB-ΔN11 in the presence of both Zn(II) and 2OG.
| Ligand | Met-49 | Met-57 | Met-61 | Met-92 | |
|---|---|---|---|---|---|
| η (s−1) | Zn(II) | 19.6 ± 0.5 | 19.6 ± 0.5 | 24.4 ± 1.7 | 54.0 ± 2.9 |
| 2OG | 34.1 ± 8.7 | 40.3 ± 1.4 | 46.1 ± 1.0 | 64.6 ± 3.5 | |
| 5′-CAmAAT-3′ | 47.8 ± 1.4 | 88.9 ± 11.0 | 80.6 ± 6.6 | 69.8 ± 7.5 | |
| δ (s−1) | Zn(II) | −8.0 ± 0.9 | −8.0 ± 0.9 | −13.1 ± 2.9 | −56.8 ± 4.2 |
| 2OG | −3.5 ± 9.1 | −9.5 ± 1.3 | −10.0 ± 0.9 | −38.7 ± 3.5 | |
| 5′-CAmAAT-3′ | −24.0 ± 1.5 | −91.0 ± 14.8 | −63.0 ± 7.3 | −44.9 ± 7.6 |
NMR Measurements of Exchange Rates between Open and Closed States
Exchange kinetics between open and closed conformations were quantified using a Hahn-echo experiment (53) to measure the zero- and double-quantum relaxation rate constants, RZQ and RDQ, which are reported as R̄MQ = (RDQ + RZQ)/2 and ΔRMQ = (RDQ − RZQ)/2 (Fig. 5D and Table 3). Assuming that the 5′-CAmAAT-3′ complex is fully closed, the ratio R̄MQ/ΔRMQ = 1.18 for Met-49 in the 2OG complex (i.e. based on chemical exchange rate constants only) is similar to the ratio predicted from the 1H and 13C chemical shift changes between the Zn(II) and 5′-CAmAAT-3′ complexes, which is 1.11. This correspondence provides further support for the two-state transition model. The Met-49 chemical shift and relaxation data were fit to a two-site exchange model (Fig. 5E and Equation 4) to determine the chemical shift for the open state (16.6 ppm) and the rate constant for the transition to the closed state (k1 = 12,700 ± 200 s−1), assuming that k1 is the same for all complexes, as previously observed for other enzymes (42, 68). This model gives the fractions of the closed state as 0.16, 0.65, and ∼1 in the Zn(II), Zn(II)/2OG, and Zn(II)/2OG/5′-CAmAAT-3′ complexes, respectively. Alternatively, broadening in the Zn(II) state may reflect chemical exchange within the open-state ensemble, rather than transitions to the closed state. This model gives k1 = 8,600 ± 300 s−1 and the fractions of the closed state as ∼0, 0.59, and ∼1, respectively. As expected under the two-state transition model (Fig. 1D), both calculations show a substantial increase in the closed-state population in the presence of 2OG, and this increase accounts energetically for at least half of the observed increase in the affinity for the methylated DNA substrate in the presence of 2OG (Table 1).
TABLE 3.
Transverse relaxation rate constants for AlkB-ΔN11/ligand complexes
The zero- and double-quantum relaxation rate constants (RZQ and RDQ, respectively) were measured using a Hahn-echo experiment (53). As in Table 2, saturating concentrations of each titrant were added in succession to the previous complex.
| Ligand | Met-49 | Met-57 | Met-61 | Met-92 | |
|---|---|---|---|---|---|
| RZQ (s−1) | Zn(II) | 27.0 ± 1.1 | 27.0 ± 1.1 | 94.0 ± 0.2 | 32.2 ± 2.0 |
| 2OG | 54.6 ± 3.6 | 39.1 ± 4.6 | 59.4 ± 7.2 | 27.6 ± 4.0 | |
| 5′-CAmAAT-3′ | 30.5 ± 1.0 | 45.6 ± 0.9 | 33.8 ± 1.1 | 28.8 ± 1.1 | |
| RDQ (s−1) | Zn(II) | 80.4 ± 0.7 | 80.4 ± 0.7 | 97.9 ± 0.9 | 56.9 ± 1.1 |
| 2OG | 322 ± 14 | 83.1 ± 7.7 | 80.8 ± 13.1 | 41.7 ± 4.9 | |
| 5′-CAmAAT-3′ | 38.6 ± 0.3 | 67.2 ± 1.8 | 47.6 ± 2.6 | 65.3 ± 2.1 |
The two-state model is further supported by the linear correlations observed for the Met-49 and Met-57 13Cϵ chemical shifts in wild-type AlkB compared with three of the four single Met-to-Leu mutants (Figs. 5F and 9). The slopes of the correlation plots for these two residues are near unity in the M49L, M57L, and M92L mutant proteins. In contrast, in the M61L mutant protein, the slope of the correlation is reduced for the resonance of residue Met-49, and the chemical shifts of residue Met-57 are highly perturbed. These results suggest that the M61L mutant is less shifted toward the closed state in both the 2OG and DNA complexes and that the environment of Met-57 is altered. This last effect is explained by the close proximity of this residue to Met-61 in the closed-state structure (14, 23, 31). The chemical shifts of both Met-49 and Met-57 are perturbed strongly in the W89Y mutant (Figs. 5F, inset, and 8), confirming that the W89Y mutation biases AlkB toward the open state, as inferred previously from the reduced 2OG binding affinity of this mutant protein (Fig. 4). Therefore, the W89Y mutation opposes shifting of the conformational ensemble toward the closed state.
Accelerated Release of DNA Substrate Causes Uncoupled Turnover of 2OG
Perturbation of the thermodynamics of the conformational transition by W89Y provided an opportunity to evaluate the transition's influence on catalytic efficiency. To determine the degree of coupling of the two stages of the enzymatic reaction, i.e. 2OG decarboxylation and subsequent DNA demethylation, we developed an HPLC method to quantify the rate of 2OG oxidation in parallel with DNA substrate demethylation (Figs. 11, 12, and 15A and Table 4). Wild-type AlkB consumes one molecule of 2OG for each molecule of pentamer substrate demethylated (i.e. 5′-CAmCAT-3′ or 5′-CAmAAT-3′ in Figs. 11, A–D, and 12, D–F), indicating essentially perfect coupling. In contrast, AlkB consumes ∼5 molecules of 2OG per molecule of trimer substrate demethylated (i.e. 5′-TmAT-3′ in Fig. 12, A–C). Fluorescence anisotropy assays of the release rate of methylated DNA substrate from the Mn(II)/Suc complex demonstrate that trimer substrate is released from the co-product complex ∼60-fold more rapidly than pentamer substrate (Fig. 13, D and E, and Table 4), and this accelerated release accounts for the premature quenching of the oxyferryl intermediate and uncoupled 2OG turnover in ∼80% of oxidation reactions that occur when trimer substrate is bound. These observations indicate that the lifetime of the oxyferryl intermediate is ≥11 s (kcat for 5′-CAmCAT-3′ (31)) and that the enzyme releases longer DNA substrates more slowly than the forward reaction rate with methylated nucleobase (Figs. 1D and 13, D–F). Notably, the Mn(II)/Suc complex does not release the pentamer substrate more rapidly than the Mn(II)/2OG complex (Fig. 14), which is contrary to previous claims (32, 35) but is consistent with the need to sequester the oxyferryl intermediate in the active site after Suc generation.
FIGURE 11.

Representative HPLC assays of 2OG and DNA turnover. Decarboxylation of 2OG co-substrate (top) and demethylation of DNA substrates (bottom) in standard reaction buffer at 37 °C were quantified in parallel using Aminex HPX-87H and Phenomenex Luna C18 columns, respectively. Because the extinction coefficient of the Suc co-product at 210 nm is too low for reliable quantification, decarboxylation of 2OG was measured based on its depletion compared with pyruvate, an internal control compound that is not chemically modified during incubation or analysis. The chromatograms labeled “- control” come from mock reactions incubated in the absence of enzyme. A and B, comparison of 2OG turnover (A) during demethylation (B) of 5′-TmAT-3′ trimer substrate versus 5′-CAmAAT-3′ pentamer substrate by the WT enzyme. Peak integration indicates ∼5.1 2OG molecules are decarboxylated per DNA trimer substrate demethylated, compared with ∼1.1 2OG molecules per DNA pentamer substrate (i.e. 76 μm 2OG oxidation for 15 μm 5′-TmAT-3′ demethylation versus 20 μm 2OG oxidation for 19 μm 5′-CAmAAT-3′ demethylation). Reactions initially containing 150 μm 2OG, 30 μm 5′-TmAT-3′, and 0.5 μm enzyme were allowed to proceed for 30 min, whereas reactions initially containing 150 μm 2OG, 24 μm 5′-CAmAAT-3′, and 0.2 μm enzyme were allowed to proceed for 20 min. C and D, comparison of 2OG turnover (C) by 0.2 μm WT versus W89Y mutant enzyme during demethylation (D) of the longer 5′-CAmCAT-3′ pentamer substrate. Both enzyme variants oxidize roughly one 2OG molecule per DNA pentamer substrate demethylated, although W89Y turns over somewhat more slowly than WT (13 versus 20 μm of co-substrate/substrate turned over). Reactions initially containing 100 μm 2OG and 20 μm 5′-CAmCAT-3′ were incubated for 5 min. E and F, comparison of 2OG turnover (E) by 0.5 μm WT enzyme (thick solid lines) versus 1.2 μm W89Y mutant enzyme (thin solid lines) during demethylation (F) of the shorter 5′-TmAT-3′ trimer substrate. At every time point, greater 2OG decarboxylation and less DNA demethylation was observed for the W89Y mutant relative to the WT enzyme. Therefore, the W89Y mutation substantially increases the oxidation of 2OG uncoupled from demethylation of the shorter trimer DNA substrate, which is released from the enzyme more rapidly than the longer pentamer DNA substrate (Fig. 13, D and E). Reactions initially containing 150 μm 2OG and 30 μm 5′-TmAT-3′ were incubated for 5 (pink), 10 (blue), or 30 (green) minutes. The dashed line shows data from a mock (control) reaction without enzyme.
FIGURE 12.

2OG decarboxylation is decoupled from demethylation of trimer DNA substrate by the WT enzyme and further decoupled by mutations favoring the open state of the NRL. A–C show enzyme turnover data for the 5′-TmAT-3′ trimer substrate, whereas D–F show the equivalent data for the 5′-CAmAAT-3′ pentamer substrate. A, yield of decarboxylated 2OG per molecule of WT (black, 0.5 μm), W89Y (red, 1.2 μm), or M61L (blue, 0.7 μm) AlkB-ΔN11 as function of time in the presence of DNA trimer substrate. B, yield of demethylated 5′-TmAT-3′ in the same reactions. C, ratio of 2OG oxidation versus 5′-TmAT-3′ demethylation in these reactions. D, yield of decarboxylated 2OG per molecule of WT (black, 0.2 μm), W89Y (red, 0.5 μm), and AlkB-ΔN11 as function of time in the presence of DNA pentamer substrate. E, yield of demethylated 5′-CAmAAT-3′ in the same reactions. F, ratio of 2OG oxidation versus 5′-CAmAAT-3′ demethylation in these reactions. Enzyme reactions were carried out at 37 °C in 150 μm 2OG, 75 μm Fe(NH4)2(SO4)2, 500 μm ascorbate, 150 μm sodium pyruvate, 75 mm KCl, 50 mm Na-HEPES, pH 7.6.
FIGURE 15.
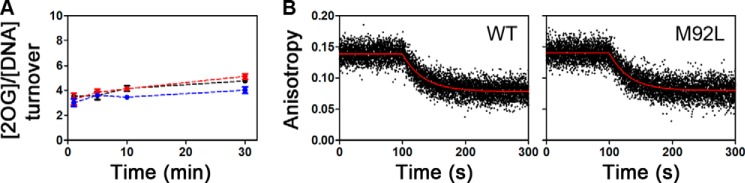
AlkB-ΔN11 mutants with unaffected 2OG/DNA coupling efficiency have DNA substrate release rates similar to the wild-type enzyme. A, coupling of 2OG oxidation to 5′-TmAT-3′ demethylation by WT (black), M92L (red), or I119M (blue) enzymes was quantified as shown in Fig. 11 in reactions conducted at 37 °C in the standard assay buffer. Although some uncoupled decarboxylation of the 2OG co-substrate occurs in the absence of alkylated DNA substrate, its addition substantially increases the rate of this reaction (12, 13). B, fluorescence anisotropy assays were used to measure the release rate of 5′-CAmCAT-FAM-3′ from WT (left) or M92L (right) enzyme at 10 °C in standard buffer containing 20 μm Mn(II) and 2 mm Suc. Competitive binding experiments were conducted as described for Fig. 13.
TABLE 4.
Catalytic parameters of WT and mutant AlkB-ΔN11 enzymes
The kcat and Km values were determined by Michaelis-Menten analysis. The koff values were measured by monitoring fluorescence anisotropy during competitive DNA-displacement experiments (e.g. as shown in Fig. 13, A–E). Michaelis-Menten analyses and DNA substrate release measurements were performed in the standard assay buffer at 10 °C. The 2OG/DNA coupling ratio (i.e. the ratio of 2OG co-substrate turnover to DNA substrate turnover) was measured at the end of a 20-min incubation period for pentamer DNA substrate or a 30-min incubation period for trimer DNA substrate at 37 °C.
| WT | W89Y | M61L | M92L | I119M | ||
|---|---|---|---|---|---|---|
| 5′-TmAT-3′ | kcat (min−1) | 5.2 ± 0.2 | ||||
| Km (μm) | 3.2 ± 0.4 | |||||
| koff (min−1) | 108 ± 48 | |||||
| 2OG/DNA | 4.9 ± 0.5 | 9.9 ± 2.1 | 12.3 ± 1.2 | 5.1 ± 0.3 | 4.1 ± 0.7 | |
| 5′-CAmCAT-3′ | kcat (min−1) | 21.2 ± 1.1 | ||||
| Km (μm) | 0.4 ± 0.1 | |||||
| koff (min−1) | 1.80 ± 0.02 | 7.5 ± 0.3 | 16.7 ± 1.8 | 1.90 ± 0.03 | ||
| 2OG/DNA | 0.9 ± 0.1 | 0.8 ± 0.3 | ||||
| 5′-CAmAAT-3′ | 2OG/DNA | 1.0 ± 0.1 | 1.5 ± 0.2 |
FIGURE 13.

Mutations favoring the open state of the NRL and enhancing uncoupled 2OG decarboxylation accelerate the release of DNA substrate. A–C, fluorescence anisotropy assays of the rate of release of 10 nm 5′-CAmCAT-3′ substrate from 4 μm WT (A), W89Y (B), or M61L (C) AlkB-ΔN11 in the presence of 2 mm Suc. Release was initiated by addition of 20 μm unlabeled DNA substrate under the conditions used for the anisotropy assays in Fig. 3. D and E, fluorescence anisotropy assays were used to measure the release rate of 5′-CAmCAT-FAM-3′ (D, koff = 1.8 min−1) or 5′-TmAT-FAM-3′ (E, koff ≥108 min−1) from WT AlkB-ΔN11 at 10 °C in standard buffer containing 20 μm Mn(II) and 2 mm Suc. F shows Michaelis-Menten kinetic assays performed for 5′-CAmCAT-3′ (black, kcat = 21.2 min−1) and 5′-TmAT-3′ (red, kcat = 5.2 min−1) in the standard assay buffer at 10 °C as described previously (23) with minor modifications described under “Experimental Procedures.” Error bars represent the standard error of the mean.
FIGURE 14.
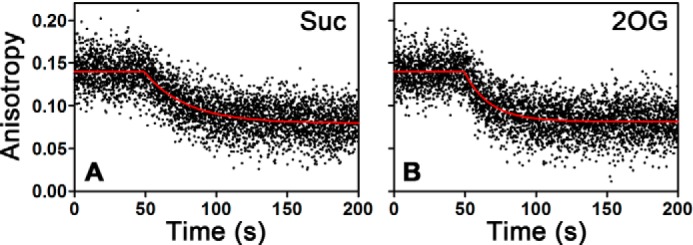
Oxidation of 2OG to Suc does not enhance the release rate of methylated DNA substrate. The release rate of 5′-CAmCAT-FAM-3′ from WT AlkB in complex with Suc/Mn(II) (A) or 2OG/Mn(II) (B) was measured at 10 °C in the standard buffer containing 20 μm MnCl2 and either 2 mm Suc (A) or 100 μm 2OG (B). These competitive binding experiments were carried out as described for Fig. 13, A–D. Based on several replicates of each experiment, the DNA release rate is 3.4 ± 0.2 min−1 from the Mn(II)/2OG complex and 1.80 ± 0.02 min−1 from the Mn(II)/Suc complex.
Protein Dynamics Control the Catalytic Efficiency of AlkB
The observation that the release rate of the DNA substrate is a critical determinant of catalytic efficiency provides a sensitive starting point for analysis of the influence of protein mutations on this process. The M61L mutation, which changes a residue directly contacting the DNA substrate, substantially accelerates DNA substrate release (Fig. 13C and Table 4) while only slightly perturbing the thermodynamics of the functional conformational transition characterized above (Figs. 5F and 9). This point mutation substantially increases turnover of 2OG uncoupled from DNA demethylation (Fig. 12, A–C), confirming that premature release of methylated substrate causes uncoupling. Strikingly, a similar increase in DNA release rate (Fig. 13, A and B, and Table 4) and uncoupled 2OG turnover (Fig. 12, A–C) is caused by the W89Y mutation, which is remote from the active site (Fig. 1B) but strongly biases the enzyme conformation toward the open conformation (Figs. 4 and 8). In contrast, the mutation of methionine residue Met-92, which is located in a region of the protein that is not significantly affected during the ligand-dependent conformational transition (Fig. 5A), alters neither the rate of DNA release nor the efficiency of coupling between 2OG turnover and DNA repair (Fig. 15 and Table 4). These results demonstrate that, in addition to controlling the proper order of co-substrate/substrate binding (Fig. 3), the conformational transition between open/closed states of the NRL determines the DNA release rate, which critically modulates the catalytic efficiency of AlkB. If this transition were too slow, the rate of DNA repair would be limited due to slow product release. Our results demonstrate that, if this transition is too fast, catalytic efficiency is reduced because of increased uncoupled turnover of the 2OG co-substrate. Therefore, the kinetics of the conformational transition gating DNA substrate binding have evolved to control sequestration of the reactive oxyferryl intermediate and the net efficiency of the catalytic reaction cycle of AlkB.
DISCUSSION
Like other Fe(II)/2OG dioxygenases, AlkB performs a high energy chemical transformation requiring coordination of the binding of four cofactor/substrate molecules followed by sequestration of a highly reactive enzyme-bound intermediate (2). Previous research suggested that the dynamics of AlkB contribute to several stages in its reaction cycle, including binding of structurally diverse substrates (23), coupling between successive chemical steps in the reaction cycle (23), and facilitating release of the repaired DNA product (32). In this study, by combining fluorescence spectroscopy and NMR spectroscopy with enzymological assays, we demonstrate that a specific protein conformational transition orchestrates the complex multistep catalytic reaction cycle of AlkB (Fig. 1D), controlling both the proper sequential order of cofactor/substrate binding as well as the kinetic sequestration of the reactive oxyferryl intermediate.
This transition changes AlkB from an open conformation that has yet to be observed crystallographically to a closed conformation resembling that in substrate- and product-bound crystal structures (14, 23, 31). Our spectroscopic data demonstrate that the open conformation has similar net secondary structure content as measured by CD (Fig. 2, A and C) but an altered environment of the Trp and Met residues proximal to the active site and at the interface between the Fe(II)/2OG core and the NRL (Figs. 3, A–D, and 4). Previous amide-exchange measurements showed that the backbone of the NRL has enhanced dynamics in the open conformation (23), and the NMR data presented here show that its methionine side chains are disordered in this conformation (Fig. 5). Therefore, the key conformational transition controlling the catalytic reaction cycle of AlkB involves movement of the NRL away from the active site into a more open position where it participates in fewer constraining interactions with the Fe(II)/2OG core (as schematized in Fig. 1C).
In the metal-bound enzyme, this open state is favored over the closed state by a factor of ∼5:1, as elucidated by the NMR data presented here. Binding of 2OG or Suc changes this ratio to ∼0.5:1, which importantly increases the affinity for DNA substrate. Although some variation in the exact ratio is possible with co-substrate versus co-product in the buffers at acidic or neutral pH, our 1H-13C chemical shift data (Figs. 5–8) suggest that any such variations are relatively small. Using these data, the estimated proportion of the closed state in the Zn(II)/2OG complex is 0.64 ± 0.05 at pD 5.5 and 0.59 ± 0.06 at pD 7.6, and the estimated proportion of the closed state in the Zn(II)/Suc complex is 0.61 ± 0.05 at pD 5.5.
Comparing the apoenzyme (i.e. with neither metal cofactor nor 2OG co-substrate bound) with the metal/2OG complex, the affinity for the DNA substrate is increased by ∼100-fold by Fe(II)/2OG binding, as demonstrated by our fluorescence binding experiments. Thus, the transition toward the closed state controls the proper sequential order of substrate binding. We also demonstrate that DNA binding greatly stabilizes the closed state and that mutations that bias the transition toward the open state substantially accelerate DNA substrate release and enhance uncoupled turnover of 2OG. Therefore, the kinetics of the conformational transition gating DNA binding directly control sequestration of the reactive oxyferryl intermediate and thereby the net efficiency of the catalytic reaction cycle. In wild-type AlkB, the opening kinetics are tuned to mediate release of the DNA substrate/product slightly more slowly than hydrogen abstraction from the primary substrate, to produce efficient repair of this substrate without promoting uncoupled turnover of 2OG and adventitious oxidative side reactions. Dynamic conformational transitions of this kind are likely to control the catalytic efficiency of other Fe(II)/2OG dioxygenases as well as many other enzyme families performing complex biomolecular transformations.
Acknowledgments
We acknowledge Victor Wong for technical assistance and Brent Stockwell and Scott Banta for instrumentation access. We thank Christie Brouillette and Wendy Yang of the University of Alabama and Chi Wang and other members of the Hunt and Palmer laboratories for advice. The 900 MHz spectrometers were purchased with funds from the National Institutes of Health, the Keck Foundation (New York State), and the New York City Economic Development Corp.
This work was supported, in whole or in part, by National Institutes of Health Grants GM077360 (to J. F. H.), GM50291 and 1S10RR026540 (to A. G. P.), and GM089047 (to M. L. G.) from NIGMS. This work was also supported by Grant 2U54GM074958 to the NE Structural Genomics Consortium.
B. Ergel, M. L. Gill, V. Wong, W. Yang, C. Brouillette, A. G. Palmer III, and J. F. Hunt, manuscript in preparation.
- 2OG
- 2-oxoglutarate
- NRL
- nucleotide recognition lid
- Suc
- succinate
- 6-FAM
- 6-carboxyfluorescein
- 5′-CAmCAT-3′
- 5′-dC-dA-(3-me-dC)-dA-dT-3′
- 5′-CAmAAT-3′
- 5′-dC-dA-(1-me-dA)-dA-dT-3′
- 5′-TmAT-3′
- 5′-dT-(1-me-dA)-dT-3′
- mA
- N1-methyladenosine-5′-triphosphate
- TEV
- tobacco etch virus
- T
- tesla.
REFERENCES
- 1. Schofield C. J., Zhang Z. (1999) Structural and mechanistic studies on 2-oxoglutarate-dependent oxygenases and related enzymes. Curr. Opin. Struct. Biol. 9, 722–731 [DOI] [PubMed] [Google Scholar]
- 2. Hausinger R. P. (2004) Fe(II)/α-ketoglutarate-dependent hydroxylases and related enzymes. Crit. Rev. Biochem. Mol. Biol. 39, 21–68 [DOI] [PubMed] [Google Scholar]
- 3. Clifton I. J., McDonough M. A., Ehrismann D., Kershaw N. J., Granatino N., Schofield C. J. (2006) Structural studies on 2-oxoglutarate oxygenases and related double-stranded β-helix fold proteins. J. Inorg. Biochem. 100, 644–669 [DOI] [PubMed] [Google Scholar]
- 4. Kurowski M. A., Bhagwat A. S., Papaj G., Bujnicki J. M. (2003) Phylogenomic identification of five new human homologs of the DNA repair enzyme AlkB. BMC Genomics 4, 48. [DOI] [PMC free article] [PubMed] [Google Scholar]
- 5. Loenarz C., Schofield C. J. (2011) Physiological and biochemical aspects of hydroxylations and demethylations catalyzed by human 2-oxoglutarate oxygenases. Trends Biochem. Sci. 36, 7–18 [DOI] [PubMed] [Google Scholar]
- 6. Duncan T., Trewick S. C., Koivisto P., Bates P. A., Lindahl T., Sedgwick B. (2002) Reversal of DNA alkylation damage by two human dioxygenases. Proc. Natl. Acad. Sci. U.S.A. 99, 16660–16665 [DOI] [PMC free article] [PubMed] [Google Scholar]
- 7. Sanchez-Pulido L., Andrade-Navarro M. A. (2007) The FTO (fat mass and obesity associated) gene codes for a novel member of the non-heme dioxygenase superfamily. BMC Biochem. 8, 23. [DOI] [PMC free article] [PubMed] [Google Scholar]
- 8. Gerken T., Girard C. A., Tung Y.-C., Webby C. J., Saudek V., Hewitson K. S., Yeo G. S., McDonough M. A., Cunliffe S., McNeill L. A., Galvanovskis J., Rorsman P., Robins P., Prieur X., Coll A. P., Ma M., Jovanovic Z., Farooqi I. S., Sedgwick B., Barroso I., Lindahl T., Ponting C. P., Ashcroft F. M., O'Rahilly S., Schofield C. J. (2007) The obesity-associated FTO gene encodes a 2-oxoglutarate-dependent nucleic acid demethylase. Science 318, 1469–1472 [DOI] [PMC free article] [PubMed] [Google Scholar]
- 9. Kataoka H., Yamamoto Y., Sekiguchi M. (1983) A new gene (alkB) of Escherichia coli that controls sensitivity to methyl methane sulfonate. J. Bacteriol. 153, 1301–1307 [DOI] [PMC free article] [PubMed] [Google Scholar]
- 10. Dinglay S., Trewick S. C., Lindahl T., Sedgwick B. (2000) Defective processing of methylated single-stranded DNA by E. coli alkB mutants. Genes Dev. 14, 2097–2105 [PMC free article] [PubMed] [Google Scholar]
- 11. Aravind L., Koonin E. V. (2001) The DNA-repair protein AlkB, EGL-9, and leprecan define new families of 2-oxoglutarate-and iron-dependent dioxygenases. Genome Biol. 2, RESEARCH0007. [DOI] [PMC free article] [PubMed] [Google Scholar]
- 12. Falnes P. Ø., Johansen R. F., Seeberg E. (2002) AlkB-mediated oxidative demethylation reverses DNA damage in Escherichia coli. Nature 419, 178–182 [DOI] [PubMed] [Google Scholar]
- 13. Trewick S. C., Henshaw T. F., Hausinger R. P., Lindahl T., Sedgwick B. (2002) Oxidative demethylation by Escherichia coli AlkB directly reverts DNA base damage. Nature 419, 174–178 [DOI] [PubMed] [Google Scholar]
- 14. Yi C., Jia G., Hou G., Dai Q., Zhang W., Zheng G., Jian X., Yang C. G., Cui Q., He C. (2010) Iron-catalysed oxidation intermediates captured in a DNA repair dioxygenase. Nature 468, 330–333 [DOI] [PMC free article] [PubMed] [Google Scholar]
- 15. Ryle M. J., Padmakumar R., Hausinger R. P. (1999) Stopped-flow kinetic analysis of Escherichia coli taurine/α-ketoglutarate dioxygenase: interactions with α-ketoglutarate, taurine, and oxygen. Biochemistry 38, 15278–15286 [DOI] [PubMed] [Google Scholar]
- 16. Price J. C., Barr E. W., Tirupati B., Bollinger J. M., Jr., Krebs C. (2003) The first direct characterization of a high-valent iron intermediate in the reaction of an α-ketoglutarate-dependent dioxygenase: a high-spin Fe(IV) complex in taurine/α-ketoglutarate dioxygenase (TauD) from Escherichia coli. Biochemistry 42, 7497–7508 [DOI] [PubMed] [Google Scholar]
- 17. Price J. C., Barr E. W., Hoffart L. M., Krebs C., Bollinger J. M. (2005) Kinetic dissection of the catalytic mechanism of taurine:α-ketoglutarate dioxygenase (TauD) from Escherichia coli. Biochemistry 44, 8138–8147 [DOI] [PubMed] [Google Scholar]
- 18. Grzyska P. K., Ryle M. J., Monterosso G. R., Liu J., Ballou D. P., Hausinger R. P. (2005) Steady-state and transient kinetic analyses of taurine/α-ketoglutarate dioxygenase: effects of oxygen concentration, alternative sulfonates, and active-site variants on the Fe(IV)-oxo intermediate. Biochemistry 44, 3845–3855 [DOI] [PubMed] [Google Scholar]
- 19. Hoffart L. M., Barr E. W., Guyer R. B., Bollinger J. M., Jr., Krebs C. (2006) Direct spectroscopic detection of a C-H-cleaving high-spin Fe(IV) complex in a prolyl-4-hydroxylase. Proc. Natl. Acad. Sci. U.S.A. 103, 14738–14743 [DOI] [PMC free article] [PubMed] [Google Scholar]
- 20. Flashman E., Hoffart L. M., Hamed R. B., Bollinger J. M., Jr., Krebs C., Schofield C. J. (2010) Evidence for the slow reaction of hypoxia-inducible factor prolyl hydroxylase 2 with oxygen. FEBS J. 277, 4089–4099 [DOI] [PMC free article] [PubMed] [Google Scholar]
- 21. Panay A. J., Lee M., Krebs C., Bollinger J. M., Fitzpatrick P. F. (2011) Evidence for a high-spin Fe(IV) species in the catalytic cycle of a bacterial phenylalanine hydroxylase. Biochemistry 50, 1928–1933 [DOI] [PMC free article] [PubMed] [Google Scholar]
- 22. Price J. C., Barr E. W., Glass T. E., Krebs C., Bollinger J. M., Jr. (2003) Evidence for hydrogen abstraction from C1 of taurine by the high-spin Fe(IV) intermediate detected during oxygen activation by taurine:α-ketoglutarate dioxygenase (TauD). J. Am. Chem. Soc. 125, 13008–13009 [DOI] [PubMed] [Google Scholar]
- 23. Yu B., Edstrom W. C., Benach J., Hamuro Y., Weber P. C., Gibney B. R., Hunt J. F. (2006) Crystal structures of catalytic complexes of the oxidative DNA/RNA repair enzyme AlkB. Nature 439, 879–884 [DOI] [PubMed] [Google Scholar]
- 24. Holme E. (1975) A kinetic study of thymine 7-hydroxylase from Neurospora crassa. Biochemistry 14, 4999–5003 [DOI] [PubMed] [Google Scholar]
- 25. Zhou J., Gunsior M., Bachmann B. O., Townsend C. A., Solomon E. I. (1998) Substrate binding to the α-ketoglutarate-dependent non-heme iron enzyme clavaminate synthase 2: coupling mechanism of oxidative decarboxylation and hydroxylation. J. Am. Chem. Soc. 120, 13539–13540 [Google Scholar]
- 26. Myllylä R., Tuderman L., Kivirikko K. I. (1977) Mechanism of the prolyl hydroxylase reaction. Eur. J. Biochem. 80, 349–357 [DOI] [PubMed] [Google Scholar]
- 27. Eser B. E., Barr E. W., Frantom P. A., Saleh L., Bollinger J. M., Jr., Krebs C., Fitzpatrick P. F. (2007) Direct spectroscopic evidence for a high-spin Fe(IV) intermediate in tyrosine hydroxylase. J. Am. Chem. Soc. 129, 11334–11335 [DOI] [PMC free article] [PubMed] [Google Scholar]
- 28. Riggs-Gelasco P. J., Price J. C., Guyer R. B., Brehm J. H., Barr E. W., Bollinger J. M., Jr., Krebs C. (2004) EXAFS spectroscopic evidence for an Fe=O unit in the Fe(IV) intermediate observed during oxygen activation by taurine:α-ketoglutarate dioxygenase. J. Am. Chem. Soc. 126, 8108–8109 [DOI] [PubMed] [Google Scholar]
- 29. Proshlyakov D. A., Henshaw T. F., Monterosso G. R., Ryle M. J., Hausinger R. P. (2004) Direct detection of oxygen intermediates in the non-heme Fe enzyme taurine/α-ketoglutarate dioxygenase. J. Am. Chem. Soc. 126, 1022–1023 [DOI] [PubMed] [Google Scholar]
- 30. Myllylä R., Majamaa K., Günzler V., Hanauske-Abel H. M., Kivirikko K. I. (1984) Ascorbate is consumed stoichiometrically in the uncoupled reactions catalyzed by prolyl 4-hydroxylase and lysyl hydroxylase. J. Biol. Chem. 259, 5403–5405 [PubMed] [Google Scholar]
- 31. Yu B., Hunt J. F. (2009) Enzymological and structural studies of the mechanism of promiscuous substrate recognition by the oxidative DNA repair enzyme AlkB. Proc. Natl. Acad. Sci. U.S.A. 106, 14315–14320 [DOI] [PMC free article] [PubMed] [Google Scholar]
- 32. Bleijlevens B., Shivarattan T., Flashman E., Yang Y., Simpson P. J., Koivisto P., Sedgwick B., Schofield C. J., Matthews S. J. (2008) Dynamic states of the DNA repair enzyme AlkB regulate product release. EMBO Rep. 9, 872–877 [DOI] [PMC free article] [PubMed] [Google Scholar]
- 33. Wong C., Fujimori D. G., Walsh C. T., Drennan C. L. (2009) Structural analysis of an open active site conformation of nonheme iron halogenase CytC3. J. Am. Chem. Soc. 131, 4872–4879 [DOI] [PMC free article] [PubMed] [Google Scholar]
- 34. Khare D., Wang B., Gu L., Razelun J., Sherman D. H., Gerwick W. H., Håkansson K., Smith J. L. (2010) Conformational switch triggered by α-ketoglutarate in a halogenase of curacin A biosynthesis. Proc. Natl. Acad. Sci. U.S.A. 107, 14099–14104 [DOI] [PMC free article] [PubMed] [Google Scholar]
- 35. Bleijlevens B., Shivarattan T., van den Boom K. S., de Haan A., van der Zwan G., Simpson P. J., Matthews S. J. (2012) Changes in protein dynamics of the DNA repair dioxygenase AlkB upon binding of Fe2+ and 2-oxoglutarate. Biochemistry 51, 3334–3341 [DOI] [PubMed] [Google Scholar]
- 36. Nicholson L. K., Yamazaki T., Torchia D. A., Grzesiek S., Bax A., Stahl S. J., Kaufman J. D., Wingfield P. T., Lam P. Y., Jadhav P. K. (1995) Flexibility and function in HIV-1 protease. Nat. Struct. Biol. 2, 274–280 [DOI] [PubMed] [Google Scholar]
- 37. Sawaya M. R., Kraut J. (1997) Loop and subdomain movements in the mechanism of Escherichia coli dihydrofolate reductase: crystallographic evidence. Biochemistry 36, 586–603 [DOI] [PubMed] [Google Scholar]
- 38. McClendon S., Zhadin N., Callender R. (2005) The approach to the Michaelis complex in lactate dehydrogenase: the substrate binding pathway. Biophys. J. 89, 2024–2032 [DOI] [PMC free article] [PubMed] [Google Scholar]
- 39. Boehr D. D., McElheny D., Dyson H. J., Wright P. E. (2006) The dynamic energy landscape of dihydrofolate reductase catalysis. Science 313, 1638–1642 [DOI] [PubMed] [Google Scholar]
- 40. Doucet N., Watt E. D., Loria J. P. (2009) The flexibility of a distant loop modulates active site motion and product release in ribonuclease A. Biochemistry 48, 7160–7168 [DOI] [PMC free article] [PubMed] [Google Scholar]
- 41. Xu Y., Lorieau J., McDermott A. E. (2010) Triosephosphate isomerase: 15N and 13C chemical shift assignments and conformational change upon ligand binding by magic-angle spinning solid-state NMR spectroscopy. J. Mol. Biol. 397, 233–248 [DOI] [PMC free article] [PubMed] [Google Scholar]
- 42. Wolf-Watz M., Thai V., Henzler-Wildman K., Hadjipavlou G., Eisenmesser E. Z., Kern D. (2004) Linkage between dynamics and catalysis in a thermophilic-mesophilic enzyme pair. Nat. Struct. Mol. Biol. 11, 945–949 [DOI] [PubMed] [Google Scholar]
- 43. Hammes G. G., Benkovic S. J., Hammes-Schiffer S. (2011) Flexibility, diversity, and cooperativity: pillars of enzyme catalysis. Biochemistry 50, 10422–10430 [DOI] [PMC free article] [PubMed] [Google Scholar]
- 44. Massi F., Wang C., Palmer A. G. (2006) Solution NMR and computer simulation studies of active site loop motion in triosephosphate isomerase. Biochemistry 45, 10787–10794 [DOI] [PubMed] [Google Scholar]
- 45. Stafford K. A., Robustelli P., Palmer A. G. (2013) Thermal adaptation of conformational dynamics in ribonuclease H. PLoS Comput. Biol. 9, e1003218. [DOI] [PMC free article] [PubMed] [Google Scholar]
- 46. Liu H., Llano J., Gauld J. W. (2009) A DFT study of nucleobase dealkylation by the DNA repair enzyme AlkB. J. Phys. Chem. B 113, 4887–4898 [DOI] [PubMed] [Google Scholar]
- 47. Findeisen M., Brand T., Berger S. (2007) A 1H-NMR thermometer suitable for cryoprobes. Magn. Reson. Chem. 45, 175–178 [DOI] [PubMed] [Google Scholar]
- 48. Schleucher J., Schwendinger M., Sattler M., Schmidt P., Schedletzky O., Glaser S. J., Sørensen O. W., Griesinger C. (1994) A general enhancement scheme in heteronuclear multidimensional NMR employing pulsed field gradients. J. Biomol. NMR 4, 301–306 [DOI] [PubMed] [Google Scholar]
- 49. Kay L., Keifer P., Saarinen T. (1992) Pure absorption gradient enhanced heteronuclear single quantum correlation spectroscopy with improved sensitivity. J. Am. Chem. Soc. 114, 10663–10665 [Google Scholar]
- 50. Palmer A. G., Cavanagh J., Wright P. E., Rance M. (1991) Sensitivity improvement in proton-detected two-dimensional heteronuclear correlation NMR spectroscopy. J. Magn. Reson. 93, 151–170 [Google Scholar]
- 51. Schanda P., Kupce E., Brutscher B. (2005) SOFAST-HMQC experiments for recording two-dimensional heteronuclear correlation spectra of proteins within a few seconds. J. Biomol. NMR 33, 199–211 [DOI] [PubMed] [Google Scholar]
- 52. Tugarinov V., Sprangers R., Kay L. E. (2007) Probing side-chain dynamics in the proteasome by relaxation violated coherence transfer NMR spectroscopy. J. Am. Chem. Soc. 129, 1743–1750 [DOI] [PubMed] [Google Scholar]
- 53. Gill M. L., Palmer A. G. (2011) Multiplet-filtered and gradient-selected zero-quantum TROSY experiments for 13C1H3 methyl groups in proteins. J. Biomol. NMR 51, 245–251 [DOI] [PMC free article] [PubMed] [Google Scholar]
- 54. Delaglio F., Grzesiek S., Vuister G. W., Zhu G., Pfeifer J., Bax A. (1995) NMRPipe: A multidimensional spectral processing system based on UNIX pipes. J. Biomol. NMR 6, 277–293 [DOI] [PubMed] [Google Scholar]
- 55. Helmus J. J., Jaroniec C. P. (2013) Nmrglue: an open source Python package for the analysis of multidimensional NMR data. J. Biomol. NMR 55, 355–367 [DOI] [PMC free article] [PubMed] [Google Scholar]
- 56. Barrett P., Hunter J. D., Greenfield P. (2004) Astronomical Data Analysis Software & Systems XIV [Google Scholar]
- 57. Pérez F., Granger B. E. (2007) IPython: a system for interactive scientific computing. Comput. Sci. Eng. 9, 21–29 [Google Scholar]
- 58. Koivisto P., Duncan T., Lindahl T., Sedgwick B. (2003) Minimal methylated substrate and extended substrate range of Escherichia coli AlkB protein, a 1-methyladenine-DNA dioxygenase. J. Biol. Chem. 278, 44348–44354 [DOI] [PubMed] [Google Scholar]
- 59. Besley N. A., Hirst J. D. (1999) Theoretical studies toward quantitative protein circular dichroism calculations. J. Am. Chem. Soc. 121, 9636–9644 [Google Scholar]
- 60. Spolar R. S., Record M. T. (1994) Coupling of local folding to site-specific binding of proteins to DNA. Science 263, 777–784 [DOI] [PubMed] [Google Scholar]
- 61. Myers J. K., Pace C. N., Scholtz J. M. (1995) Denaturant m values and heat capacity changes: Relation to changes in accessible surface areas of protein unfolding. Protein Sci. 4, 2138–2148 [DOI] [PMC free article] [PubMed] [Google Scholar]
- 62. Chen H., Ahsan S. S., Santiago-Berrios M. B., Abruña H. D., Webb W. W. (2010) Mechanisms of quenching of Alexa fluorophores by natural amino acids. J. Am. Chem. Soc. 132, 7244–7245 [DOI] [PMC free article] [PubMed] [Google Scholar]
- 63. Lakowicz J. R. (2006) Principles of Fluorescence Spectroscopy, 3rd Edition, pp. 334–342, 443,–472, and 530–573, Springer, New York [Google Scholar]
- 64. Ricci R. W., Nesta J. M. (1976) Inter- and intramolecular quenching of indole fluorescence by carbonyl compounds. J. Phys. Chem. 80, 974–980 [Google Scholar]
- 65. Sillen A., Díaz J. F., Engelborghs Y. (2000) A step toward the prediction of the fluorescence lifetimes of tryptophan residues in proteins based on structural and spectral data. Protein Sci. 9, 158–169 [DOI] [PMC free article] [PubMed] [Google Scholar]
- 66. Farid S., Dinnocenzo J. P., Merkel P. B., Young R. H., Shukla D., Guirado G. (2011) Reexamination of the Rehm-Weller data set reveals electron transfer quenching that follows a Sandros-Boltzmann dependence on free energy. J. Am. Chem. Soc. 133, 11580–11587 [DOI] [PubMed] [Google Scholar]
- 67. Holland P. J., Hollis T. (2010) Structural and mutational analysis of Escherichia coli AlkB provides insight into substrate specificity and DNA damage searching. PLoS ONE 5, e8680. [DOI] [PMC free article] [PubMed] [Google Scholar]
- 68. Williams J. C., McDermott A. E. (1995) Dynamics of the flexible loop of triose-phosphate isomerase: The loop motion is not ligand gated. Biochemistry 34, 8309–8319 [DOI] [PubMed] [Google Scholar]