Abstract
Cytobank is a web-based application for storage, analysis, and sharing of flow cytometry experiments. Researchers use a web browser to log in and use a wide range of tools developed for basic and advanced flow cytometry. In addition to providing access to standard cytometry tools from any computer, Cytobank creates a platform and community for developing new analysis and publication tools. Figure layouts created on Cytobank are designed to allow transparent access to the underlying experiment annotation and data processing steps. Since all flow cytometry files and analysis data are stored on a central server, experiments and figures can be viewed or edited by anyone with the proper permissions from any computer with Internet access. Once a primary researcher has performed the initial analysis of the data, collaborators can engage in experiment analysis and make their own figure layouts using the gated, compensated experiment files.
Cytobank is available to the scientific community at www.cytobank.org
INTRODUCTION
Historically, flow cytometry analysis has been broken into isolated stages after data collection: pre-processing steps like compensation and gating, visualization of the results as flow plots, extraction of the relevant statistics, and then export of the statistics for significance analysis and graphing. Missing from this workflow is organization and storage of the primary data, which is handled in various ways by institutions or individuals. A consequence of the isolation of each step and the haphazard organization of the primary data is that the final graphs of the data, and sometimes even the flow cytometry plots, are often far removed from the primary data files.
We developed Cytobank, a platform to manage, store and analyze flow cytometry data over the web, to address this challenge. Through Cytobank, users can access and analyze their experiments, share results and figures with their collaborators, and drill down to the underlying data and pre-processing steps. Scientists can upload a folder of data, create a publication-style figure, and then create a URL link to the figure and raw data files. Since all of the data and analyses are stored on a central server, they can be viewed or edited by anyone with the proper permissions from any computer in the world. This allows collaborators to contribute to the analysis at all stages and understand far more of the technical details of how the experiment was performed.
The protocols here explain using Cytobank for storage and organization (Basic Protocol), analysis (Alternate Protocol 1 and Alternate Protocol 2), and sharing (Alternate Protocol 3) of flow cytometry datasets. In addition, Alternate Protocol 4 describes the steps for publishing flow cytometry data online to the community and Alternate Protocol 5 details the steps to obtain such published datasets and begin further computational or statistical analysis.
Cytobank is available to the scientific community at www.cytobank.org
ONLINE STORAGE OF FLOW CYTOMETRY DATA
This Basic Protocol begins by explaining how to access Cytobank and download a public flow cytometry dataset from a flow cytometry experiment to your computer. This protocol then explains how to upload these data and any associated analysis files to Cytobank for storage and organization. Upload/download, storage, and organization are the basic elements of a web repository. Even if Cytobank is not used for data analysis or figure publication (described below in the Alternate Protocols), integrating Cytobank data upload into the daily experiment workflow will make it easier to keep track of experiments, find data and figures when writing papers, and transition projects between investigators.
For example, following collection of a flow cytometry experiment, the experimental flow cytometry standard (FCS) files can be uploaded to Cytobank from the computer operating the cytometer. Next the files can be downloaded to a personal computer and analyzed using preferred commercial or custom-written software packages. Once analysis is complete, all of the analysis files and figures can then be uploaded to the experiment on Cytobank so that one searchable and shareable package contains all the key experimental files. These experiments can also be grouped together and shared as a project. Tools on Cytobank make it easy to tag a group of experiment and analysis files with search terms and place them into a project – similar to organizing file in folders on a computer desktop, except that files can be accessed over the network for analysis at any computer.
Necessary Resources
A computer with the FireFox web browser: http://www.mozilla.com/
- A Google ID, Yahoo! ID or alternate OpenID: http://www.openid.net/getCytobank uses OpenID for authentication, which means that you may already have a login from another web service (e.g. Google or Yahoo!). To see if you already have an OpenID, follow the link above.
- The ability to run a Java applet in the Firefox web browser.One way to test is by going to http://www.javatester.org/version.html. Check to see that your version is greater than or equal to the minimum version of 1.5.1.
Accessing Cytobank and Opening a Public Experiment
Materials
- Navigate to http://www.cytobank.org/cytobank/login to create an account or to login. If this is your first time using Cytobank, select “register for a new Cytobank account.”Fill in the form with your name and e-mail address. Then select your Open ID provider from the list. Alternatively, you may enter a URL to another OpenID provider.
- Once you are logged in, take a moment to familiarize yourself with the display. The list of experiments you see after logging in is Cytobank’s “Experiment Inbox.”New users usually begin with only public experiments in the Experiment Inbox. Each time you upload data or someone shares an experiment with you, you will see another experiment in your inbox.The Experiment Inbox can be sorted by clicking the arrows next to each column’s title.To filter the Experiment Inbox to only show only your personal experiments (and not public experiments), click the “My Experiments” link in the left menu headed “Manage Experiments.” Similarly, “Public Experiments” will filter your inbox to show only public experiments, which are available to all Cytobank users.
- Search for the experiment entitled “Welcome to Cytobank - U937 dataset”. To search, begin typing into the search box in the upper right of the Experiment Inbox. For example, you could type “welcome” in the search box to find this experiment (Figure 1.1.1).As you type, the inbox is filtered to show experiments matching the text. You can search using any of the values listed in the inbox, such as the name of the experiment’s primary researcher.Other commands available within the inbox for organizing experiments and managing user profiles will be mentioned in the Alternate Protocols below. For now, we’ll continue with the Basic Protocol so that we can go through the steps for data download and upload.
- Click the title of “Welcome to Cytobank - U937 dataset” to open this experiment. You will see a page listing all the data, illustrations, and files associated with that experiment.Each experiment has a set of “Basic Information”, including a title, the name of the person who did the experiment, and a short description of the experiment’s purpose. These details are collected when the data are first uploaded.Also associated with experiments are Illustrations, Attachments, and Files. Illustrations are created using the Cytobank analysis tool set, as described in Alternate Protocol 1. Files and Attachments list the files that were uploaded when the experiment was created and after the experiment was created, respectively.Sharing experiments and organization of experiments into Projects will be discussed in Alternate Protocol 3.
- In the Illustrations section of the experiment summary, click on the Illustration titled “Example Histogram Overlay.” This will load an analysis view of this experiment showing a series of histogram overlays (Figure 1.1.2).For now, just open this figure to get a sense for the results of the experiment. We’ll re-create this and other figures after (re)uploading the data in a later step.
Figure 1.1.1.

Searching the Experiment Inbox for the “Welcome to Cytobank – U937 dataset” experiment. In the upper right hand corner search box, type “welcome” to filter the experiments and show only those which match that text. https://www.cytobank.org/cytobank/experiments
Figure 1.1.2.
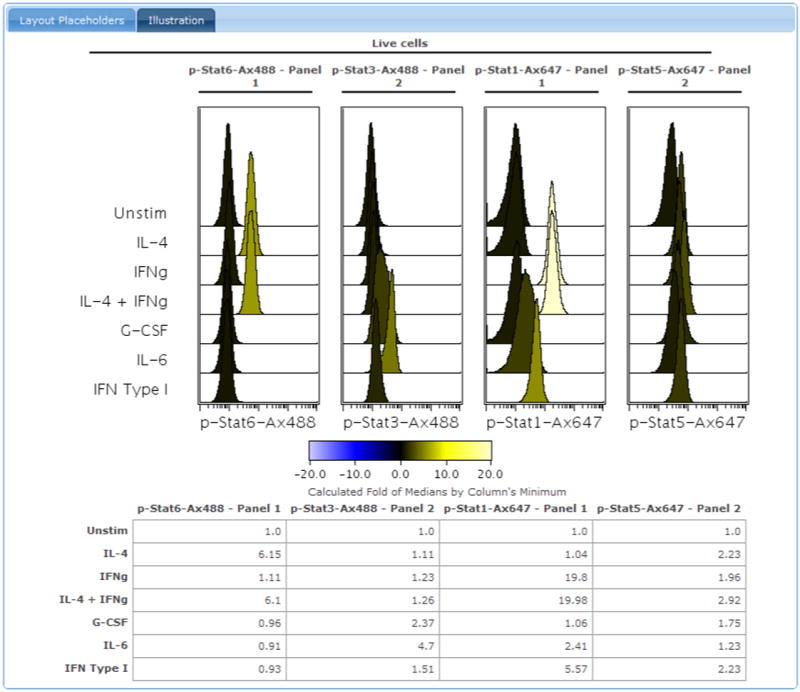
A histogram overlay figure on Cytobank. This figure shows the response of the U937 cell line to various stimulation conditions (in rows) at different signaling node readouts (p-STAT6, p-STAT3, p-STAT1, and p-STAT5, in columns). Histogram overlays on Cytobank shade peaks according to a statistic defined by the researcher. In this histogram overlay of a signaling experiment, the peaks are shaded by the fold change of each stimulated sample from the unstimulated control (in the first row). Each column shows intracellular detection of a phosphorylated STAT protein (1). Also included is a table of the statistics and a color scale. https://www.cytobank.org/cytobank/experiments/61/illustrations/96#Illustration
Downloading a Public Dataset
Materials
Access to an experiment on Cytobank: https://www.cytobank.org/cytobank/experiments/61
To re-open the “Welcome to Cytobank - U937 dataset” experiment summary page, you can copy/paste the following URL into your browser’s address bar.
Note that you can link any step on Cytobank by copying or bookmarking the URL.
- Continuing from the experiment summary for the “Welcome to Cytobank - U937 dataset”, click the “Download Files” button to open the download page (Figure 1.2.1).The “Download FCS Files” button is in the upper left menu of the experiment summary page. There is also a “Download Files” at the top of the list of files within the experiment summary page.
- Once on the download page, click “Browse for Folder…” and follow the instructions within the download page to navigate to a folder on your personal computer where you will store the files from this experiment.The “Browse for Folder…” command is used to select the target folder on your computer for the files you are downloading. You cannot download files until you select a folder.To make it easier to find this folder, make a new folder on your computer’s Desktop and store the files there. After clicking “Browse for Folder…”, click the Desktop button to navigate to your computer’s Desktop.To make a new folder, click the New Folder button and give the folder a name.Choose this newly created folder on your Desktop by pressing “Open”. This will select this folder as the download target and store the downloaded files there.
- After picking the destination folder, click “Download Selected Files” to begin downloading.The buttons will grey out and the download progress bar will begin to fill to 100%.Once the download bar reaches 100%, download is complete. If you want to double-check to see whether it worked, navigate to the folder on your computer where you stored the files. You should see flow cytometry files within this folder.You now have a folder of flow cytometry files that you can use in the next section, which describes the steps to upload a data set to the Cytobank web repository.
Figure 1.2.1.
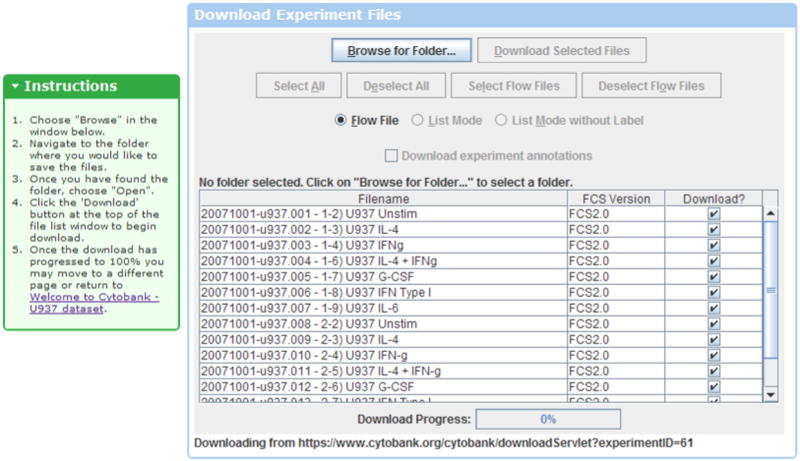
Downloading files from Cytobank. To download files from Cytobank, click the “Download FCS Files” link and follow the instructions to select a folder on your personal computer and start the download. This download will retrieve entire files in FCS or text format. Download of gated subpopulations can be done from within illustrations. https://www.cytobank.org/cytobank/experiments/61/download_files
Uploading Data to Cytobank
Materials
A folder of flow cytometry files from an experiment
Optional: Any software compensation files
- Optional: Any control files or past experiment files for comparisonFor the example experiment “Welcome to Cytobank - U937 dataset,” no software compensation files or controls files are necessary. You only need the set of flow cytometry files downloaded in the last step, “Downloading a Public Dataset.”
Arrange a folder containing the files to be uploaded on your personal computer. For this example, use the files from the U937 experiment downloaded above.
-
Go to the Cytobank Inbox and choose “Create a New Experiment” from the menu on the left. This opens a form where you describe some basic features of the experiment you are uploading (Figure 1.3.1).
Once you have filled in the form describing the details of the experiment, press “Continue” to open the file upload page.
Click the button labeled “Browse for Folder” within the upload page to open a dialog to identify the folder of flow files you want to upload.
Choose the folder of files from the U937 experiment downloaded in the last protocol section. Upload will begin and you should see the progress bar start to fill towards 100%. Once the progress bar reaches 100%, file upload is complete (Figure 1.3.2). You will be taken to a page where you verify file upload, categorize files, and check staining panel information.
- First, check to see that all of your files were uploaded and are readable. Scroll down the page, and you should see a scatter plot (Forward Scatter vs. Side Scatter) for all of the files in your experiment.Following data upload, you are taken automatically to a page asking you to verify that Cytobank has properly read and categorized your files. Typically this step is just a formality and you can move on to either the experiment summary or illustration page.
- Second, scroll back to the top of the page and check to see that your files are categorized correctly. There are three categories: 1) experimental files, 2) compensation files, and 3) other controls. To continue to the next step, click on “View Experiment Summary”.Most files are “Experimental” files – these are the files that you will see in illustrations. “Compensation control” files are used to calculate a software compensation matrix. “Other controls” is a general category that might include beads, lyocells, or duplicates of experimental files.To re-categorize files, select the files to be moved in the list and then choose from the drop-down below the category into which the files should be moved.
Figure 1.3.1.

Creating a new experiment on Cytobank. Prior to upload, organize your files into groups by experiment. You give each experiment a name and can assign it to a project. You also describe a short purpose for the experiment. These details can be searched later, if you are trying to find an experiment. https://www.cytobank.org/cytobank/experiments/new
Figure 1.3.2.

Successful file upload. Following file upload, you should see this message and links to either start an illustration or view the experiment summary page. Below the message you will see your files categorized and a plot of Forward and Side Scatter for all the files to make sure each file is readable.
Checking Channel Naming
Materials
A freshly uploaded flow cytometry experiment on Cytobank
If you are following this as a tutorial using the “Welcome to Cytobank - U937 dataset” experiment, the automatic channel names and panel assignments are correct and you can skip to the last step, which is to click “View Experiment Summary” link shown in Figure 1.3.2.
- To edit channel descriptions (i.e. edit the “channel long name”), in the Experiment Summary page scroll down to the file list and click a panel name (e.g. “Panel 1”). Then click the channel long name to get a cursor and then edit the name. Once you press enter or click somewhere else, the new name will be saved.Files with all the same channel names are considered to be on the same “Staining Panel”. If there are differences in what was measured on the channels for some files, they should be moved to a new panel and the channels renamed to indicate these differences. Note that renaming the channel names in Cytobank does not alter the FCS file. The original FCS files are never modified by any action performed within the software.
To change panel assignments for a set of files, highlight those files and then use the drop-down labeled, “Move files to…” to select and panel and move the files onto it.
To create a new panel for files where you can enter new channel names, type the name of the panel into the “Add Panel(s):” text box and press enter. You can create multiple panels at once by entering a comma-separated list of names.
- Once the channel names and panel assignments are correct, click “Finished, show experiment summary” to continue to the experiment summary page. Upload is now complete.The file categorization and channel name editor can also be accessed from the experiment summary page and the illustration page. Within the experiment summary page, look for the FCS Files section and click on the panel assignments under the Panel column. From within the working illustration view, click the “Edit” button within the Channels box at the top of the page.
Cloning an Experiment
Materials
An experiment on Cytobank for which you have cloning access rights
Cloning an experiment creates a copy of the experiment that you can fully control. This process essentially duplicates file download and file re-upload in one step.
By default, cloning copies an entire experiment – annotations, illustrations, compensation, and gating. As an alternative, you may click on “Clone FCS Files,” which will create a fresh experiment consisting of just the files and experiment description entered during upload.
For this protocol, we will use a new demo dataset called “Phospho-Flow Cytokine Titration” available at https://www.cytobank.org/cytobank/experiments/310
Navigate to the Cytobank inbox and look for the titration experiment entitled “Phospho-Flow Cytokine Titration”. If you don’t see this experiment in your Inbox, click “Public Experiments” to filter the Inbox to just show a set of publicly available experiments.
Click the “Phospho-Flow Cytokine Titration” experiment in the Inbox to open it. Look in the upper left for the “Actions” area, which includes the cloning controls.
Optional: At this step you can choose whether to clone with “files only” or not. For this demonstration clone the entire experiment. We will clone just the FCS files later in the gating protocol (Alternate Protocol 2).
- Click the “Clone Experiment” button. This will create a copy of the experiment. The experiment will have the same name, but it will include “(Clone)” at the end of the name. In addition, you will have full control of the experiment – you can share it, make it public, and enable or disable features like cloning.Since we cloned the full experiment, including analysis, file categorization and other analysis steps are complete already.
Once you clone the experiment, click “Edit Experiment” in the Actions menu on the experiment summary page for the “Phospho-Flow Cytokine Titration” experiment. This will open a page allowing you to edit the basic information associated with this experiment.
Edit the Experiment Name to be “Phospho-Flow Cytokine Titration – for phospho-flow analysis”. Note that when you clone the experiment, “(Clone)” is automatically added to the Experiment Name.
Edit the comments section to say, “Using this clone to learn how to analyze phospho-flow signaling experiments.”
- Once you are done editing the basic experiment details, click “Update” at the bottom and then click “Back to Experiment” in the upper left.Note that you also cloned all the illustrations for this experiment – including contour plots, heatmaps, and histogram overlays – and the annotations and gates used to create them. You may open these illustrations by clicking their titles from the experiment summary page. In Alternate Protocol 1 you will make these three illustration types.
ANALYSIS OF PHOSPHO-FLOW SIGNALING EXPERIMENTS
Alternate Protocol 1 describes the creation of three common flow cytometry illustration types: contour plots, histogram overlays, and heatmaps.
Creating Contour Plots
Materials
A phospho-flow signaling experiment on Cytobank.
It is recommended that you follow the steps above for cloning an experiment (with analysis). This will create a copy of “Phospho-Flow Cytokine Titration” experiment, which we will use as the example below.
Your “working illustration” is like a drawing board where you can create different views of the experimental data. When you have a view you like, you can give it a title and save it as an illustration, which is static. Each user who can create illustrations has their own dynamic working illustration.
If you are working with the cloned copy of the “Phospho-Flow Cytokine Titration” experiment, the annotations for the doses have already been entered. You will just need to activate that dimension to begin using it. The cell type gates have already been created, too.
Editing a saved illustration by clicking the illustration name or clicking “Edit” opens it into your working illustration view, which allows editing and saving as a new illustration. In contrast, clicking the “Print View” or the PDF of a saved illustration opens a static, printable version of that illustration (without changing the contents of your working illustration).
- Open the experiment summary page for your cloned copy of the “Phospho-Flow Cytokine Titration” experiment.Note that you can see three saved illustrations and your working illustration. If you can’t see three saved illustrations, create a fresh clone of “Phospho-Flow Cytokine Titration” experiment, as described above, and make sure you choose “Clone Experiment”.
- Click on your Working Illustration to start a fresh working illustration. This will open the illustration page, which has three main sections.The top section is used to select data to show in the illustration. The bottom section displays the figures or placeholder images (for quick re-arrangement of large figures). The left section is used to style the displayed plots and change the type of illustration. Note that you begin with an illustration showing scatter plots of all your experimental files.You will still have experiment detail annotations and gates that were created when the experiment was cloned.
First, edit the type of plots shown. In the Plot Controls section of the left menu, click the plot type selector and choose “Contour”. Then click “Update Illustration” (in the top left of the screen) to refresh the view of the plots to show contour plots instead of the default “Density Dot” plots.
- Next, change what is displayed on the x and y axes. The default is Forward and Side Scatter. In the Plot Controls section, change this the “Y-Axis” to “p-STAT5 Ax647” and the “X-Axis” to “CD4 FITC ”.At this point you could click “Update Illustration” to see the changes, but we will now make several changes and then update once at the end.
Change the size of the plot to make more plots fit into the view. In the Plot Controls, set the “Plot Size” drop down to “96 px”.
Filter to show the “CD3 T cells” using the “Populations” menu in the top of the page. Click the “CD3+ cells” entry in the population list.
- Finally, click “Update Illustration” to get a view of the plots with these new settings.Looking at the illustration, we see that the figure is close to what we would like to see, but the plots are not labeled and might not be in the order we would like. To label the plots, we use experiment variable annotations which describe how the plots differ from one another. In this case, the major differences are how the cells were stimulated (Conditions) and the dose of the stimulus (Doses).
Activate “Dosages” by clicking this button at the top of the page. A box with the list of titration doses will appear, and all the doses will be selected. Click Update Illustration” to refresh the view.
As with Dosages, activate Individuals and filter to Donor 1 by clicking this item in the list.
In the Channels box at the top of the page, choose “p-STAT5 Ax647…” from the list.
In the Plot Controls section, change the “Y-Axis” to “Use Panel/Channel Values”. The Y-Axis on your plots are now determined by the channels selected in the Channels box.
- To show the Doses in columns, drag and drop the orange Dosages box all the way to the left of the Channels (Figure 2.1.1), then click Update Dimensions.Note that there are two areas labeled Dosages – a button at the top of the page and a box with the title Dosages and space for a list of Dosages. The lower box can be dragged to re-position Dosages (or any other dimension) within the illustration layout.
- Finally, click “Update Illustration” to refresh the view. Your Unstim control may be a the right of the display. If so, you can click on the black “Unstim” label above the plot and drag and drop it on the left (drop it on top of “100 ng/mL” at the left). This will reorder the plots. After clicking “Update Illustration”, your controls and illustration should look like those in Figure 2.1.1.This finishes the creation of a simple Contour Plot view of the data. This is a good time to give your working illustration a title and save it as a (finished) illustration. This will allow you to open a print view or download a PDF of the illustration.
- To save the illustration, look in the upper left corner above the Plot Controls, enter a title in the text area following “Save Illustration As:”, and then click “Save”.You might title this “Contour plots of IL-2 signaling in CD3+ T cells.” After you save the illustration, you and other users will be able to see it from the experiment summary page. To return to the experiment summary page and view your illustration, follow the “Back to Experiment” link in the upper left of the screen.
Figure 2.1.1.
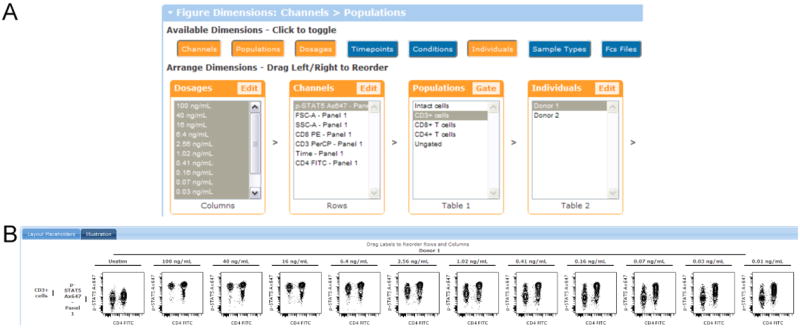
This figure shows the configuration of the controls and the resulting contour plot illustration at the end of the Contour Plot protocol. (A) Configuration of the controls to make this illustration. All the dosages are selected and this dimension is shown in the columns. For other dimensions, just one entry is selected to keep the figure small. (B) Contour plots show an IL-2 dose response where p-STAT5 was measured in CD3+ T cells. The x-axis shows CD4 expression and the y-axis shows phosphorylation of STAT5. The doses are arranged in columns, starting with unstimulated cells, then a dose response from 100 ng/mL to 0.01 ng/mL. https://www.cytobank.org/cytobank/experiments/310/illustrations/583#Illustration
Using a Template to Create a Histogram Overlay
Materials
A gated and annotated phospho-flow signaling experiment on Cytobank which includes dosages.
This protocol describes how to create an overlay of the titrated doses for each of the measured phospho-proteins in the experiment.
Open the experiment summary view of the “Phospho-Flow Cytokine Titration” experiment.
Open your Working Illustration by clicking on its title.
- Choose “Reset Illustration” in the upper left box to start a fresh working illustration.Instead of creating an illustration from scratch, we will use a template to load a generic view of the data and then tweak it to show a histogram overlay of a cytokine titration.
- In the upper left menu, look in the Presets drop-down menu and choose “Histogram Overlay across Doses”. Click “Apply” to update the view.This will create a starter histogram overlay that may already show what you want to see. In this case we’ll customize it more below.To create a histogram overlay from scratch, you could also change the plot type to “Histogram Overlay” using the Plot Type drop down menu on the left and then edit the dimensions, as in the Contour Plot protocol.Take a moment to explore the new settings that are available on the left hand menu. You can now change the details of the histogram overlay, such as which file is the control file, or the range of the color scale that is used to emphasize differences in the shown peaks. These choices appear under the Plot Statistics and Scale Display sections of the left menu, below the Plot Controls.
- Within the Populations dimension, select “CD3+ T cells” by clicking this entry.This will filter the illustration to show just one table for the CD3 T cells.
- Within the Channels dimension, select “p-STAT5 Ax647” by clicking this entry.This will filter the illustration to show just one phospho-protein signaling response. For this experiment, p-STAT5 was measured for IL-2 stimulated samples, whereas p-STAT3 was measured for IL-6 stimulated samples. So if you make an illustration showing p-STAT3 with IL-2, you will see an empty space because there were no matching samples collected.
- If it is not already, make sure Dosages is the second dimension (in the order) by dragging and dropping the dimensions boxes at the top of the display to rearrange them.Note that at the bottom of each dimension box it tells where this dimension will appear in the illustration. For example, in a histogram overlay, the second dimension is the one that is “Overlaid”, which means that whatever is in this dimension will determine what is compared within each histogram overlay plot.Preset illustrations load settings that may or may not be ideal for your particular experiment. Once you load a preset, you should examine the illustration dimensions at the top and activate/deactivate dimensions and filter them as needed.
Move the Individuals dimension ‘in’ by one by dragging and dropping it to the left between Dosages and Populations. The order should be Channels < Doses < Individuals < Populations, as shown in Figure 2.2.1.
- Once you have the dimensions arranged as shown in Figure 2.2.1, update the illustration by clicking the “Update Illustration” button. The histogram overlay at the bottom will be updated to this new, filtered view of the data, as shown in Figure 2.2.2.The color of the peaks comes from a statistical comparison that you can customize. The default is to compare the median fold change of each peak within the histogram overlay to the first row. In this case, this compares each titrated dose of IL-2 to the unstimulated state, which is a good comparison.Note: to re-arrange the dosages within the histogram overlay, you can click the “Layout Placeholders” tab and then drag and drop the labels. This can be useful if, for example, your Unstim control is not in the first row within the histogram overlay. When you are done, click the “Illustration” tab and “Update Illustration” to see the re-arranged version.
- Export the statistics by clicking on the “Export Table of Statistics” button in the upper left of the display, near where you save illustrations and load presets.Exporting the statistics will create a text file that downloads to your computer. Within this file is information on the original experiment as well as a table of all the statistics within the illustration (Figure 2.2.3). This file can be opened directly in Excel or other programs to graph the data.
- Now that the illustration is finished, in the upper left hand menu, enter a title for the finished histogram overlay, such as “Histogram overlay comparing doses”, and then click “Save” to save and finish the illustration.Remember that you illustration is just a temporary “Working Illustration” until you save it and give it a title. Once you save, other users with access to the experiment will be able to open a PDF view of the data or print the illustration.
Figure 2.2.1.
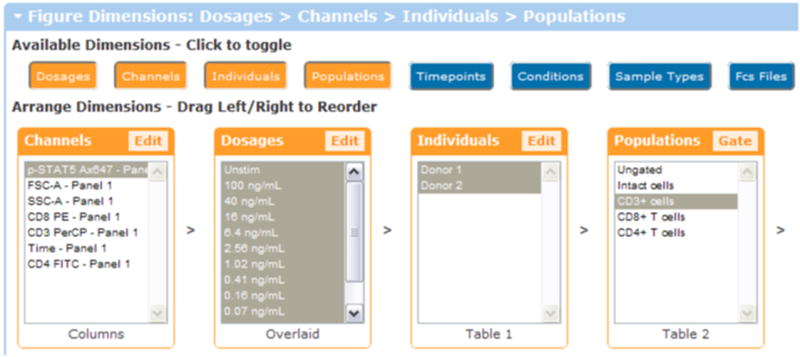
Setup of the figure dimensions for a histogram overlay comparing dosages. When the plot type is a histogram overlay, the second dimension is “Overlaid”, which means that it forms the overlaid peaks within the histogram overlay. Usually the overlaid dimension compares conditions, individuals, timepoints, or dosages.
Figure 2.2.2.
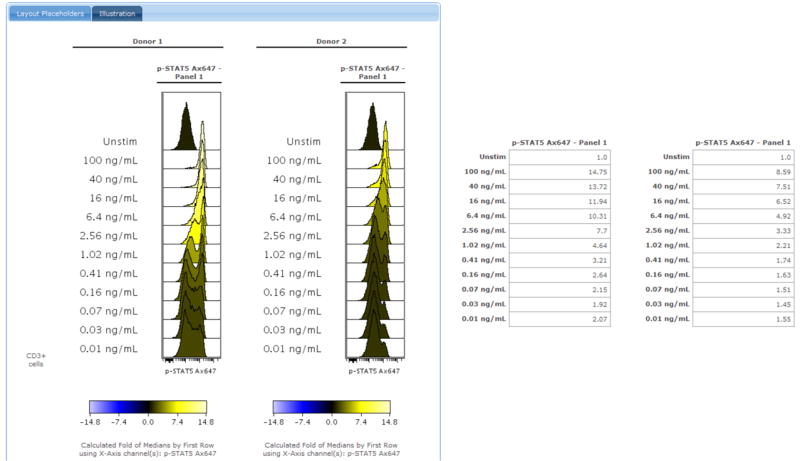
A histogram overlay showing the dose response for CD3+ T cells from two healthy blood donors. Along with the histogram overlay is a table of data showing the fold change calculations. https://www.cytobank.org/cytobank/experiments/310/illustrations/584#Illustration
Figure 2.2.3.
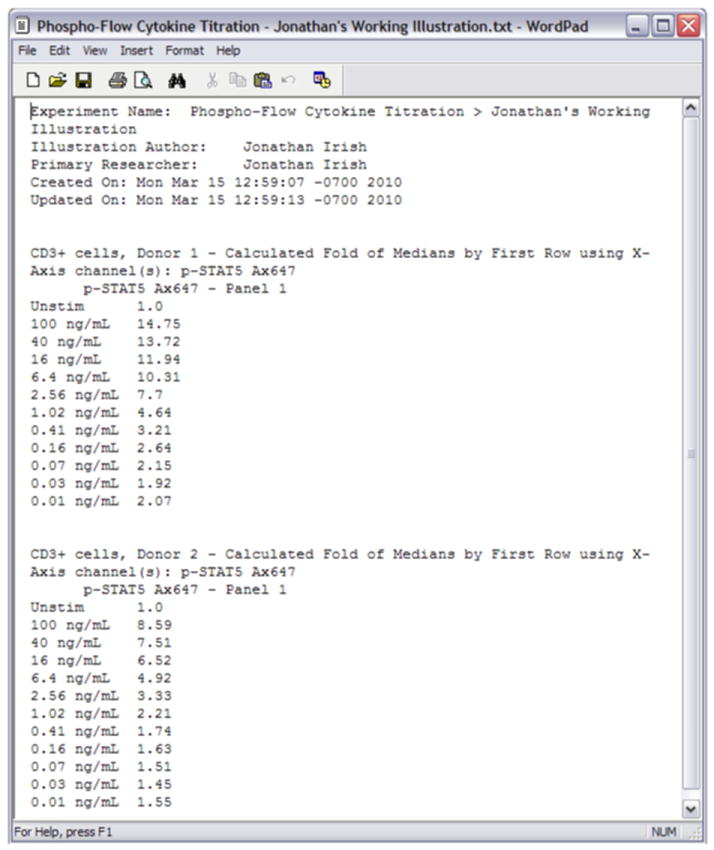
A table of fold change statistics exported from Cytobank. This table of statistics compares the median fold change of each peak of CD3+ T cells stimulated with a different dose of IL-2, relative to the unstimulated state.
Creating a Heatmap from a Histogram Overlay
Materials
A histogram overlay illustration of a phospho-flow signaling experiment on Cytobank.
This protocol describes starting a heatmap illustration based on a histogram overlay illustration.
Open the experiment summary view of the “Phospho-Flow Cytokine Titration” experiment.
Open the histogram overlay view of the experiment you created in the last section or the pre-existing histogram overlay figure that was cloned with this experiment (called “Histogram overlay showing fold change for a titration of IL-2 in healthy PBMC T cells”) by clicking on the title.
- In the upper left menu, change the Plot Type to “Heatmap” and then click “Update Illustration”.The settings for histogram overlays and heatmaps are controlled the same way. A heatmap shows the same colors as are used to shade the peaks of the histogram overlay in the same order.
Drag and drop Channels to the third spot in the dimension order (Table 1), so that the dimensions controls appear as in Figure 2.3.1 and then click Update Illustration.
- Open the Plot Statistics section on the left and set the Equation to “Fold” and the Control to “First Column”.This tells Cytobank to compare the fold change of the median in each heatmap square against the median value in the first column (the unstimulated control). Note that the statistic type is “Medians”.
- Move the mouse over a square of the heatmap in order to see a view-through to the underlying data (Figure 2.3.2).The view-through shows the underlying data. The representation of the underlying data is controlled using the Plot -Controls in the left menu.
In the upper left hand menu, enter a title for the finished heatmap, such as “Heatmap comparing doses”, and then click Save to finish this illustration.
Figure 2.3.1.
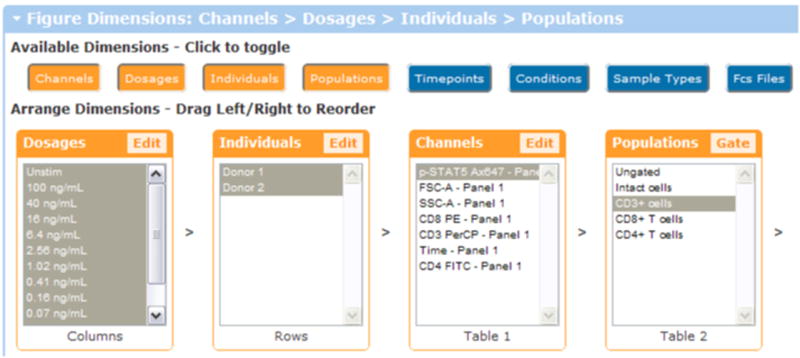
Order of the dimension controls to create a heatmap of doses. For a heatmap, we moved the dosages into the columns and the individuals into the rows.
Figure 2.3.2.
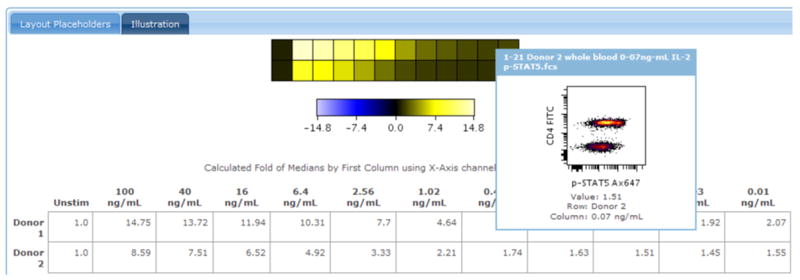
Placing the mouse over a square of a heatmap shows a view of the underlying data. Shown here is a heatmap view of the dose-response experiment. The user moves the mouse over one square for 0.07 ng/mL IL-2 in Donor 2, showing a 2D density dot plot view of the data used to generate the statistic in that square. This type of view through keeps users connected to the data, while also providing a high-level summary of the results. https://www.cytobank.org/cytobank/experiments/310/illustrations/585#Illustration
Viewing and Printing a PDF of an Illustration
Materials
A saved illustration on Cytobank
Once an illustration is given and title and saved, you can view a PDF for printing or storage on your personal computer.
From the experiment summary, locate the PDF icon next to a saved illustration and click it. This will open a new window or tab containing the PDF.
To print, click the print icon in the upper left hand corner.
To return to the experiment summary, close the window or tab that contains the PDF.
Attaching Files to an Experiment in Cytobank
Materials
A phospho-flow signaling experiment on Cytobank.
If you have analyzed a phospho-flow experiment in another program, you can attach this analysis to the experiment on Cytobank containing the original files. This way, the analysis file(s) and the original FCS files will not be separated and can be shared with colleagues, published, and downloaded on any computer.
- Open the experiment summary page for an experiment on Cytobank, such as the “Phospho-Flow Cytokine Titration” experiment.Make sure it is your clone of the experiment or another experiment where you will have access to add attachments.
Look for the section in the middle of the page labeled “Attachments”. If the title bar is collapsed, open it by clicking the small triangle next to the title “Attachments”.
Click, “Browse” to open a dialog box and select a file on your computer.
Once you have selected the file and the dialog is closed, click “Upload” to begin uploading the file to Cytobank.
Once upload has progressed to 100%, file attachments will be view-able within this Attachments section of the experiment summary page.
ANNOTATING AND GATING EXPERIMENTS
Alternate Protocol 2 describes how to use the gating tool on Cytobank to identify cell Populations and how to annotate experiment details while creating illustrations. It also describes how to clone an experiment without annotations. We recommend continuing to use the “Phospho-Flow Cytokine Titration” experiment and to do this step after becoming familiar with the experiment by following the protocols above.
Cloning an Experiment with Files Only
Materials
An experiment on Cytobank
Cloning an experiment creates a copy of the experiment that you fully control. This process combines the download and upload procedure into one step.
Here we will choose to clone an experiment with “files only”, which just copies the files and lets you re-do the analysis from scratch.
Navigate to the Cytobank inbox, look for the titration experiment entitled “Phospho-Flow Cytokine Titration”, and click the title to open the experiment summary page for this experiment.
In the upper left of the experiment summary page below the title “Cloning/Copying” click the link to “Clone FCS Files”.
You may wish to edit the file categorization and channel assignment, as described in “Checking Automatic File Categorization and Channel Naming”.
Drawing Gates to Identify Cell Populations
Materials
An unanalyzed phospho-flow signaling experiment on Cytobank.
- Ability to run Java applets in your web browserNote that if your experiment was part of a kit, such as the T-cell kit, gates will be drawn automatically for you. You can still follow this protocol to check and edit the gates.
- Starting from a fresh clone of the FCS files from the “Phospho-Flow Cytokine Titration” experiment, open the experiment summary view and click on your Working Illustration to start a fresh working illustration. This will open the illustration page.For more detail on this step, follow the protocol above for cloning an experiment with annotations and creating a contour plot illustration.
- Open gating by clicking on “Gate” within the Populations box at the top of the page.For some new experiments, the Populations box should display text indicating that you need to draw gates. If gates have already been drawn (e.g. with kit experiments), then you will see a list of populations and the “Gate” button will be available. Click whichever of these two buttons is available to open the gating interface.A gating program will load within the page. You need to have Java installed to use this program.
- To draw a new gate and define a population, click on the Polygon gating tool at the top of the gating program. Then click a series of points to draw a polygon. For now, draw an “Intact Cells” gate on Side Scatter vs. Forward Scatter, as shown in Figure 3.1.1.You may need to change the x and y-axes using the drop down menus next to the plot in order to see the scatter channels.When you close the shape, a dialog box will ask you to name the gate. Call this gate “Intact Cells” or something similar.
- To check that the gate “fits” all the files, click on the gate name in the list of gates, then click the “Check Gate” button. This will open a view of this gate across all the files where it exists, as in Figure 3.1.2.It is possible to create Stand Alone Gates in Cytobank, where a gate is one entity but has a different shape on each file. To do this, simply toggle the gate type to “Stand Alone” from the default of “Global”. Global gates are the same on all files. We recommend using Global gates whenever possible.
- Close the Check Gate view and then ‘drill down’ into the Intact Cells population by double-clicking on the “Intact Cells” gate.Double-clicking a gate activates it as the current population – also called ‘drilling down’ into that population. Until you activated the Intact Cells gate the plot showed all events (ungated data).Note that the active population changes in the drop down menu as you drill into each new population you create. You can navigate “up” and “down” the tree of populations using these buttons under the active population control.
Now add a CD3+ cells gate within the live cells population and then CD4+ and CD8+ gates within this population. To do this, repeat the steps above.
- To draw gates on contour plots, click the “Plot Settings” button and change the plot type to “Contour Plot”.Changes made to the plot settings here or in the illustration page will be reflected in the other pages on Cytobank.Plot Settings also allows you to change other details about the appearance of your plot, including the scale min and max (in case data are off the edge of the plot). These changes can also be made from the illustration page.
View a tree of the populations by clicking “View Populations” at the lower left (Figure 3.1.3).
- When you are done gating to identify these populations, return to the illustration page by clicking “Save and Return”.Gates and populations are automatically saved, although if you close the browser window the last action you took may not be saved.When you return to the illustration, the populations you created by gating will be available for selection within your illustration. Selecting multiple populations at once allows you to compare these populations in a layout.
Figure 3.1.1.
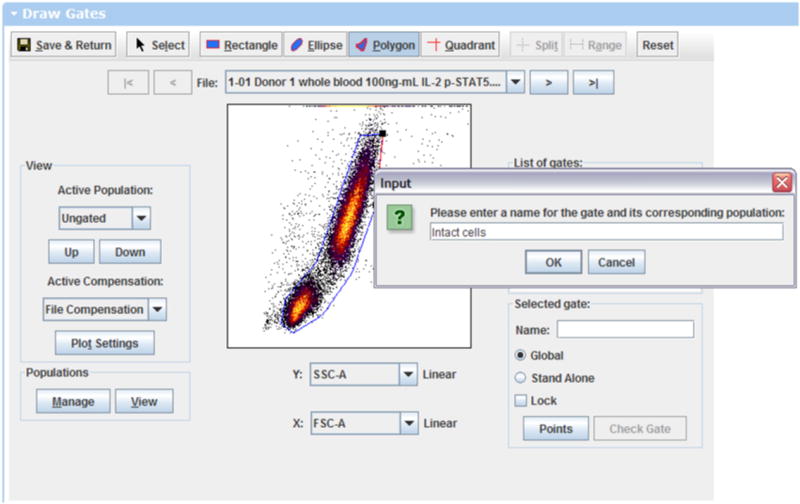
Web based gating. This figure shows drawing a polygon gate around intact cells using a plot of side scatter vs. forward scatter. https://www.cytobank.org/cytobank/experiments/310/draw_gates
Figure 3.1.2.
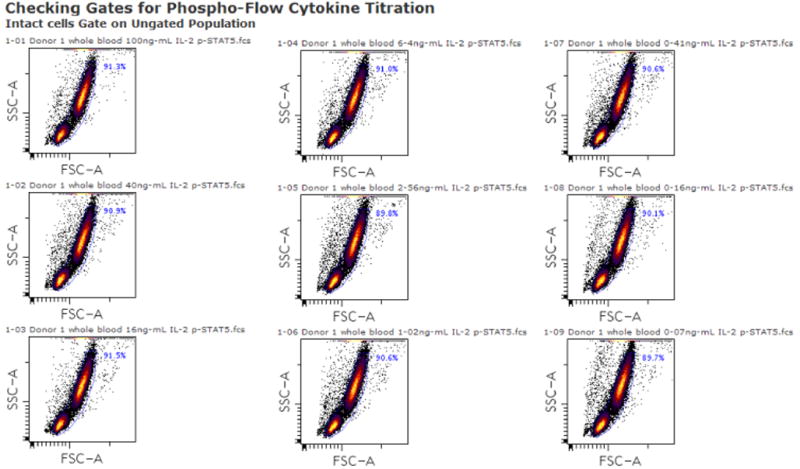
An automatically generated layout checking whether the Intact Cells gate ‘fits’ for all of the files in the Phospho-Flow Cytokine Titration experiment. In this case, one global Intact Cells gate is a good fit for all the files and identifies ~90% of the events as intact cells in all the files. https://www.cytobank.org/cytobank/gates/check_gates?experimentID=310&gateID=1&populationID=0&plotType=14
Figure 3.1.3.
A hierarchy of the populations of cells present within the peripheral blood samples from the Phospho-Flow Cytokine Titration experiment. This figure is a composite of two figures created on Cytobank – the Cell Populations hierarchy is viewable within gating and the gating hierarchy plots are available within the illustrations by opening the “Gating Hierarchy” panel below the Figure Dimensions.

Annotating Files with Experiment Details
Materials
A phospho-flow signaling experiment on Cytobank where experiment variables have not yet been annotated.
- Continuing with analysis of the “Phospho-Flow Cytokine Titration” experiment, open your Working Illustration.At the top of the page are “Available Dimensions” which are blue, meaning that they are not yet activated. In this experiment, we stimulated cells from two different patients with several doses of IL-2. In order to display this as a figure, we should identify the files from the two patients and from the different titration doses of IL-2.
- Click “Individuals” to activate this dimension (Figure 3.2.1) and then click “Click to Edit” to open the annotation page and specify which samples came from which individual blood donors.The files in this experiment came from two healthy blood donors labeled “Donor 1” and “Donor 2” in the filenameText within the filename or sample ID will be identified during annotation.
After opening the annotation page for Individuals you will see a list of all the files in the “Untagged” column and a space in the upper left of the page in the “Create Individuals” box where you can enter text. Type in “Donor 1, Donor 2” here, as shown in Figure 3.2.2, and then click “Add” to search for files matching these tags.
- Double check that the files have been assigned correctly, and then click “Return to Illustration”.If files are incorrectly assigned, you can drag and drop them into other categories. Files that are not in any category will not appear in illustrations.You can add a new annotation any time (e.g. if there were a Donor 3).
You may need to select a channel in order to see plots. If so, click one of the channels within the “Channels” dimension and then click the text to update the illustration plots.
Now follow the same procedure for annotating the dosages. Click “Dosages” from the illustration page to activate this dimension, then click “Click to Edit” to begin annotating.
Because the cytometer software cannot collect files with a “.” or a “/” in the sample ID or filename, dosages such as “0.01ng/mL” have been annotated as “0-01ng-mL”. Enter the following text as the list of dosages: “Unstim, 100ng-mL, 40ng-mL, 16ng-mL, 6-4ng-mL, 2-56ng-mL, 1-02ng-mL, 0-41ng-mL, 0-16ng-mL, 0-07ng-mL, 0-03ng-mL, 0-01ng-mL”
The dosage annotation for the “Phospho-flow Cytokine Titration” will be incorrect for 0.16ng/mL and 16ng/mL. Drag the 16ng/mL files out from the 0.16ng/mL column and into the 16ng/mL column.
- To edit the name of an annotation, click the white text within the light blue box for that annotation, and then click the editable bold black text. You can then edit the tag – for example, you could edit “6-4ng-mL” to be “6.4 ng/mL”.Make sure to click the name at the top of the box surrounding the tagged files. The tab at the top of the page allows you to view just one entry at a time, but is not editable.
Once you are finished, click “Return to Illustration”.
Now that your experiment is annotated, try re-arranging the plots and editing the plot settings to make an illustration, as described in Section 1 above.
Figure 3.2.1.
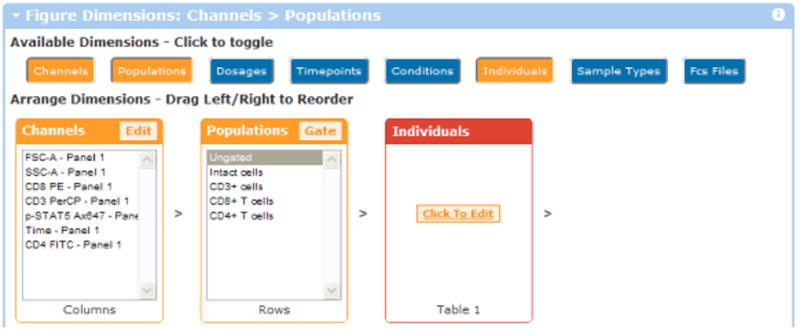
Clicking the “Individuals” button activates this dimension for annotation. The dimension is initially red, indicating that files need to be annotated for “which individual this file matches”.
Figure 3.2.2.
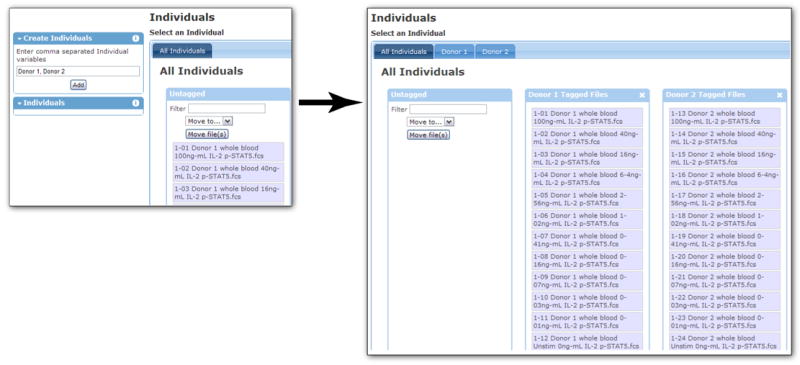
Annotating information about ‘Individuals’. The tags “Donor 1” and “Donor 2” are entered as a comma-delimited list into the Individuals annotation page. This creates two individual entries (Donor 1 and Donor 2) and looks for files with matching text in the filename or sample ID.
SHARING ILLUSTRATIONS AND DATA WITH COLLABORATORS
Alternate Protocol 3 describes how to use Cytobank to share experiment illustrations – with or without data file access – with collaborators. This protocol also describes how to organize several experiments into a Project that can be used to manage sharing for all the associated experiments.
There are two general types of experiment sharing on Cytobank: direct sharing and project sharing. Direct sharing gives a user access to a single experiment. Project sharing gives a user access to a project, which may contain several experiments.
When sharing an experiment, users may be granted or denied permission to edit the basic experiment details, clone the experiment, create illustrations, further share the experiment, and/or download files.
Note that if you give a user the ability to clone the experiment, they will have full control of any clones that they make.
To obtain an experiment that you are able to share, you can make a clone of one of the tutorial experiments, such as the “Phospho-Flow Cytokine Titration” experiment. If you already have one or more clones of this experiment, you may use them for this section.
Granting a User Full Access to a Single Experiment
Materials
An experiment on Cytobank for which you have sharing permission
The primary researcher can always share an experiment.
To begin, navigate to the experiment summary page for an experiment on Cytobank. For more detail on using the Inbox and opening experiments, refer to the protocols above.
Within the experiment summary page, look for the “Sharing Permissions” section on the left hand menu near the middle.
Within the text area following “Share with a User (Full Access): “, begin typing the name of someone you would like to share the experiment with. If you don’t know anyone using Cytobank, you can type “Nikesh Kotecha” to share your experiment with one of the original Cytobank developers.
- Once you have entered the name of a Cytobank user, click “Share with this User” to complete sharing the experiment.To remove access for a user, click the “Remove Access” button next to their name.
- Sharing an experiment directly this way gives a user full control of that experiment.In order to manage what users can and cannot do with an experiment, you can share one or more experiments in a Project, as described below.
Creating a Project and Managing User Access by Project
Materials
An experiment on Cytobank for which you have sharing permission
Projects are a way to organize sharing and access for sets of experiments you want to share together. You can place several experiments on a project and then give a user access to all of them simultaneously. As you collect new data you can add experiments to this project and users with access to that project will also see the new experiments.
If you just want to organize and label your experiments, you can use labels, which do not control sharing. Projects are more like folders (one experiment goes in one project), whereas labels are more like tags (one experiment can have many labels).
If you want to get the data from an experiment into a second project, you must clone the experiment (or re-upload the data) and place the copy of the data in the second project.
Navigate to your Cytobank inbox and locate the Manage Projects section on the left menu.
Click “Manage My Projects”. On the next screen, under “Actions” click “New Project” to create a new project.
- Fill out the form, entering a name for the project (that will show up in the Inbox) and a description. You might call your project “Current Protocols” and use it to organize the experiments in this protocol.The sharing level sets whether other users on the project can create illustrations of their own or just view the illustrations you have created.The cloning level sets whether other users on the project can clone the experiments in it. Remember that cloning access gives users complete control of the data. You may allow users to clone just the files or both the files and the illustrations.Once you create the project, you will see that you are a Manager of the project. Managers set the illustration creation and cloning permissions and can invite other users to the project.
- After creating the project, click “Back” to see the list of all projects.You can also get to this list from the Inbox by clicking “Manage My Projects” in the Manage Projects box to the left.
- From the projects list, click “Edit” for the Current Protocols project you just created.Here you can edit the name and description, as well as set who the managers, leaders, and members of the project are.Managers control access to the project. You probably want to keep the number of managers small – perhaps just you.The project leader is marked within the project as a leader, but does not gain special access settings automatically. This is a good way to indicate “whose project this is” when it is someone other than the project manager.Project members inherit the access rights you specified for sharing and cloning levels.
Once you finish updating the project, click “Update”.
Click the title of the “Phospho-Flow Cytokine Titration” experiment in the Inbox to open it.
Click “Edit Experiment” in the left menu bar.
Under the Project drop-down, select “Current Protocols”.
PUBLISHING EXPERIMENT DATA AND FIGURES
Alternate Protocol 4 describes how to publish an experiment on Cytobank, allowing others to download the files associated with the experiment and/or view the experiment’s illustrations.
Making an Experiment Public
Materials
An analyzed experiment on Cytobank
Note that you can analyze experiments on Cytobank using the illustration system or in another program on your personal computer. If you analyze experiments on your computer, just upload the analysis files as Attachments in the experiment summary page, as described in the protocol above.
Open the “Phospho-Flow Cytokine Titration” experiment.
Check that your experiment is well annotated. If necessary, edit the basic experiment information by clicking “Edit Experiment”.
Upload any analysis attachments (e.g. a PDF of a published paper, a PPT slideshow of the data), following the protocol above.
Double check that any illustrations you made on Cytobank look good, and that you’re satisfied with the Compensation and Gating, channel labeling, and annotations.
- Once you are happy with the experiment, click the “Share with Everyone” button on the left of the experiment summary page, in the Access section.This section toggles the status of your experiment between public and personal. Personal experiments are shared using projects or directly, whereas public experiments are shared with everyone who is registered on www.Cytobank.org.
INITIATING NEW ANALYSIS OF A PUBLISHED DATASET
Alternate Protocol 5 is aimed at a statistical and computational biology audience and describes how to obtain a set of data and annotations from a public Cytobank experiment in different formats.
Downloading Gated Flow Cytometry Data in FCS Format or as TAB-Delimited files
Materials
An experiment on Cytobank with sufficient access to create or edit an illustration
This protocol describes how to download gated files as flow cytometry standard (FCS) files, which can be analyzed in other flow cytometry analysis programs. The original files from an upload can always be downloaded using the steps outlined in the Basic Protocol.
Open the “Phospho-Flow Cytokine Titration (Clone)” experiment.
From the experiment summary page, click “Edit” on a saved illustration or on your working illustration.
Make sure the Populations dimension is active and the population(s) you want to export (e.g. T-cells) are selected. You will have to update the illustration to apply any changes.
To export as FCS files “Export Gated FCS Files”
A new browser window or tab will open with the message “A zip file of the FCS files contained in this illustration is downloading…”
Choose the appropriate location to download and extract this zip file.
Click on “Export Table of Events” if you prefer to get the gated flow cytometry data as TAB-Delimited files.
Each file is named according to the annotations specified in Cytobank.
COMMENTARY
Background
The Cytobank approach grew out of the need to collaborate on clinical flow cytometry data sets and follow a line of investigation from a patient sample, through the cutting edge molecular analysis, to arrive at a straightforward clinical summary. This approach was motivated by the existence and success of efforts like the gene expression omnibus (GEO) and the Stanford microarray database (SMD) – an online repository of published micorarray data. Infrastructure such as the ones developed for GEO (Barret et al, 2009) and SMD (Demeter et al, 2007) show that the storage and efficient retrieval of large amounts of data can be managed in a web-based manner. However, current methods in flow cytometry analysis rely on several manual steps for identifying populations of interest and capturing them is an important aspect for understanding or repeating analyses. As such, Cytobank allows for facile switching between the raw underlying data and aggregate displays or statistical readouts. This approach reduces errors and makes flow cytometry analysis more transparent and convenient. Additionally, the ease of looking at raw data coupled with the ease of generating analyses will encourage researchers to look at more parameters and therefore perhaps discover new patterns in the data. The hope is that tools like Cytobank will lead to a general call for access to dynamic visualizations of primary data in collaborations and publishing.
Need for New Software Tools
New ‘single cell proteomics’ flow cytometry techniques, such as phospho-specific flow cytometry (Krutzik and Nolan 2003), clinical signaling profiles (Irish, Hovland et al. 2004) and fluorescent cell barcoding (Krutzik and Nolan 2006), have especially highlighted the need for a new analysis paradigm that integrates statistical meta-analysis techniques into the standard workflow.
The protocols here describe techniques for web-based flow cytometry data analysis and publication using examples from phospho-specific cytometry analysis of intracellular signaling. The rapid expansion of flow cytometry research applications – from stem cell immunophenotyping, cytokine expression, and analysis of cell cycle, calcium flux, apoptosis and proliferation to measurements of cell signaling and clinical risk stratification – has far outpaced the development of storage, analysis, and data representation tools (Irish, Kotecha et al. 2006). Users now need to be able to share figures and summaries with other scientists who can re-evaluate the data and bring additional clinical, biological, and statistical perspectives to bear on experimental results. These collaborators might be down the hall or in another country.
In addition, to computationally model flow cytometry data (Sachs et al, 2005) and compare results with other systems biology datasets, there is a need to annotate processing steps, including compensation, scale transformations, and gating, and details of experimental design so that this information is electronically available and clear to researchers who did not conduct the original study. As was previously the case in gene expression profiling, there is now a need for online public flow cytometry data repositories that integrate multiple steps of analysis so that scientific conclusions are linked to the raw data.
Educating Novice Users
The expansion of flow cytometry into new applications has resulted in a growing base of users who are challenged with understanding both the experimental protocols for generating the data and the analytical approaches to glean insight from the data. The latter especially can be difficult given the fragmented nature of analysis discussed above. As such, users are often focusing on how to do a particular analysis rather than on the biological or clinical implications of the results. We are often surprised by how many more times we are asked about a particular figure or analysis displayed in a presentation than about the underlying novel biology. The Cytobank platform makes these tools available to the community in a way where educators and trainers can disseminate tutorials for beginners. A beginner can “clone” a tutorial experiment and replicate the analysis shown. The trainer, in turn, can work interactively with that beginner to help overcome the hurdle in analysis.
Lowering the barrier for interdisciplinary research
There is a large amount of ongoing work in developing analysis and visualization methods of large data sets especially with microarray and genome wide association studies. These methods can also be applicable to flow cytometry but are currently hampered by the need for bioinformatics specialists and statisticians to learn about flow cytometry pre-processing and normalization steps, such as gating and compensation, before they can mine for relationships. Lowering this barrier and inviting new perspectives is paramount for handling the large amounts of data generated in cytometry.
Providing Cytobank as a platform to build new analyses or integrate with existing statistical frameworks (Hahne et. al 2009, Frelinger et al 2008) can help in lowering this barrier by enabling biologists and clinicians to do a first round of processing and sharing with statisticians a data set they can start to work with but also contains links to the preprocessed steps and underlying raw data.
Members of the flow cytometry community can build upon the core framework of Cytobank to include the latest statistics and visualizations appropriate for flow cytometry analysis. Documentation and developer support is provided at http://docs.cytobank.org.
Towards a public repository for flow cytometry
Web-based storage, analysis, and publication of flow cytometry data creates new opportunities for collaboration and generates online repositories of annotated data. In turn, sharing such annotated datasets propels the integration of flow cytometry into the ongoing expansion of computational and systems biology. Why is it not possible to click on a published flow cytometry figure to re-open the data and explore the results in light of a new question? Combining online storage and analysis tools makes this type of ongoing meta-analysis possible and creates the opportunity for researchers to derive deeper meaning from published datasets. Networking datasets also sparks collaborations, as primary data are shared between groups doing basic, clinical, and computational research. Annotated web repositories are especially useful for systems biology experiments that combine flow cytometry results with data collected using other platforms (e.g. gene expression profiling), as they enable the use of search features, controlled vocabulary, ontologies, and data integration. This will be crucial as the scope of flow cytometry experiments expands towards single cell proteomics.
CRITICAL PARAMETERS & TROUBLESHOOTING
Cytobank currently supports the Firefox browser and requires the ability to run Java applets on the web browser for gating and upload & download of FCS files.
An Internet connection is also required when using the software. The speed of the Internet connection will be a bottleneck when uploading data. Most analysis and results however are processed on the server and streamed to the client as images and text.
See http://docs.cytobank.org/wagn/Troubleshooting for common issues and questions. Support is also available via email at helpdesk@cytobank.org
Acknowledgments
The authors would like to acknowledge Garry P. Nolan & Ronald Levy for their support throughout the Cytobank project. The authors are also grateful to all members of the Nolan and Levy labs for providing feedback, input and beta testing. J.M.I. was supported as a Leukemia & Lymphoma Society Fellow and by the National Institutes of Health (K99 CA 143231-01). N.K. and P.O.K. were supported by National Heart, Lung and Blood Institute contract N01-HV-28183.
Footnotes
Contributed by Nikesh Kotecha, Peter O. Krutzik, and Jonathan M. Irish
LITERATURE CITED
- Barrett T, Troup DB, Wilhite SE, Ledoux P, Rudnev D, Evangelista C, Kim IF, Soboleva A, Tomashevsky M, Marshall KA, Phillippy KH, Sherman PM, Muertter RN, Edgar R. NCBI GEO: archive for high-throughput functional genomic data. Nucleic Acids Res. 2009 Jan;37(Database issue):D885–90. doi: 10.1093/nar/gkn764. Epub 2008 Oct 21. [DOI] [PMC free article] [PubMed] [Google Scholar]
- Demeter J, Beauheim C, Gollub J, Hernandez-Boussard T, Jin H, Maier D, Matese JC, Nitzberg M, Wymore F, Zachariah ZK, Brown PO, Sherlock G, Ball CA. The Stanford Microarray Database: implementation of new analysis tools and open source release of software. Nucleic Acids Res. 2007;35:D766–70. doi: 10.1093/nar/gkl1019. [DOI] [PMC free article] [PubMed] [Google Scholar]
- Krutzik PO, Nolan GP. Intracellular phosphoprotein staining techniques for flow cytometry: Monitoring single cell signaling events. Cytometry A. 2003 Oct;55(2):61–70. doi: 10.1002/cyto.a.10072. [DOI] [PubMed] [Google Scholar]
- Irish JM, Hovland R, Krutzik PO, Perez OD, Bruserud Ø, Gjertsen BT, Nolan GP. Single cell profiling of potentiated phospho-protein networks in cancer cells. Cell. 2004 Jul 23;118(2):217–28. doi: 10.1016/j.cell.2004.06.028. [DOI] [PubMed] [Google Scholar]
- Krutzik PO, Nolan GP. Fluorescent cell barcoding in flow cytometry allows high-throughput drug screening and signaling profiling. Nat Methods. 2006 May;3(5):361–8. doi: 10.1038/nmeth872. [DOI] [PubMed] [Google Scholar]
- Irish JM, Kotecha N, Nolan GP. Mapping normal and cancer cell signalling networks: towards single-cell proteomics. Nat Rev Cancer. 2006 Feb;6(2):146–55. doi: 10.1038/nrc1804. Review. [DOI] [PubMed] [Google Scholar]
- Sachs K, Perez O, Pe’er D, Lauffenburger DA, Nolan GP. Causal protein-signaling networks derived from multiparameter single-cell data. Science. 2005;308(5721):523–9. doi: 10.1126/science.1105809. [DOI] [PubMed] [Google Scholar]
- Hahne F, LeMeur N, Brinkman RR, Ellis B, Haaland P, Sarkar D, Spidlen J, Strain E, Gentleman R. flowCore: a Bioconductor package for high throughput flow cytometry. BMC Bioinformatics. 2009 Apr 9;10:106. doi: 10.1186/1471-2105-10-106. [DOI] [PMC free article] [PubMed] [Google Scholar]
- Frelinger J, Kepler TB, Chan C. Flow: Statistics, visualization and informatics for flow cytometry. Source Code Biol Med. 2008 Jun 17;3:10. doi: 10.1186/1751-0473-3-10. [DOI] [PMC free article] [PubMed] [Google Scholar]
INTERNET RESOURCES
- http://www.cytobank.orgThis is the home page for Cytobank with links for logging in and registration, getting started and to the latest documentation.
- http://docs.cytobank.orgThis is the documentation site for Cytobank with links to the latest tutorials and frequently asked questions.
- http://www.mozilla.orgThis is the homepage for Mozilla, creators of the FireFox web browser. Cytobank works best with FireFox.
- http://www.java.comThis is the homepage for Java, with links and information about installing Java on your computer. Cytobank requires that your web browser be configured to run java applets.
- http://www.javatester.org/version.htmlThis site can test whether your browser can run Java applets.


