

Abstract
The midbody (MB) is a singular organelle formed between daughter cells during cytokinesis and required for their final separation. MBs persist in cells long after division as midbody derivatives (MBds), but their fate is unclear. Here we show that MBds are inherited asymmetrically by the daughter cell with the older centrosome. They selectively accumulate in stem cells, induced pluripotent stem cells (iPSCs) and potential cancer ‘stem cells’ (CSCs) in vivo and in vitro. MBd loss accompanies stem cell differentiation, and involves autophagic degradation mediated by binding of the autophagic receptor, NBR1, to the MB protein Cep55. Differentiating cells and normal dividing cells do not accumulate MBds and possess high autophagic activity. Stem cells and cancer cells accumulate MBds by evading autophagosome encapsulation and exhibit low autophagic activity. MBd enrichment enhances reprogramming to iPSCs and increases in vitro tumorigenicity of cancer cells. These results suggest unexpected roles for MBds in stem cells and CSCs.
INTRODUCTION
Cell division culminates in the separation of two genetically identical daughter cells1. During division, cell fate determinants segregate asymmetrically to stem cell progeny2. The two spindle poles organized by differentially-aged centrosomes contribute to this asymmetry2,3 in that the older centrosome is inherited by the daughter cell that retains the stem cell fate4-6.
Abscission completes cell division by severing the intercellular bridge between the two future daughter cells1,7. Within the intercellular bridge lies the midbody (MB), a large proteinaceous organelle7-10 that was previously thought to detach from cells and disintegrate extracellularly as a remnant7,8. Recent studies show that post-abscission MBs or MB derivatives (MBds) can be retained by daughter cells, suggesting alternative fates for these organelles9,11,12.
The fate and function of MBds is unclear. In neural progenitors, MBds possess the putative stem cell marker CD133/prominin-1 and are proposed to participate in intercellular signaling during neural development13,14. MBds can be degraded by autophagy (see below)12, but the relationship between MBd loss or retention and the physiological state of cells is unknown.
During autophagy (macroautophagy), double membrane-bound autophagosomes assemble, engulf cytoplasmic material, and fuse with lysosomes for degradation15-18. Autophagy is required for cellular homeostasis, eliminating defective ubiquitin-tagged proteins and organelles16-19, clearing cell fate determinants and cell remodeling20-22. Defects in autophagy contribute to many disorders, including neurodegeneration23, hepatomegaly24 and aging15,18.
Here we show that MBds accumulate in stem cells and are lost upon differentiation. They are selectively degraded by linking the NBR1 autophagic receptor to the Cep55 MB protein. MBds accumulate by evasion of autophagosome encapsulation, asymmetric inheritance, and maintenance of low autophagic activity. Reprogramming efficiency and in vitro tumorigenicity are increased following experimental elevation of MBd levels suggesting non-mitotic roles for these organelles in stem and cancer cells.
RESULTS
Post-mitotic midbodies accumulate within cells
Multiple MBds were observed in subpopulations of cells by immunofluorescence (IF), but their precise location was unclear (up to 20; Fig. 1a, b). Three-dimensional reconstruction of immunofluorescent images revealed multiple MBds inside polarized and nonpolarized cells (Fig. 1c, d). Immuno-electron microscopy confirmed this localization and revealed ultrastructural features characteristic of MBds8,14 (Fig. 1e). About 70% of cell-associated MBds were trypsin-resistant, suggesting that they were intracellular (Fig. 1f). This intracellular localization of MBds suggested that they might accumulate in cells through successive divisions (below).
Figure 1.
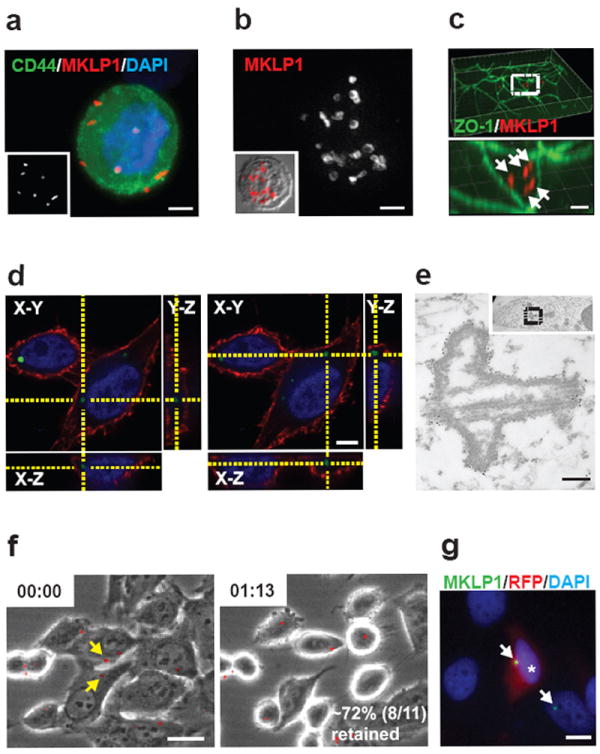
MBds accumulate within cells. (a, b) Multiple MBds associate with a PC3 cell (a) and a B-lymphoblast (b). Insets (a) MBd labeling and (b) merged phase-contrast image with MBd labeling to show cell boundaries. MKLP1, MBd marker (a, b; red); CD44, membrane (a; green); DAPI, DNA (a; blue). Bar, 5 μm (a) and 2 μm (b). (c, d) Three-dimensional reconstruction of polarized cells in a monolayer (c) and a HeLa cell (d) show intracellular MBds. (c) ZO-1, tight junction; MKLP1, MBds. Bar, 2 μm. Enlargement (c, bottom) of box (c, top) shows five MBds (arrows). (d) Wheat germ agglutinin, plasma membrane (red); MKLP1-GFP, MBds (green); DAPI, DNA (blue). Bar, 5 μm. (e) Electron micrograph of a MBd in a permeabilized MCF-7 cell showing immungold labeling with MKLP1 antibodies. Inset, lower magnification of the MBd (boxed) in cell; nucleus, right. Bar, 200 nm. (f) Time-lapse images during extracellular trypsin treatment of HeLa cells show retention of most MBds (MKLP1-GFP, red). Two MBds (yellow arrows) are lost upon treatment, suggesting digestion and/or dissociation. Time (hr:min) post-trypsin. Bar, 5 μm. (g) Two-day co-cultures of HeLa cell expressing either MKLP1-GFP (MBd marker) or cytosolic RFP. Green MBds (arrows) associated with red cells (asterisk) indicate post-mitotic transfer of MBds between cells. Bar, 10 μm.
MBds were also released from cells. In 2-day co-cultures of HeLa cells stably expressing either monomeric RFP (cytoplasmic marker) or MKLP1-GFP (MB marker), about 7% of MKLP1-GFP+ MBds associated with RFP+ cells (Fig. 1g). Such free MBds were also generated by other cell types (e.g. human adult fibroblasts, HeLa; 1-10%). These observations resolve the conflict of previous studies suggesting that MBds are either retained and degraded9,11,12 or released as remnants after abscission8. We show that MBds accumulate in some cells (Fig. 1a-d) but not others, and it is this cell type-specific difference in MBd-accumulation that is the focus of this study.
MBds are inherited by the cell with the older centrosome
Multiple MBds often clustered around the centrosome or spindle pole (ref. 9 and data not shown), reminiscent of MBd-sized aggresomes, which segregate to one daughter cell under control of centrosomes25,26. Moreover, centrosome age-dependent differences in signaling were observed late in cytokinesis27. These centrosome age-related differences led us to examine the relationship between centrosomes and MBd inheritance.
In G1, the centrosome contains one mother centriole (MC) and one daughter centriole (DC)3. After centriole duplication, three generations of centrioles are present: an older mother, a younger mother and two new daughters3,27. The centrosome with the older MC is termed the older centrosome4,5. GFP-tagged centrin1 (CETN1-GFP)28 expressed in mitotic HeLa cells was brightest at one of the four centrioles (92.2% of cells, n=116; Fig. 2a) and turned over very slowly (FRAP t1/2 ~4 hours and ref. 5). The brightest centriole remained so from metaphase to late cytokinesis (91.3% of cells, n=46; supplementary information, Fig. S1a), suggesting that it was the older MC. This was confirmed by staining with the older centrosome marker, hCenexin127 (~90% of HeLa and MCF-7 cells, n=143 and n=347, respectively; Fig. 2b). Several other centriole antigens also showed intrinsic age-related differences in labeling (supplementary information, Fig. S1b).
Figure 2.
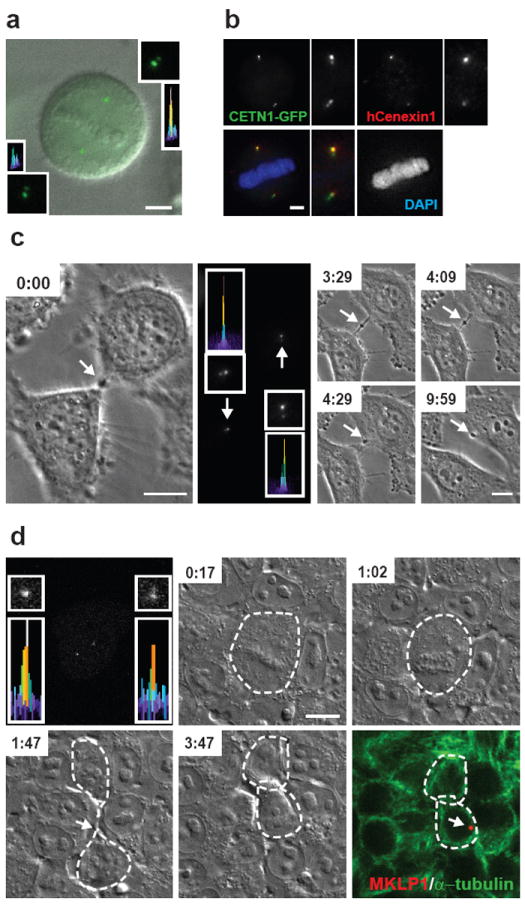
MBds are preferentially inherited by the cell with the older centrosome. (a) CETN1-GFP signal is brighter in upper centrosome/spindle pole of a mitotic spindle. The merged DIC image with CETN1-GFP labeling at two centrosomes shows metaphase chromosome. Insets (lower left, upper right), enlargement and semi-quantitative integrated intensity profile of centrioles. Bar, 5 μm. (b) The brighter CETN1-GFP signal represents the older centrosome as it co-stains more intensely for hCenexin1 and remains more intense throughout cell division (supplementary information, Fig. S1a). Bar, 5 μm. Lower left, merge. (c, d) Time-lapse images show that the mitotic MB is preferentially inherited by the daughter cell with the older centrosome in HeLa cells (c) and hESCs (d). Cells were imaged at the indicated times (hr:min) from telophase by phase-contrast microscopy (c) and from metaphase by DIC microscopy (d). Middle panel of (c) and left panel of (d), CETN1-GFP at centrosomes; enlargements and integrated intensity profiles show the daughter cell having the older centrosome (c, upper; d, lower) inherits the MBd (Time-lapse images: 9:59 in c; lower right image in d). Mitotic MB and MBds (c, d; arrows). MKLP1, MBd marker (red); α-tubulin, mitotic MB and cell boundary marker (green); DAPI, DNA (blue). Bars, 10 μm (c, d).
Using CETN1-GFP to identify the older MC; bright-field imaging to follow MB dynamics in living cells; and immunofluorescence to confirm MBd inheritance, we determined that MBds were preferentially inherited by the cell with the older centrosome. This was observed in pluripotent human embryonic stem cells (hESCs; 83.3% of H9, n=18; Fig. 2d), immortalized somatic cells (91.3% of hRPE-1, n=23) and cancer cells (U2OS: 84.6%, n=13; HeLa: 75.0%, n=24; Fig. 2c). We conclude that most inherited MBds are asymmetrically transferred to the daughter cell with the older centrosome in several cell types.
MBds accumulate in stem cells in vivo
Other studies have shown that the older centrosome is asymmetrically inherited by the stem cell during asymmetric divisions in the Drosophila male germline4 and the mouse neocortex5. The association of the older centrosome with both MBds and stem cell divisions led us to ask whether MBds were found in stem cell niches. To address this, we determined the localization of MBds in human and mouse tissues. In seminiferous tubules of testes, MBds were confined to the basal compartment, the site of germline stem cells and their mitotic progeny (both capable of self-renewal29,30) (Fig. 3a, up to 8 puncta/cell, 5-μm section). Electron microscopy also revealed multiple cytoplasmic structures with features characteristic of MBds within these cells (Fig. 3b, c).
Figure 3.
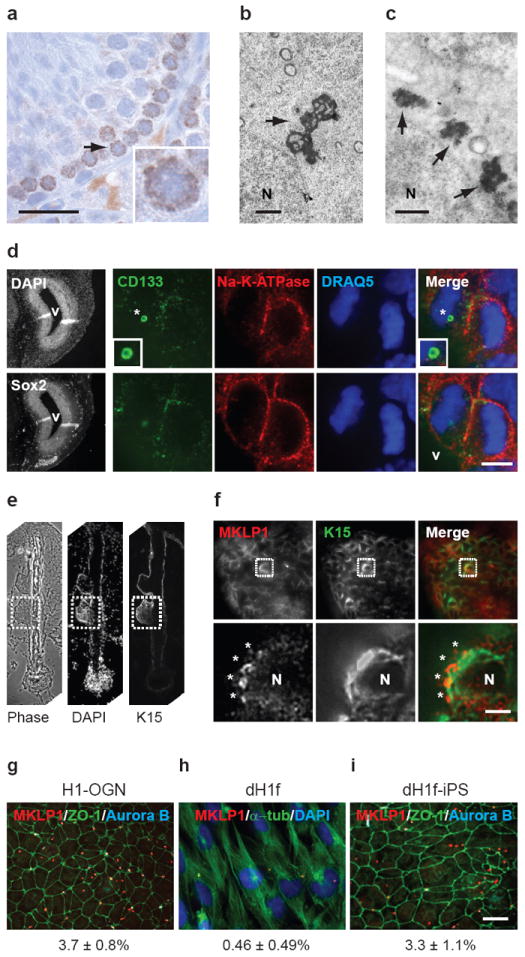
MBds accumulate in stem cells in vivo and in vitro. (a) Histological section through mouse seminiferous tubules labeled for MKLP1 shows several MKLP1+ puncta in cells of the basal layer where stem cells reside. Bar, 20 μm. Inset, enlargement of the cell (arrow) (b, c) Electron micrographs of mitotic MB (b, arrow) and multiple MB-like structures in interphase cells with similar shape and size in a juxtanuclear position (c, arrows) in basal cells of mouse seminiferous tubules. N, nucleus. Bars, 1 μm. (d) Representative planes of a neural progenitor cell in the ventricular zone (Sox2+, left-bottom panel) of an E13.5 mouse brain show that an intracellular MBd (asterisk) is associated with the ventricle-facing daughter in the asymmetrically dividing cell (top row). The bottom row emphasizes the position of paired chromosomes in a dividing anaphase cell. CD133, MB/MBd marker (green); Na-K-ATPase, cell-border marker (red); DRAQ5, DNA (blue); DAPI, DNA. Ventricle (V). Bar, 5 μm. Note that abscission occurs apically in these cells. (e) A histological section through a hair follicle (left, phase-contrast microscopy) stained for the stem cell marker keratin 15 to identify the bulge region (dotted box), the stem cell niche. DNA stain (DAPI) and the phase-contrast image show full follicle architecture. (f) Upper panels show MBd-accumulating cells in the bulge region (boxed) colabeled with K15 and MKLP1. Enlargements (lower panels) of the boxed region highlight a cell with four MBds (asterisks). N, nucleus. Bar, 5 μm. (g-i) Quantitative analysis and representative images show a decrease in MBd-accumulating cells upon the differentiation of pluripotent stem cells (g, H1-OGN) to fibroblast-like cells (h, dH1f), and an increase in MBd-accumulating cells after reprogramming differentiated cells (h) to induced pluripotent stem cells (i, dH1f-iPS). (g-i) numbers refer to mean ± s.d., n=3. MKLP1, MBds; ZO-1, tight junctions; α-tubulin, microtubules; Aurora B, MBs. Bar, 10 μm.
In the ventricular zone (VZ, Sox2+31) of embryonic mouse brains, CD133-labeled MBds were associated with neural progenitors13,14 (Fig. 3d and Supplementary information, Fig. S2). During asymmetric divisions, intracellular MBds were usually found in ventricle-facing daughter cells (progenitors; 75%, n=8) and not in daughters with presumed committed fates5. MBds in the human hair follicle were also confined to a subpopulation of cells in the stem cell niche, the bulge32, suggesting distinct properties of this subpopulation (Fig. 3e, f). MBds were also enriched in β1–integrin+33 mouse skeletal muscle progenitors (SMPs; 4-fold) over non-SMP cells. These observations suggested that MBds were selectively retained and accumulated during successive stem cell divisions in vivo.
MBds accumulate in stem cells in vitro
To rigorously test the idea that MBds are selectively inherited by stem cells, we examined MBd fate during stem cell differentiation and somatic cell reprogramming. MBd ‘accumulation’ was assessed by counting cells with >1 MBd, as all cells can transiently acquire one MBd after abscission (below). MBd-accumulation decreased ~8-fold upon differentiation of hESCs (H1-OGN) to fibroblast-like cells (dH1f; Fig. 3g, h). Differentiation was judged by loss of embryonic stem cell markers (Oct4, Sox2, Klf4, Nanog) and gain of the CD13 differentiation marker34,35. In contrast, MBd-accumulation increased ~7-fold after reprogramming dH1f cells to iPSCs34,36 (dH1f-iPS; Fig. 3h, i). We conclude that MBd-accumulation in vitro reflects that observed in vivo, and can be manipulated by altering the potency status of cells.
MBd-accumulation is enhanced in tumor-derived cells
We next examined differences in MBd-accumulation among cell lines derived from stem cells, normal dividing cells and cancer cells (Fig. 4a). MBd-accumulation was low in primary and telomerase-immortalized normal cells and significantly higher in hESCs and iPSCs (~7-fold on average; Fig. 4a). Most cancer cells exhibited even higher levels of MBd-accumulation. For example, MBd-accumulation in tumorigenic MCF-10AT and MCF-10CA1a cells was much higher than in the normal MCF-10A parental line. The common ability of stem cells and cancer cells to accumulate MBds, express stem cell markers37 and possess stem cell properties38,39 suggests a relationship between MBd-accumulation, tumorigenicity and cancer ‘initiating’ or ‘stem’ cells defined by the CSC theory40.
Figure 4.
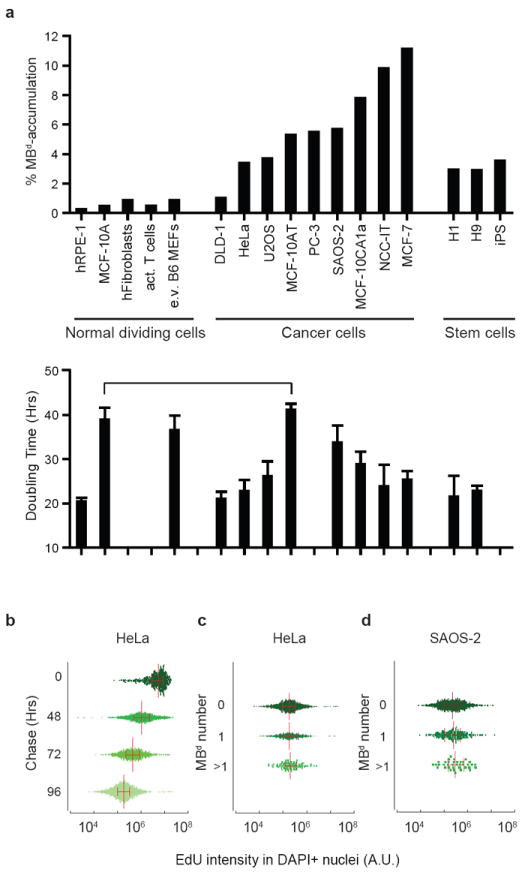
MBd-accumulation is high in stem cells and subpopulations of cancer cells and does not correlate with cell doubling time. (a) Percent of cells that accumulate MBds (>1) in a range of different cell types, as indicated. Below, doubling-times of representative cell lines aligned with MBd-accumulation data. Data are presented as mean ± s.d.; Cell lines are examined in triplicate (MCF-10A, DLD-1, MCF-10AT, MCF-7, H1, and H9), or quadruplicate (e.v. B6 MEFs, HeLa, SAOS-2, and MCF-10CA1a), except hRPE-1 (n=6), U2OS (n=7) and NCC-IT (n=8). Horizontal line, cell lines with different MBd-accumulation potential (14-fold) but similar doubling time. (b) Cells pulse-chased with EdU show a decrease in EdU intensity (x-axis) over time (y-axis), reflecting dilution of dye after cell divisions. (c, d) After a 96-hr chase period, EdU levels were compared between cells with MBd numbers of >1, 1, and 0 (y-axis) in HeLa (c) and SAOS-2 cells (d). In both cases, no significant differences were noted (c, p=0.2101; d, p=0.5609, one-way ANOVA, with at least 800 cells analyzed for each experiment, n=3), indicating similar cycling rates among different subpopulations of cells. (b-d) Each graph is a representative experiment. Cells analyzed shown by green points, median depicted by vertical red lines, and horizontal red lines with ticks illustrate the interquartile range.
MBd-accumulation does not correlate with cell proliferation rate
A simple explanation for cell type-specific differences in MBd-accumulation is variability in proliferation rates. Slower division rates could allow more time for MBd degradation, as recently proposed12. However, we observed no correlation between population doubling-time and MBd-accumulation (Fig. 4a). It was still possible that MBd-accumulating cells cycled faster than the bulk population. However, a cohort of cells pulse-labeled with EdU41 showed a proportional decrease in EdU intensity, reflecting dilution of dye after successive divisions (Fig. 4b) and indicating that MBd-accumulating and non-accumulating subpopulations had similar cycling rates (Fig. 4c, d).
MBd-accumulating cells evade membrane encapsulation of MBds
We next asked if MBds occupied different sites within MBd-rich and MBd-poor cells. To test this, we used the Fluorescence Protease Protection (FPP) assay42 to monitor degradation of MBds following plasma membrane permeabilization and protease addition (Fig. 5a). Under these conditions, MKLP1-GFP+ MBds were degraded in MBd-rich HeLa cells but not in MBd-poor hRPE-1 cells indicating that MBd-poor cells sequestered MBds in membrane-bound compartments whereas MBd-rich cells accumulated them in the cytoplasm (Fig. 5b). Importantly, the integrity of intracellular organelles was maintained during the course of these experiments (supplementary information, Fig. S3).
Figure 5.
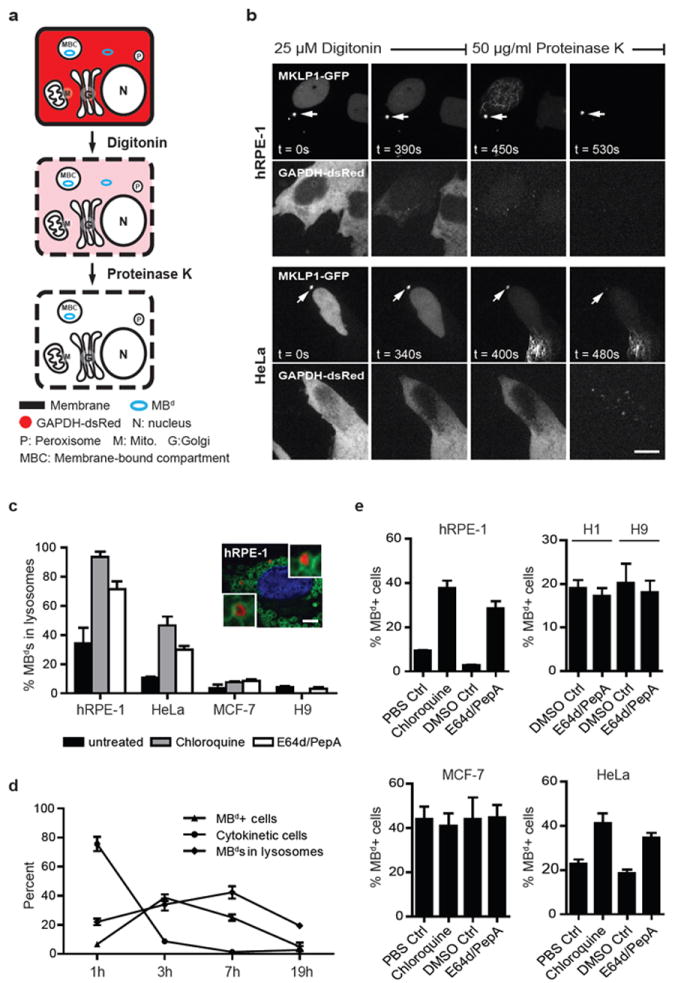
MBds in stem and cancer cells evade membrane encapsulation and lysosomal degradation. (a) Depiction of fluorescence protease protection (FPP) assay. Digitonin selectively permeabilizes the plasma membrane but not internal membranes. Proteinase K degrades cytoplasmic components but membranous compartments remain intact. Under these conditions, MKLP1-GFP-labeled MBds (blue circle) in the cytoplasm will be degraded whereas those inside membrane-bound compartments (MBCs) will not. (b) MBds in MBd-poor hRPE-1 cells are largely protected (~90% in membranous compartments, cells analyzed=10), whereas most MBds in HeLa cells are not (~27%, cells analyzed: 11), and are thus degraded in cytoplasm. Bar, 5 μm. (c) Graph depicting the presence of MBds in lysosomes upon chloroquine or E64d/pepstatin A (E64d/PepA) inhibition in hRPE-1 and HeLa cells, but not in MCF-7 and H9 hESCs. Chloroquine treatment of H9 hESCs is not included as it caused differentiation and cell death. A representative image of hRPE-1 cells inhibited by chloroquine is shown depicting two MBds inside lysosomes. MKLP1 and LAMP2 are used as MBd (red) and lysosome (green) markers, respectively. DAPI, DNA (blue). n=100 MBds/treatment in each of the biological triplicates. Bar, 5 μm. (d) Graph showing the percent of MBd+ cells (MBd levels), the percent of MBds within lysosomes, and the percent of cells exiting cytokinesis following synchronization. MKLP1 and LAMP2 are used as markers as in (c). Note that MBds are transferred into only one of the two nascent daughter cells after abscission (Fig. 2d), so a 50% maximum will be expected for MBd+ cells. The peak of MBds transferred to cells is 3 hours after plating followed by a peak of MBds entering lysosomes at 7 hours. (e) Both chloroquine and E64d/PepA treatments increase the percent of MBd+ cells in hRPE-1 cells and HeLa cells (chloroquine: p=0.0021 and p=0.0187, respectively; E64d/PepA: p=0.0022 and p=0.0043, respectively; n=3 for all experiments). In contrast, lysosomal inhibition has no detectable effect on hESCs (H1, H9) and MCF-7 cancer cells. Data are presented as mean ± s.d. (c-e), except mean ± s.e.m. in hESCs (e).
Stem cells and cancer cells evade lysosomal degradation of MBds
The protease resistance of MBds and low MBd-accumulation in MBd-poor hRPE-1 cells (Fig. 4a and 5b) suggested that MBds were delivered to a membrane-bound compartment for degradation, such as the lysosome. Indeed, MBds were often found within LAMP243-labeled lysosomes in MBd-poor cells (Fig. 5c). To test this further, we examined the fate of newly-formed MBds in synchronous populations of MBd-poor cells (Fig. 5d). Three hours after release from mitosis, the percent of MBd+ cells (MBd levels) peaked at ~40% (50% being the maximum since half the cells were ‘born’ without a MBd). This was followed by a peak in MBd localization to lysosomes (~42% at 7 hours; Fig. 5d) and then a decrease of MBds to baseline levels (16-19 hours; Fig. 5d). These data and the FPP data suggested that MBds in hRPE-1 cells entered the cytoplasm, moved into lysosomes and were degraded before the next cell cycle (Fig. 5b, d).
If lysosomes are involved in MBd degradation, lysosomal inhibition should increase MBd levels. Indeed, when lysosomal activity was inhibited in MBd-poor hRPE-1 cells with either chloroquine or E64d/PepA protease inhibitors44 MBd levels (Fig. 5e) and the percent of MBds found within lysosomes (Fig. 5c) were elevated. In contrast, MBd levels and the percent of MBds in lysosomes in MBd-rich cells (hESC, MCF-7; Fig. 5c, e) were largely unaffected by lysosomal inhibition (see supplementary information, Fig. S4a). The modest increase in MBd+ HeLa cells (Fig. 5e) was consistent with their modest MBd-accumulating ability (Fig. 4a). We conclude that lysosomal degradation prevents MBd-accumulation in MBd-poor cells, but does not play a major role in MBd-rich cells (e.g. stem cells, CSCs) thus allowing MBds to accumulate.
Autophagic degradation controls intracellular MBd levels
To determine how MBds were directed to lysosomes, we explored pathways leading to lysosomal degradation. Reported autophagy levels in MCF-7 and DLD-1 cells45,46 suggested a relationship between autophagy and MBd fate. Low autophagy levels in MCF-7 cells resulting from a deficiency in the autophagy gene, BECN1 (also known as Atg6)45, are consistent with high MBd-accumulation (~26-fold over normal cells; Fig. 4a). High autophagy levels in DLD-1 cells46 are consistent with low MBd-accumulation (only ~1.8-fold over normal cells; Fig. 4a). In agreement with this trend was the presence of MBds in autophagosomes of MBd-poor cells (Fig. 6a).
Figure 6.
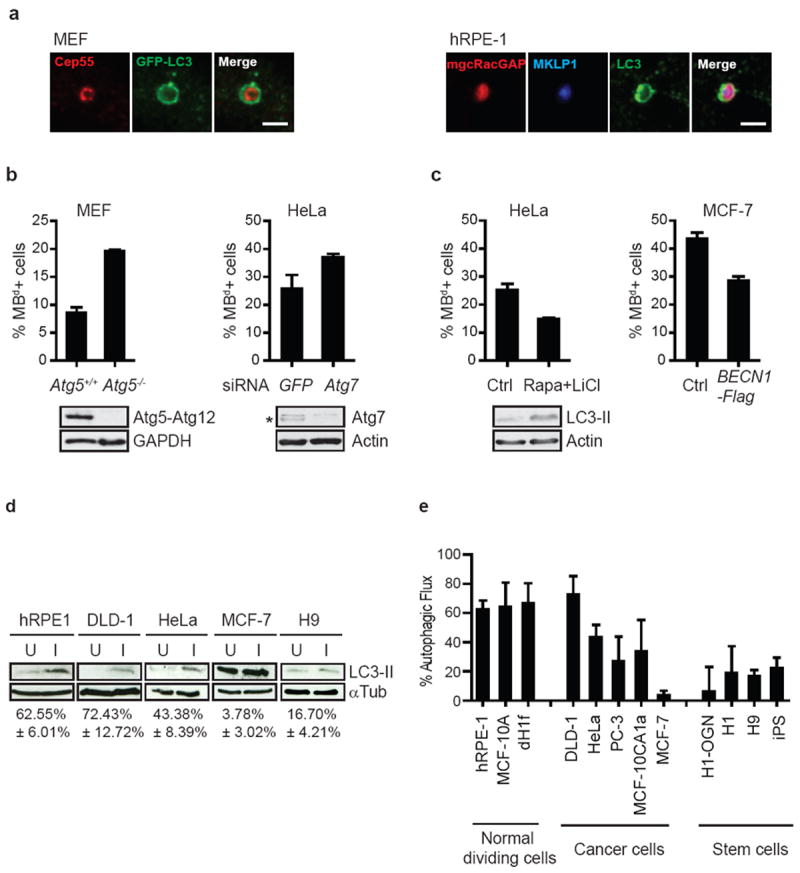
Autophagy controls intracellular MBd levels. (a) Single-plane confocal images of MBds within LC3-positive autophagosomes in MEFs expressing GFP-LC3 (left) and in hRPE-1 cells stained for endogenous LC3 (right). MBd markers: Cep55, MKLP1, or mgcRACGAP. Autophagosomes: GFP-LC3 or LC3. Note that MKLP1 (blue) and mgcRACGAP (red) are co-localized (magenta) in the autophagosome (green), suggesting that MBds are sorted into autophagosomes. Bars, 2 μm. (b) Decreasing autophagy levels by deletion of Atg5 gene (left, MEFs) or depletion of Atg7 by siRNA (right, HeLa) significantly increases the percent of MBd+ cells (p=0.0019 and p=0.021, respectively, n=3). Immunoblots confirm loss of the Atg5-Atg12 conjugation in mutant cells and depletion of Atg7 (asterisk). (c) Rapamycin (Rapa) and lithium chloride (LiCl) co-treatment induces autophagy and decreases the percent of MBd+ cells (left, HeLa; p=0.0056, n=3). Immunoblots showing increased LC3-II levels confirm autophagy induction. Induction of autophagy by over-expression of Flag-tagged BECN1 reduces the percent of MBd+ cells (right, MCF-7; p=0.0008, n=4) (d) Representative immunoblots showing high autophagy levels in normal cells and low levels in stem cells and cancer cells. Autophagic flux (autophagic activity) was measured by changes in the levels of LC3-II, in the presence or absence of lysosomal inhibitors E64d/PepA. U, uninhibited. I, inhibited. Below, the average of the percent change in LC3-II levels after lysosomal inhibition from 3 experiments. α-tubulin, loading control. (e) Quantification of autophagic flux from 3 experiments in different cell lines. Normal dividing cells (MBd-poor) typically have high autophagic flux, whereas stem and cancer cells (MBd-rich) have low autophagic flux. The data are presented as mean ± s.d. (b-e).
Experimental reduction of autophagy activity using MEFs from Atg5-deleted mice19 or by siRNA-mediated depletion of Atg7, increased MBd levels (Fig. 6b). Induction of autophagy by rapamycin and lithilum chloride treatment47,48 in HeLa cells or by exogenous BECN1 expression in MCF-7 cells, decreased MBd levels (Fig. 6c). These results demonstrated the role of autophagy in regulating MBd levels in different cell types, and suggested an inverse relationship between autophagic activity and MBd-accumulation. This inverse relationship was revealed in 12 cell lines by LC3-II44,49 or p6244,50,51-based measurements of autophagic activity (Fig. 6d, e and supplementary information Fig. S4b). We conclude that MBd levels are, in part, modulated by cell type/lineage-specific autophagy (Fig. 3g-i, 4a, 6d and 6e).
NBR1 is an autophagic receptor for MBd-specific degradation
To test whether MBd degradation involves non-specific or receptor-mediated autophagy pathways15, we investigated the mammalian autophagic receptors, p6250-52 and NBR153,54. p62 is implicated in MBd clearance12, whereas NBR1 is untested. NBR1 and p62 localized to mitotic MBs and MBds (Fig. 7a, top, data not shown, and ref. 12), suggesting that MBd degradation involves receptor-mediated autophagy. NBR1-silencing in HeLa cells increased MBd levels to Atg7-silencing levels (Fig. 6b and 7b), suggesting that NBR1 is likely a major autophagic receptor for MBd degradation. In contrast, p62-deletion51 or siRNA-mediated p62 depletion had no detectable effect on MBd levels (Fig. 7b, c) or NBR1 recruitment to MBds (Fig. 7a, bottom).
Figure 7.
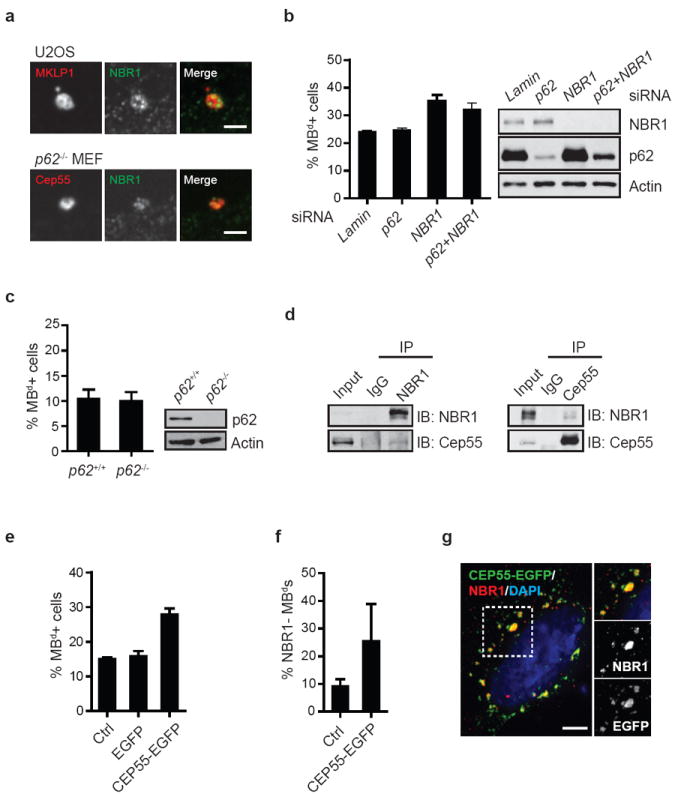
NBR1 is a receptor for targeting MBds to the autophagy pathway. (a) Single-plane confocal images showing co-localization of the MBd and the autophagic receptor, NBR1, in U2OS cells and p62-deleted MEFs. MBd markers: MKLP1 or Cep55. Bar, 2 μm. (b) The percent of MBd+ cells is significantly increased following the depletion of NBR1 (p=0.022, n=3), but not another autophagic receptor, p62. Co-depletion of NBR1 and p62 does not further increase MBd levels over NBR1 depletion alone. (c) Deletion of the p62 gene does not affect the percent of MBd+ cells. For (b) and (c), immunoblots verify protein loss. (d) Co-immunoprecipitation reveals Cep55 and NBR1 form a complex. Precipitated proteins and 5% of the input material (Input) were analyzed by immunoblotting with antibodies against NBR1 or Cep55. (e-g) Over-expression of CEP55-EGFP increases the percent of MBd+ cells (e; p=0.0007, n=3) and the percent of NBR1-negative MBds (f; p=0.0568, n=3), presumably by sequestering NBR1 (red) away from MBds in cells expressing CEP55-EGFP (green) as shown in (g), and consequently preventing MBd degradation. The dotted box in (g) is enlarged (top right panel), and the labeling of NBR1 and CEP55-EGFP (middle and bottom right panel) are also presented. DAPI, DNA (blue). Bar, 5 μm. The data are presented as mean ± s.d. (b, c, e, and f).
To date, no MBd target(s) for autophagic degradation have been identified. Candidate-based screening revealed that endogenous NBR1 co-immunoprecipitated with the MB protein Cep55 in hRPE-1 cells (Fig. 7d). Cep55 over-expression increased MBd levels (Fig. 7e) and the level of NBR1-negative MBds (Fig. 7f), presumably through NBR1 sequestration in the cytoplasm (Fig. 7g). This suggested a role of Cep55 in NBR1-mediated MBd degradation. We propose that the Cep55/NBR1 interaction couples MBds to the autophagic machinery to control MBd fate.
Cells enriched in MBds exhibit increased reprogramming efficiency
We next examined the functional consequences of manipulating MBd levels. We first tested the role of MBds during reprogramming34,35,55 in cells stably expressing NBR1-specific shRNAs (shNBR1) to increase MBd levels over controls (shNT). MBd levels increased ~1.8-fold in dH1f cells, ~1.5-fold in IMR9055 embryonic fibroblasts, and ~1.9-fold in hFib234 adult fibroblasts. Under these conditions, iPSC colony formation increased significantly in all three cell types depleted of NBR1: dH1f cells (up to 8.7-fold, avg. 3.1±0.5-fold), IMR90 cells (up to 4.2-fold, avg. 3.4±0.8-fold; Fig. 8a, b and supplementary information Table. S1) and adult hFib2 cells (up to 2.5-fold, avg. 1.7±0.5-fold). Similar results were obtained with different batches of viruses, different combinations of reprogramming factors, and different viral delivery systems (see Methods). Importantly, increased reprogramming following NBR1-depletion occurred without significant changes in global autophagic activity (dH1f; Fig. 8c) or cell proliferation rate (shNBR1: 27.3±2.5hrs; shNT: 26.8±4.5hrs; n=6), suggesting that NBR1 is selective for MBd degradation.
Figure 8.
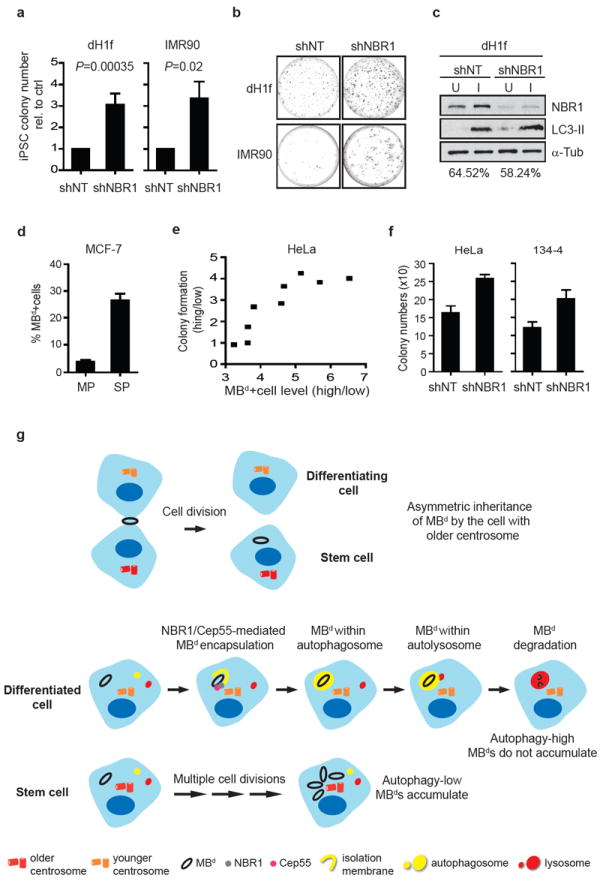
MBd enrichment increases reprogramming efficiency and enhances in vitro tumorigenicity. (a-c) Reprogramming is more efficient after MBd enrichment. Differentiated cells (dH1f) and embryonic fibroblasts (IMR90) are reprogrammed after stable expression of either NBR1-specific shRNA (shNBR1) or non-targeting shRNA (shNT). Emerging iPSC colonies are scored based on Tra-1-60 expression37. (a, b) Cells depleted of NBR1 to increase MBd levels show an increase in iPSC colony formation (a, dH1f: 3.1±0.5-fold, n=15, p=0.00035; IMR90: 3.4±0.8-fold, n=3, p=0.02; data are mean ± s.e.m.) but insignificant changes in autophagic activity (c) over shNT control. (b) Representative plates with Tra-1-60-immunostained iPSC colonies. Immunoblot (c, top) and densitometry (c, bottom; percent of autophagic flux) show representative result (n=3); α-tubulin, loading control. (d) MCF-7 side-population (SP) cells have a significantly higher percentage of MBd+ cells over the non-SP population (MP; p=0.0015, n=3; data are mean ± s.d.). (e, f) MBd enrichment in cancer cells leads to increased anchorage-independent growth. MKLP1-GFP-expressing HeLa cells are separated into “MBd high” and “MBd low” subpopulations. An increase in the “MBd high” over “MBd low” ratio is associated with an increase in soft-agar colony formation (e). No significant difference was observed when the enrichment of MBd high subpopulation was less than 3-fold. More soft-agar colonies are formed when MBds are enriched by NBR1-depletion (shNBR1) in HeLa (f, left; p=0.0012, n=3) and mouse 134-4 cells (f, right; p=0.0086, n=3); control, shNT. Data are mean ± s.d., and the colony number (e, f) is the sum of INT-violet-stained colonies from 10 random fields. (g) Model for MBd fate in cells. The newly-formed MBd is preferentially inherited by the daughter cell with the older centrosome (top panel). The inherited MBd (black ring) is recognized by binding of the NBR1 autophagic receptor (grey circle) with the MB protein Cep55 (magenta). The MBd is then encapsulated by the autophagosome (yellow circle), and degraded after fusion of autophagosome and lysosome (red circle) in differentiated cells. This pathway prevents MBd-accumulation. In contrast, stem cells efficiently accumulate MBds through successive divisions and evasion of NBR1-mediated autophagy. Additionally, differentiated and stem cells possess overall high and low autophagic activity, respectively.
Cancer cells enriched in MBds exhibit increased in vitro tumorigenicity
Because MBds selectively accumulate in stem cell niches, hESCs, and iPSCs, we reasoned that they may also accumulate in CSCs. On the basis of Hoechst 33343 extrusion, the side population (SP) of MCF-7 cells56 was isolated. These putative CSCs showed a 7-fold increase in MBd+ cells over the non-SP population (MP; Fig. 8d).
To directly address the role of MBds in cancer cells, MKLP1-GFP-expressing HeLa populations with high or low percentages of MBd+ cells were isolated by FACS, and tested for anchorage-independent growth. Increased colony formation was observed in the “MBd high” versus the “MBd low” population, and colony formation increased with increasing MBd levels (up to 4-fold; Fig. 8e). An increase in colony formation was also observed in MBd-enriched HeLa cells (Fig. 8f, left) and mouse hepatocarcinoma cells (134-4; Fig. 8f, right) following NBR1-silencing. Results of all three strategies suggest that MBds in cancer cell subpopulations may contribute to their tumorigenic potential.
DISCUSSION
We have identified new roles for MBds outside their canonical function in cytokinesis. This work provides the first evidence for MBd-accumulation in stem cells, hESCs and iPSCs in vivo and in vitro, and for dramatic MBd reduction in differentiating progeny of stem cells. MBds appear to function in maintaining or enhancing the pluripotency of stem cells and the tumorigenicity of cancer cells.
Our findings suggest that MBd loss that accompanies stem cell differentiation is mediated by autophagic degradation, resulting in selective elimination of MBds in differentiated cells but retention in germ or stem cells. This process is intriguingly similar to clearance of P granule components in committed somatic cells of C. elegans, which is also mediated by autophagy57. Moreover, P granules contain molecules required for cell fate specification58, and MBds contain stem cell markers13,14 and enhance cell fate conversion (present study). It is thus tempting to propose that MBds may serve as scaffolds for organizing cell fate determinants. Equally intriguing is the observation that essentially all cancer cells examined contain MBd-accumulating subpopulations, making this a common intrinsic property of both stem cells and cancer cells. The observation that MBd-enriched cancer subpopulations exhibit enhanced in vitro tumorigenicity is consistent with the CSC model for potentiation of tumorigenicity37-40.
Our data identify two primary mechanisms for MBd-accumulation. The first is asymmetric MBd inheritance by the daughter cell with the older centrosome (Fig. 8g, top). In fly testes and mouse neocortex, the old centrosome segregates to the stem cell during asymmetric divisions and is accompanied by increased microtubule-anchoring ability4-6. MBd inheritance could be facilitated through increased anchoring of microtubules to the older centrosome, and increased microtubule binding to the MBd in the daughter cell with the older centrosome. This would be consistent with the observed MBd-accumulation in stem cells but not in their differentiated progeny. Despite the slower division rate of stem cells in vivo59, MBd-accumulation could still occur via this mechanism. However, our results also indicate that such asymmetry occurs in different cell types, suggesting that it may only be physiologically relevant in stem cells and CSCs.
Evasion of autophagic degradation is a second mechanism for MBd-accumulation (Fig. 8g, bottom). This is exemplified by the inverse relationship between MBd levels and autophagic activity, and by changes in MBd levels with manipulation of autophagy levels. MBd-accumulation can also be mediated by uncoupling receptor-mediated entry into the autophagy pathway, since depletion of the NBR1 autophagic receptor or over-expression of the corresponding ligand, Cep55, increases MBd levels. In contrast, another known autophagic receptor, p62, does not appear to be involved in MBd clearance (Fig. 7b, c). NBR1 and p62 can form a complex53,60; however, evidence suggests that they may act independently as autophagic receptors53. Thus, p62/NBR1 complex formation may not be a prerequisite for autophagic degradation. Since NBR1-silencing increases MBds to levels seen following inhibition of autophagy in HeLa cells (Fig. 6b and 7b), NBR1-mediated autophagic degradation likely represents a major pathway for selective MBd elimination. However, it is still possible that other autophagic receptors and MBd ligands may exist and contribute to MBd degradation, even though Cep55 is the sole MB ligand for the NBR1 receptor identified thus far (Fig. 7d). In our model, Cep55 and NBR1 and perhaps other MBd ligands and autophagy receptors, act as switches that control MBd fate. Ongoing proteomic analyses may identify other molecules and pathways for MBd degradation.
MBd levels can be further increased in autophagy-compromised Atg5-/- MEFs when lysosome enzymes are inhibited (data not shown), suggesting that other degradative pathways may contribute to MBd degradation. Chaperone-mediated autophagy (CMA)15,61, which targets ~30% of cytosolic proteins and is upregulated upon compromised autophagy62, is a potential candidate since multiple MB proteins contain CMA-targeting motifs (KFERQ-like motifs)61. The proteasome system is another major cellular degradation pathway63 but it doesn’t appear to play a role in MBd degradation (supplementary information, Fig. S5).
Other non-degradative processes may also regulate MBd levels. Even though elevated proliferation rate has been proposed as a factor hindering autophagic MBd degradation and causing MBd-accumulation in cancer and normal cells12, we didn’t observe such a correlation (Fig. 4a). Additional work is required to determine if MBd-accumulation also requires selective sequestration of previously inherited (pre-existing) MBds, as suggested by selective accumulation of MBds in stem cells of the testes and lateral ventricle of the brain (Fig. 3a-d). Release of MBds has also been observed in chicken and mouse neural progenitors13,14 and in human cells (ref. 8 and Fig. 1g), and may be another, possibly minor pathway for eliminating MBds (or for intercellular signaling14). Finally, ongoing work is addressing whether MBds are distributed to both daughters of stem cells during symmetric divisions as might be expected if MBds are essential for stem cell function.
In summary, our results demonstrate that MBds are more than the remnants of cytokinesis. Their fate is differentially controlled in different cell types and mediated by diverse pathways. The shared ability to accumulate MBds by stem cells and putative CSCs, and the striking impact on cellular phenotypes following manipulation of MBd levels suggest that MBds perform important cell type-specific functions that remain to be discovered.
METHODS
Cell lines
hESC and iPSC lines include H1 (WA01), H9 (WA09), H1-OGN (Oct4-EGFP knock-in H1)36, and dH1f-iPS34, which is reprogrammed from dH1f cells differentiated from H1-OGN (HSCI at Children’s Hospital Boston). Differentiated lines include hRPE-1 (Clontech), MCF-10A, adult human fibroblasts (PCS-201-012, ATCC), hFib234, IMR90 (CCL-186, ATCC), ex vivo C57BL/6 MEFs, GFP-LC3-expressing Atg5-/- and Atg5+/+ MEFs19, and p62-/- and p62+/+ MEFs51. Cancer cell lines include DLD-1, HeLa, NCC-IT, PC-3, U2OS, SAOS-2, 134-4, MCF-7, MCF-10AT, and MCF-10CA1a. Mouse skeletal muscle progenitors (SMPs)33 and in vitro activated T cells were isolated and stimulated following standard protocols. Cells were used within 4 (primary cultures) or 10 (established cell lines, hESCs, and iPSCs) passages. Cells expressing MKLP1-GFP, monomeric RFP and CETN1-GFP were created in the present study or ref. 28.
Immunofluorescence and Immunohistochemistry
Immunofluorescence was performed as described9,13,64. To label lysosomes and autophagosomes, cells were permeabilized with 0.05% saponin in blocking buffer (10% goat serum/PBS). Preparations for immunohistochemistry were fixed with 4% paraformaldehyde/0.5% glutaraldehyde via perfusion. Testes were processed and stained following 2-4hr post-fixation with 4% paraformaldehyde. MB-derived rings between spermatocyte syncytia65 were observed if stained longer. Images were taken on a Zeiss Axioskop 2 microscope, a Zeiss Axiovert 200 microscope with PerkinElmer UltraView LAS spinning disc, or an Olympus BX-51 microscope. Images were processed and analyzed with MetaMorph (Molecular Devices) and Imaris (Bitplane Inc.).
Electron Microscopy
Conventional EM
Mouse tissue, fixed with 5% glutaraldehyde in 50 mM sodium cacodylate buffer (pH=7.4) for 30 min via perfusion, was diced into 1-mm cubes for 1-hr post-fixation at 4°C. Cubes were washed with cacodylate buffer, stained and embedded in Spi-pon/Araldite, and sectioned at 70-500 nm before staining with 25% uranyl acetate and Reynold’s lead citrate. Images were taken on a Philips CM12 electron microscope with an Erlangshen CCD Camera (Gatan).
Immunogold EM
MCF-7 cells on coverslips were prepermeabilized for 60 sec with preperm buffer (80 mM PIPES, pH6.8, 0.5 mM EGTA, 1 mM MgCl, 0.5% Triton X-100), fixed with 4% paraformaldehyde for 10 min, labeled for MKLP1 for 1 hour, processed as described66 using 12-nm gold-conjugated goat anti-rabbit IgG (Jackson ImmunoResearch) and embedded in Spi-pon/Araldite. 80-nm sections were cut, stained and viewed as above.
Time-lapse imaging
CETN1-GFP-expressing lines were grown on 35-mm MatTek dishes (MatTek Corp.) or coverslips before imaging9. H9 hESCs were seeded on matrigel-coated dishes overnight, then transduced with CETN1-GFP, and grown for >72 hours in complete mTeSR1 medium (Stemcell Technologies). The transduced cells were imaged every 15 min in phenol red-free D-MEM/F12 medium (Invitrogen) with mTeSR1 supplement and 10 mM HEPES, and stained to confirm MBd inheritance. Duplicate dishes of transduced cells were stained for stem cell markers to ensure cell quality.
MBd quantification
Quantification was based on the markers that: 1) labeled both mitotic MBs and MBds (MKLP1, mgcRACGAP, or Cep55); 2) labeled MBs differently than MBds (α-tubulin or Aurora B); 3) defined cell boundaries (α-tubulin or ZO-1). Because Cep55, MKLP1, and mgcRACGAP also label centrioles and spindle midzones, cells were co-stained with centrosome antibody (e.g. 5051), and a size threshold for MB/MBds (1 μm) was introduced to exclude non-MBd structures. Structures with MB-specific or non-MB/MBd labeling were excluded from MBd counts. Cell counts: For hESCs, 5-11 colonies were imaged from triplicates in each experiment. For other cell types, random fields were imaged until n > 500 cells. Each dividing cell was considered one cell.
Doubling time calculations
Cells were seeded (1-1.5×10⁵/60-mm dish), and total cell counts were taken by hemocytometer every 24 hours for 4 days. Alternatively, cells were seeded (2.5-5.0×10³/well, 96-well plates), and the absorbance from an MTS-based colorimetric assay (#G3582; Promega Corp.) was used to estimate cell counts every 24 hours. Timepoints vs. Log10(avg. cell counts or absorbance at that timepoint) was plotted and the slope ascertained. T1/2 = Log10(2)/ slope. For some cell lines, both methods were used and gave similar results.
MBd localization assays
Extracellular trypsin treatment
MKLP1-GFP-expressing HeLa cells grown in MatTek dishes were imaged every 3 min, and underwent no morphological changes upon replacement of media with PBS. After trypsin addition, GFP+ MBds were monitored for 60-90 min for intensity reduction (degradation) or detachment from cells (dissociation).
Co-culture assay
Equal numbers of monomeric RFP- or MKLP-GFP-expressing cells were seeded and co-cultured in 60-mm dishes with coverslips. Cells were stained 2 days later, and the percentage of GFP+ MBds associated with RFP+ cells was determined.
FPP assay
The FPP assay was carried out as reported42 except cells were plated in MatTek dishes 24 hours before co-transfection of MKLP1-GFP and GAPDH-dsRed (Lipofectamine 2000, Invitrogen). Cells were permeabilized and then digested with proteinase K (50 μg ml-1). Constructs labeling mitochondria, peroxisomes, ER and Golgi were used as controls.
Lysosome and proteasome assays
Cells at 70% confluency were incubated with chloroquine (200 μM/PBS; Sigma), E64d + pepstatin A (E64d/PepA) (10 μg ml-1/DMSO each; Sigma)44,51 or solvents alone (controls) for 22 hours before fixation. Lysosome inhibition was confirmed and visualized after 12-hour DQ-Red BSA (10 μl ml-1; Invitrogen) incubation. Mitotic hRPE-1 cells were treated with proteasome inhibitors, MG132 (1 μM; Sigma) or lactacystin (50 μM; Sigma) 1 hour after replating.
Autophagy manipulation assays
MBds were quantified in >500 cells in triplicate unless otherwise noted.
Protein depletion
siRNAs targeting human Atg767, p6212, NBR153 (2503-2521 bp, GenBank NM 005899), Lamin A/C9, and GFP (5’-NNCAUGAAGCAGCACGACUUC-3’) were Dharmacon. MBd levels were analyzed 48 hours after 1-nmol siRNA transfection (Oligofectamine, Invitrogen). For NBR1 and p62 experiments, only cells negative for p62 and/or NBR1 immunofluorescence were analyzed.
Beclin1 (BECN1) overexpression
MBd levels were analyzed in 265 Flag+ and 2200 control MCF-7 cells 48 hours after Flag-BECN1 (4 μg) or mock nucleofection (Amaxa).
LiCl + rapamycin treatment
MBd levels in HeLa cells were examined 24 hours after treatment with LiCl (10 mM; Sigma) and rapamycin (200 nM; Calbiochem), or with DMSO.
CEP55-EGFP overexpression
MBd levels and its NBR1-association were assessed in hRPE-1 cells (1×10⁵/well, 6-well plates) 48 hours after CEP55-EGFP (1 μg), EGFP (1 μg) or mock transfection.
Biochemical assays
Protease and phosphatase inhibitors, cell lysates, SDS-PAGE and immunoblotting were purchased or carried out as described9 unless specified.
Autophagy flux determination
Lysates of E64d/PepA (I) and DMSO (U) treated cells were blotted for α-tubulin and LC3. LC3-II levels were determined and normalized to α-tubulin using ImageJ. Autophagic flux = |100 – ((U/ I LC3-II level) × 100)|.
Immunoprecipitation
hRPE-1 cell lysates (50 mM Tris-HCl pH 7.5, 150 mM NaCl, 2 mM EDTA, 1 mM EGTA, 1% Triton X-100, 10% glycerol, 4°C) were pre-cleared for 1 hour with protein G-plus conjugated agarose beads (Santa Cruz) at 4°C, incubated with 2 μg normal IgG, anti-Cep55 or anti-NBR1 antibodies for 3 hours at 4°C, and incubated overnight at 4°C with 25 μl protein G-plus beads. Following washes with lysis buffer and elution, immunoprecipitated proteins were analyzed by SDS-PAGE and immunoblotting.
Assays for MBd function
Cellular reprogramming
Viral production, transduction and reprogramming were performed as described34,35,55,68. Commercially-available shRNA against NBR1 (pSM2c-shNBR1, V2MM_36901; 4-22 bp, GenBank NM 005899) was cloned into pGIPZ lentiviral vector (Open Biosystems). Embryonic fibroblasts (IMR90), adult fibroblasts (hFib2) and dH1f cells were transduced with either NBR1-specfic or non-targeting shRNA vector, and puromycin-selected to establish NBR1-depleted (shNBR1) and control (shNT) lines. dH1f (2.5×10⁴/assay) were reprogrammed with lentiviral vectors69 (Addgene #21162 and 21164) expressing OCT4, SOX2, KLF4 and c-MYC34,35,68 whereas the reprogramming of IMR90 and hFib2 cells (5×10⁴/assay) also included lentiviral vectors expressing Nanog and Lin2855,69 (Addgene #21163). iPSC colonies were quantified on day 21 based on Tra-1-60 expression using ImageJ, as reported35,68, and with parameters: ≥148 (threshold), 0.5-1 (circularity), and either 10-infinity or 30-infinity (size).
Side Population (SP) assay
The assays were carried out as previously described56 in MCF-7 cells. The MBd levels in SP and non-SP populations were determined as described above.
Soft-agar assays
“MBd high” and “MBd low” subpopulations of MKLP1-GFP-expressing HeLa cells were separated by FACS, and plated in soft-agar (2.5 ×10⁴/well, 6-well plates). The MBd levels were determined 12-15 hours after plating aliquots of subpopulations onto coverslips. For the NBR1-silencing soft-agar assay, NBR1-depleted (shNBR1) and control (shNT) cells (1×10⁵/100-mm dish) were plated. For both assays, cells were grown for ~3 weeks at 37°C, and stained as described70. Colonies were quantified microscopically, and the average from triplicate wells or plates presented.
Antibodies
Antibodies to the following proteins/tags were used in this study
Atg5 (1:2000, Cosmo Bio, CAC-TMD-PH-ATG); Atg7 (1:1000, ProSci, 3617); Actin (1:300, Sigma, AC-40); Aurora B (1:100, BD Trans Lab, 611082); CD13 (1:50, BioLegend, 301707); CD133 (1:200, eBioscience, 14-1331); Cep55 (1:50, 1:100 and 1:1000 for immunofluorescence, Abnova #H00055165-B01, Abnova #H00055165-A01, and the gift from K. Kurtche, respectively; 1:500 for immunoblotting, Genetax #GTX112190); hCenexin1 (1:100, a gift from K.S. Lee); Centriolin (1:200, ref. 9); Flag (1:200, Sigma, F7425); GAPDH (1:8000; Santa Cruz, SC-32233); GFP (1:1000; Abcam, ab6556 and Santa Cruz, sc-9996); GT335 (1:100; a gift from P. Denoulet); β1-Integrin (1:50; BD Phramingen); K15 (1:100; Lab Vision, MS-1068-P); LC3 (1:10 for immunofluorescence, Nano Tools, LC3-5F10; 1:300 for immunoblotting, Novus Bio NB100-2331); LAMP2 (1:50, H4B4 from DSHB); mgcRACGAP (1:500, Abcam, ab2270); MKLP1 (1:1000 for immunofluorescence, 1:200 for immunohistochemistry, 1:10 for immuno-EM, Santa Cruz, sc-867); NBR1 (1:500, Abnova, H00004077-B01P); p62, human samples (1:500, BD Trans Lab, 610833); p62, mouse samples (1:1000, Progen, GP62-C); RFP (1:200, Clontech, 632496); Na-K-ATPase (1:15, α6F from DSHB); α-tubulin (1:100 for immunofluorescence, 1:400 for immunoblotting, Sigma, T9026a; 1:100 for immunofluorescence, Millipore, CBL270); α-tubulin-FITC (1:300, Sigma, F2168); Tra-1-60-biotin (1:200, eBioscience, 13-8863); Ubiquitin (1:2000, BD BioSci, #550944); WGA-Alexa Fluor 555 (1:200, Molecular Probes, W32464); ZO-1-FITC (1:50, Zymed, 33-9111).
Statistics
Data was analyzed by Student’s one-tailed paired t-test or unpaired with Welch’s correction unless specified. One-way ANOVA was used in conjunction with Tukey’s test for comparisons among multiple groups. For the EdU-labeling assay, the EdU intensity was first logarithmically transformed for the use of one-way ANOVA. Statistically analyzed experiments were completed at least 3 times.
Supplementary Material
Acknowledgments
We thank E. Baehrecke for critical reading of the manuscript, T. Schlaeger and colleagues for assistance with H1-OGN and associated cell lines, the UMMS Flow Facility for assistance with MBd-enrichment, P. Furcinitti of UMMS Digital Light Microscopy Core Facility for assistance with imaging, the UMMS DERC Morphology Core for assistance with immunohistochemitry, D. Guertin and C. Sparks for assistance with SMP preparation, S. Lyle and C. Powers for sample preparation, and H-L. Liu for assistance with clone construction. We thank N. Mizushima for GFP-LC3 expressing, Atg5-/-, and matched wild-type MEFs, M. Komatsu and T. Ishii for p62-/- and matched wild-type MEFs, S. Jones for ex vivo C57BL/6 MEFs, B. Lewis for mouse hepatocellular cancer lines, S. Pino for in vitro activated T cells, W. Jiang for MKLP1-GFP plasmid, K. Khanna for CEP55-EGFP plasmid, J. Lippincott-Schwartz and G. Gaietta for plasmids for FPP assay, B. Levine (UT Southwestern) for Flag-tagged BECN1 expressing plasmid, A. Khodjakov for CETN1-GFP expressing plasmids, K. Lee for hCenexin1 antibody and the Progeria Society for cell lines. The α6F antibody to Na-K-ATPase developed by D.M. Fambrough, and H4B4 antibody to LAMP2 developed by J.T. August and J.E.K. Hildreth were obtained from the Developmental Studies Hybridoma Bank developed under the auspices of the NICHD and maintained by The University of Iowa, Department of Biology, Iowa City, IA 52242. This work was supported by funding from the National Institutes of Health (GM051994) to S.J.D and (F32 GM084660-02) to D.M.B, the W.M. Keck Foundation to S.J.D., the Ellison Foundation (AG-SS-1918-07) to S.J.D., the Department of Defense (W81XWH-08-1-0457) to S.J.D. and (W81XWH-06-1-0140) to C-T. Chen, and the Diabetes and Endocrine Resource Center (5P30DK3252025). Core resources supported by the Diabetes Endocrinology Research Center grant DK32520 were also used (DK32520).
Footnotes
AUTHOR CONTRIBUTIONS
C-T.C. and S.J.D. conceived the project and wrote the manuscript with the help of T-C.K. and D.M.B. The experiments on the inheritance and localization of MBds as well as some for MBd degradation were conducted by C-T.C. The experiments on MBd accumulation were conducted by C-T.C. with the help of T-C.K. and C.M.W. Investigation of the mechanisms for MBd degradation was conceived by T-C.K. and S.J.D., and much of the work executed by T-C.K. Autophagic flux assay, soft-agar assay of FACS-isolated cells, and MBd localization in neural progenitors were conducted by D.M.B., who contributed substantially to the work and intellectual input on multiple aspects of this project. The reprogramming assay was conducted and analyzed by T-C.K., T.T.O, and S.L. The preparation of hESCs for live-imaging was conducted by S.A. Tissue preparation was assisted by P.X. and J.M.H.
References
- 1.Eggert US, Mitchison TJ, Field CM. Animal cytokinesis: from parts list to mechanisms. Annu Rev Biochem. 2006;75:543–66. doi: 10.1146/annurev.biochem.74.082803.133425. [DOI] [PubMed] [Google Scholar]
- 2.Neumüller RA, Knoblich JA. Dividing cellular asymmetry: asymmetric cell division and its implications for stem cells and cancer. Genes Dev. 2009;23:2675–99. doi: 10.1101/gad.1850809. [DOI] [PMC free article] [PubMed] [Google Scholar]
- 3.Doxsey S, McCollum D, Theurkauf W. Centrosomes in cellular regulation. Annu Rev Cell Dev Biol. 2005;21:411–34. doi: 10.1146/annurev.cellbio.21.122303.120418. [DOI] [PubMed] [Google Scholar]
- 4.Yamashita YM, Mahowald AP, Perlin JR, Fuller MT. Asymmetric inheritance of mother versus daughter centrosome in stem cell division. Science. 2007;315:518–21. doi: 10.1126/science.1134910. [DOI] [PMC free article] [PubMed] [Google Scholar]
- 5.Wang X, et al. Asymmetric centrosome inheritance maintains neural progenitors in the neocortex. Nature. 2009;461:947–55. doi: 10.1038/nature08435. [DOI] [PMC free article] [PubMed] [Google Scholar]
- 6.Yamashita YM, Jones DL, Fuller MT. Orientation of asymmetric stem cell division by the APC tumor suppressor and centrosome. Science. 2003;301:1547–50. doi: 10.1126/science.1087795. [DOI] [PubMed] [Google Scholar]
- 7.Barr FA, Gruneberg U. Cytokinesis: placing and making the final cut. Cell. 2007;131:847–60. doi: 10.1016/j.cell.2007.11.011. [DOI] [PubMed] [Google Scholar]
- 8.Mullins JM, Biesele JJ. Terminal phase of cytokinesis in D-98s cells. J Cell Biol. 1977;73:672–84. doi: 10.1083/jcb.73.3.672. [DOI] [PMC free article] [PubMed] [Google Scholar]
- 9.Gromley A, et al. Centriolin anchoring of exocyst and SNARE complexes at the midbody is required for secretory-vesicle-mediated abscission. Cell. 2005;123:75–87. doi: 10.1016/j.cell.2005.07.027. [DOI] [PubMed] [Google Scholar]
- 10.Steigemann P, et al. Aurora B-mediated abscission checkpoint protects against tetraploidization. Cell. 2009;136:473–84. doi: 10.1016/j.cell.2008.12.020. [DOI] [PubMed] [Google Scholar]
- 11.Goss JW, Toomre DK. Both daughter cells traffic and exocytose membrane at the cleavage furrow during mammalian cytokinesis. J Cell Biol. 2008;181:1047–54. doi: 10.1083/jcb.200712137. [DOI] [PMC free article] [PubMed] [Google Scholar]
- 12.Pohl C, Jentsch S. Midbody ring disposal by autophagy is a postabscission event of cytokinesis. Nat Cell Biol. 2009;11:65–70. doi: 10.1038/ncb1813. [DOI] [PubMed] [Google Scholar]
- 13.Marzesco AM, et al. Release of extracellular membrane particles carrying the stem cell marker prominin-1 (CD133) from neural progenitors and other epithelial cells. J Cell Sci. 2005;118:2849–58. doi: 10.1242/jcs.02439. [DOI] [PubMed] [Google Scholar]
- 14.Dubreuil V, et al. Midbody and primary cilium of neural progenitors release extracellular membrane particles enriched in the stem cell marker prominin- 1. J Cell Biol. 2007;176:483–95. doi: 10.1083/jcb.200608137. [DOI] [PMC free article] [PubMed] [Google Scholar]
- 15.Mizushima N, Levine B, Cuervo AM, Klionsky DJ. Autophagy fights disease through cellular self-digestion. Nature. 2008;451:1069–75. doi: 10.1038/nature06639. [DOI] [PMC free article] [PubMed] [Google Scholar]
- 16.Mizushima N, Klionsky D. Protein turnover via autophagy: implications for metabolism. Annu Rev Nutr. 2007;27:19–40. doi: 10.1146/annurev.nutr.27.061406.093749. [DOI] [PubMed] [Google Scholar]
- 17.Yorimitsu T, Klionsky DJ. Eating the endoplasmic reticulum: quality control by autophagy. Trends Cell Biol. 2007;17:279–85. doi: 10.1016/j.tcb.2007.04.005. [DOI] [PubMed] [Google Scholar]
- 18.Levine B, Kroemer G. Autophagy in the pathogenesis of disease. Cell. 2008;132:27–42. doi: 10.1016/j.cell.2007.12.018. [DOI] [PMC free article] [PubMed] [Google Scholar]
- 19.Kuma A, et al. The role of autophagy during the early neonatal starvation period. Nature. 2004;432:1032–6. doi: 10.1038/nature03029. [DOI] [PubMed] [Google Scholar]
- 20.Fimia GM, et al. Ambra1 regulates autophagy and development of the nervous system. Nature. 2007;447:1121–5. doi: 10.1038/nature05925. [DOI] [PubMed] [Google Scholar]
- 21.Tsukamoto S, et al. Autophagy is essential for preimplantation development of mouse embryos. Science. 2008;321:117–20. doi: 10.1126/science.1154822. [DOI] [PubMed] [Google Scholar]
- 22.Cecconi F, Levine B. The role of autophagy in mammalian development: cell makeover rather than cell death. Dev Cell. 2008;15:344–57. doi: 10.1016/j.devcel.2008.08.012. [DOI] [PMC free article] [PubMed] [Google Scholar]
- 23.Hara T, et al. Suppression of basal autophagy in neural cells causes neurodegenerative disease in mice. Nature. 2006;441:885–9. doi: 10.1038/nature04724. [DOI] [PubMed] [Google Scholar]
- 24.Komatsu M, et al. Impairment of starvation-induced and constitutive autophagy in Atg7-deficient mice. J Cell Biol. 2005;169:425–34. doi: 10.1083/jcb.200412022. [DOI] [PMC free article] [PubMed] [Google Scholar]
- 25.Rujano MA, et al. Polarised asymmetric inheritance of accumulated protein damage in higher eukaryotes. PLoS Biol. 2006;4:2325–2335. doi: 10.1371/journal.pbio.0040417. [DOI] [PMC free article] [PubMed] [Google Scholar]
- 26.Johnston JA, Illing ME, Kopito RR. Cytoplasmic dynein/dynactin mediates the assembly of aggresomes. Cell Motil Cytoskeleton. 2002;53:26–38. doi: 10.1002/cm.10057. [DOI] [PubMed] [Google Scholar]
- 27.Anderson CT, Stearns T. Centriole age underlies asynchronous primary cilium growth in mammalian cells. Curr Biol. 2009;19:1498–502. doi: 10.1016/j.cub.2009.07.034. [DOI] [PMC free article] [PubMed] [Google Scholar]
- 28.Piel M, Meyer P, Khodjakov A, Rieder CL, Bornens M. The respective contributions of the mother and daughter centrioles to centrosome activity and behavior in vertebrate cells. J Cell Biol. 2000;149:317–30. doi: 10.1083/jcb.149.2.317. [DOI] [PMC free article] [PubMed] [Google Scholar]
- 29.Oatley JM, Brinster RL. Regulation of spermatogonial stem cell self-renewal in mammals. Annu Rev Cell Dev Biol. 2008;24:263–86. doi: 10.1146/annurev.cellbio.24.110707.175355. [DOI] [PMC free article] [PubMed] [Google Scholar]
- 30.Barroca V, et al. Mouse differentiating spermatogonia can generate germinal stem cells in vivo. Nat Cell Biol. 2009;11:190–6. doi: 10.1038/ncb1826. [DOI] [PubMed] [Google Scholar]
- 31.Bilgüvar K, et al. Whole-exome sequencing identifies recessive WDR62 mutations in severe brain malformations. Nature. 2010;467:207–10. doi: 10.1038/nature09327. [DOI] [PMC free article] [PubMed] [Google Scholar]
- 32.Morris RJ, et al. Capturing and profiling adult hair follicle stem cells. Nat Biotechnol. 2004;22:411–7. doi: 10.1038/nbt950. [DOI] [PubMed] [Google Scholar]
- 33.Conboy MJ, Cerletti M, Wagers AJ, Conboy IM. Immuno-analysis and FACS sorting of adult muscle fiber-associated stem/precursor cells. Methods Mol Biol. 2010;621:165–73. doi: 10.1007/978-1-60761-063-2_11. [DOI] [PubMed] [Google Scholar]
- 34.Park IH, et al. Reprogramming of human somatic cells to pluripotency with defined factors. Nature. 2008;451:141–6. doi: 10.1038/nature06534. [DOI] [PubMed] [Google Scholar]
- 35.Chan EM, et al. Live cell imaging distinguishes bona fide human iPS cells from partially reprogrammed cells. Nat Biotechnol. 2009;27:1033–7. doi: 10.1038/nbt.1580. [DOI] [PubMed] [Google Scholar]
- 36.Zwaka TP, Thomson JA. Homologous recombination in human embryonic stem cells. Nat Biotechnol. 2003;21:319–21. doi: 10.1038/nbt788. [DOI] [PubMed] [Google Scholar]
- 37.Visvader JE, Lindeman GJ. Cancer stem cells in solid tumours: accumulating evidence and unresolved questions. Nat Rev Cancer. 2008;8:755–68. doi: 10.1038/nrc2499. [DOI] [PubMed] [Google Scholar]
- 38.O’Brien CA, Pollett A, Gallinger S, Dick JE. A human colon cancer cell capable of initiating tumour growth in immunodeficient mice. Nature. 2007;445:106–10. doi: 10.1038/nature05372. [DOI] [PubMed] [Google Scholar]
- 39.Pece S, et al. Biological and molecular heterogeneity of breast cancers correlates with their cancer stem cell content. Cell. 2010;140:62–73. doi: 10.1016/j.cell.2009.12.007. [DOI] [PubMed] [Google Scholar]
- 40.Pardal R, Clarke MF, Morrison SJ. Applying the principles of stemcell biology to cancer. Nat Rev Cancer. 2003;3:895–902. doi: 10.1038/nrc1232. [DOI] [PubMed] [Google Scholar]
- 41.Salic A, Mitchison TJ. A chemical method for fast and sensitive detection of DNA synthesis in vivo. Proc Natl Acad Sci U S A. 2008;105:2415–20. doi: 10.1073/pnas.0712168105. [DOI] [PMC free article] [PubMed] [Google Scholar]
- 42.Lorenz H, Hailey DW, Lippincott-Schwartz J. Fluorescence protease protection of GFP chimeras to reveal protein topology and subcellular localization. Nat Methods. 2006;3:205–10. doi: 10.1038/nmeth857. [DOI] [PubMed] [Google Scholar]
- 43.Eskelinen EL, Tanaka Y, Saftig P. At the acidic edge: emerging functions for lysosomal membrane proteins. Trends Cell Biol. 2003;13:137–45. doi: 10.1016/s0962-8924(03)00005-9. [DOI] [PubMed] [Google Scholar]
- 44.Klionsky DJ, et al. Guidelines for the use and interpretation of assays for monitoring autophagy in higher eukaryotes. Autophagy. 2008;4:151–75. doi: 10.4161/auto.5338. [DOI] [PMC free article] [PubMed] [Google Scholar]
- 45.Liang XH, et al. Induction of autophagy and inhibition of tumorigenesis by beclin 1. Nature. 1999;402:672–6. doi: 10.1038/45257. [DOI] [PubMed] [Google Scholar]
- 46.Sato K, et al. Autophagy is activated in colorectal cancer cells and contributes to the tolerance to nutrient deprivation. Cancer Res. 2007;67:9677–84. doi: 10.1158/0008-5472.CAN-07-1462. [DOI] [PubMed] [Google Scholar]
- 47.Sarkar S, et al. A rational mechanism for combination treatment of Huntington’s disease using lithium and rapamycin. Hum Mol Genet. 2008;17:170–8. doi: 10.1093/hmg/ddm294. [DOI] [PubMed] [Google Scholar]
- 48.Sarkar S, et al. Lithium induces autophagy by inhibiting inositol monophosphatase. J Cell Biol. 2005;170:1101–11. doi: 10.1083/jcb.200504035. [DOI] [PMC free article] [PubMed] [Google Scholar]
- 49.Mizushima N, Yoshimori T. How to interpret LC3 immunoblotting. Autophagy. 2007;3:542–5. doi: 10.4161/auto.4600. [DOI] [PubMed] [Google Scholar]
- 50.Bjorkoy G, et al. p62/SQSTM1 forms protein aggregates degraded by autophagy and has a protective effect on huntingtin-induced cell death. J Cell Biol. 2005;171:603–14. doi: 10.1083/jcb.200507002. [DOI] [PMC free article] [PubMed] [Google Scholar]
- 51.Komatsu M, et al. Homeostatic levels of p62 control cytoplasmic inclusion body formation in autophagy-deficient mice. Cell. 2007;131:1149–63. doi: 10.1016/j.cell.2007.10.035. [DOI] [PubMed] [Google Scholar]
- 52.Pankiv S, et al. p62/SQSTM1 binds directly to Atg8/LC3 to facilitate degradation of of ubiquitinated protein aggregates by autophagy. J Biol Chem. 2007;282:24131–45. doi: 10.1074/jbc.M702824200. [DOI] [PubMed] [Google Scholar]
- 53.Kirkin V, et al. A role for NBR1 in autophagosomal degradation of ubiquitinated substrates. Mol Cell. 2009;27:505–16. doi: 10.1016/j.molcel.2009.01.020. [DOI] [PubMed] [Google Scholar]
- 54.Waters S, et al. Interactions with LC3 and polyubiquitin chains link nbr1 to autophagic protein turnover. FEBS Lett. 2009;583:1846–52. doi: 10.1016/j.febslet.2009.04.049. [DOI] [PubMed] [Google Scholar]
- 55.Yu J, et al. Induced pluripotent stem cell lines derived from human somatic cells. Science. 2007;318:1917–20. doi: 10.1126/science.1151526. [DOI] [PubMed] [Google Scholar]
- 56.Engelmann K, Shen H, Finn OJ. MCF7 side population cells with characteristics of cancer stem/progenitor cells express the tumor antigen MUC1. Cancer Res. 2008;68:2419–26. doi: 10.1158/0008-5472.CAN-07-2249. [DOI] [PubMed] [Google Scholar]
- 57.Zhang Y, et al. SEPA-1 mediates the specific recognition and degradation of P granule components by autophagy in C. elegans. Cell. 2009;136:308–21. doi: 10.1016/j.cell.2008.12.022. [DOI] [PubMed] [Google Scholar]
- 58.Strome S. Specification of the germ line. WormBook. 2005;28:1–10. doi: 10.1895/wormbook.1.9.1. [DOI] [PMC free article] [PubMed] [Google Scholar]
- 59.Fuchs E. The tortoise and the hair: slow-cycling cells in the stem cell race. Cell. 2009;137:811–9. doi: 10.1016/j.cell.2009.05.002. [DOI] [PMC free article] [PubMed] [Google Scholar]
- 60.Lamark T, et al. Interaction codes within the family of mammalian Phox and Bem1p domain-containing proteins. J Biol Chem. 2003;278:34568–81. doi: 10.1074/jbc.M303221200. [DOI] [PubMed] [Google Scholar]
- 61.Majeski AE, Dice JF. Mechanisms of chaperone-mediated autophagy. Int J Biochem Cell Biol. 2004;36:2435–44. doi: 10.1016/j.biocel.2004.02.013. [DOI] [PubMed] [Google Scholar]
- 62.Kaushik, et al. Constitutive Activation of Chaperone-mediated Autophagy in Cells with Impaired Macroautophagy. Mol Biol Cell. 2008;19:2179–92. doi: 10.1091/mbc.E07-11-1155. [DOI] [PMC free article] [PubMed] [Google Scholar]
- 63.Nedelsky N, et al. Autophagy and the ubiquitin-proteasome system: collaborators in neuroprotection. Biochim Biophys Acta. 2008;1782:691–9. doi: 10.1016/j.bbadis.2008.10.002. [DOI] [PMC free article] [PubMed] [Google Scholar]
- 64.Xu P, Davis RJ. c-Jun NH2-terminal kinase is required for lineagespecific differentiation but not stem cell self-renewal. Mol Cell Biol. 2010;30:1329–40. doi: 10.1128/MCB.00795-09. [DOI] [PMC free article] [PubMed] [Google Scholar]
- 65.Greenbaum MP, Ma L, Matzuk MM. Conversion of midbodies into germ cell intercellular bridges. Dev Biol. 2007;305:389–96. doi: 10.1016/j.ydbio.2007.02.025. [DOI] [PMC free article] [PubMed] [Google Scholar]
- 66.Mitchison T, Evans L, Schulze E, Kirschner M. Sites of microtubule assembly and disassembly in the mitotic spindle. Cell. 1986;45:515–27. doi: 10.1016/0092-8674(86)90283-7. [DOI] [PubMed] [Google Scholar]
- 67.Yu L, et al. Regulation of an ATG7-beclin 1 program of autophagic cell death by caspase-8. Science. 2004;304:1500–2. doi: 10.1126/science.1096645. [DOI] [PubMed] [Google Scholar]
- 68.Loewer S, et al. Large intergenic non-coding RNA-RoR modulates reprogramming of human induced pluripotent stem cells. Nat Genet. 2010;42:1113–7. doi: 10.1038/ng.710. [DOI] [PMC free article] [PubMed] [Google Scholar]
- 69.Yu J, et al. Human induced pluripotent stem cells free of vector and transgene sequences. Science. 2009;324:797–801. doi: 10.1126/science.1172482. [DOI] [PMC free article] [PubMed] [Google Scholar]
- 70.Sachdev S, Bu Y, Gelman IH. Paxillin-Y118 phosphorylation contributes to the control of Src-induced anchorage-independent growth by FAK and adhesion. BMC Cancer. 2009;12(9):12. doi: 10.1186/1471-2407-9-12. [DOI] [PMC free article] [PubMed] [Google Scholar]
Associated Data
This section collects any data citations, data availability statements, or supplementary materials included in this article.