Abstract
In vitro mechanotransduction studies, uncovering the basic science of the response of cells to mechanical forces, are essential for progress in tissue engineering and its clinical application. Many varying investigations have described a multitude of cell responses; however, as the precise nature and magnitude of the stresses applied are infrequently reported and rarely validated, the experiments are often not comparable, limiting research progress. This paper provides physical and biological validation of a widely available fluid stimulation device, a see-saw rocker, as an in vitro model for cyclic fluid shear stress mechanotransduction. This allows linkage between precisely characterized stimuli and cell monolayer response in a convenient six-well plate format. Models of one well were discretized and analysed extensively using computational fluid dynamics to generate convergent, stable and consistent predictions of the cyclic fluid velocity vectors at a rocking frequency of 0.5 Hz, accounting for the free surface. Validation was provided by comparison with flow velocities measured experimentally using particle image velocimetry. Qualitative flow behaviour was matched and quantitative analysis showed agreement at representative locations and time points. Maximum shear stress of 0.22 Pa was estimated near the well edge, and time-average shear stress ranged between 0.029 and 0.068 Pa. Human tenocytes stimulated using the system showed significant increases in collagen and GAG secretion at 2 and 7 day time points. This in vitro model for mechanotransduction provides a versatile, flexible and inexpensive method for the fluid shear stress impact on biological cells to be studied.
Keywords: cyclic fluid flow, shear stress, rocking, computational fluid dynamics, particle image velocimetry, tenocytes
1. Introduction
Mechanotransduction is the process whereby a cell is enabled to sense mechanical cues in its external environment and convert them into a biochemical signal and ultimately a biological response. This response to a mechanical stimulus is vital for cells to perform their individual roles in tissues in the mature organism [1] and essential in the formation of tissue patterns during development [2]. Harnessing the beneficial effects of mechanical forces on cells is essential for the development of regenerative clinical therapies as well as designing optimal tissue engineering techniques [3,4]. Fluid flow is a required part of tissue engineering techniques for cell seeding and nutrient provision during growth, and has been shown to impact anabolic pathways, as measured by gene expression in a variety of cell types [5–7].
In vitro models are convenient for the study of gene expression, protein synthesis and cell morphology. Previous studies have created novel methods of applying fluid forces to cell monolayers, yet reported applied stresses remain without validation limiting the comparability of studies [8].
Recent in vitro work showed that the primary functions of musculoskeletal cells are affected by low-frequency, cyclic, fluid shear [9,10], with reported shear stress taken from mathematical modelling of a see-saw rocker [11]. Without empirical support, mathematical models provide predictions with limited confidence. Furthermore, previous work has identified that a popular, commercially available device thought to primarily apply an axial stress to cells [12] also applies a shear stress due to fluid flow [13].
Computational fluid dynamics (CFD) is a widely applied technique that employs simplifying assumptions in order to solve fluid dynamics equations across finite volumes to determine overall flow behaviour. While CFD is a mature and reliable method, proper verification is still necessary, the accepted standard of which is to make experimental flow field measurements using a high-fidelity technique, such as particle image velocimetry (PIV). Matching PIV data with CFD simulations justifies the simplifications and assumptions of the model and thus increases confidence in computationally derived values such as shear stress. Detailed and accurate knowledge of shear stress is essential for understanding cell behaviour in tissue engineering methods.
The aim of this study was to provide physical and biological validation of a new in vitro model for mechanotransduction. This was achieved through the comparison of a CFD-generated flow field with PIV measurement within cylindrical wells of a six-well plate on a see-saw rocker to support the CFD-derived shear stresses acting on the cell monolayer. Further, tendon fibroblastic cells (tenocytes), exemplary of the musculoskeletal system, were exposed to varying durations of stimulus and cell viability with extracellular matrix (ECM) production investigated as representative of their primary functions.
2. Material and methods
2.1. Method of stimulation
A Stuart SSL4 (Bibby Scientific, UK) see-saw rocker with a tilt angle of 7° was used to generate flow at a range of 5–70 oscillations per minute (OPM) using a digital selection method to give accurate speed choice and reproducibility. The device allows the application of highly reproducible cyclic laminar flow across cell monolayers in six-well cell-culture treated plates placed on top of the rocker. Video analysis confirmed the sinusoidal motion of the see-saw rocker with centre of rotation 35 mm below the centre of the rocker platform.
2.2. Fluid dynamics modelling
Initial consideration of the dimensions, fluid velocity and viscosity of flow in a six-well plate indicate laminar properties (Re = 167, where the Reynolds number is defined using a hydraulic radius of 1.86 mm (area of 72.8 mm2 divided by the wetted perimeter of 39.16 mm) as the length scale and 0.07 m s−1 as the velocity). Velocity was predicted based on an angular rocking frequency of 0.5 Hz. Transition to turbulent flow is evaluated to occur at a flow velocity of 0.8 m s−1.
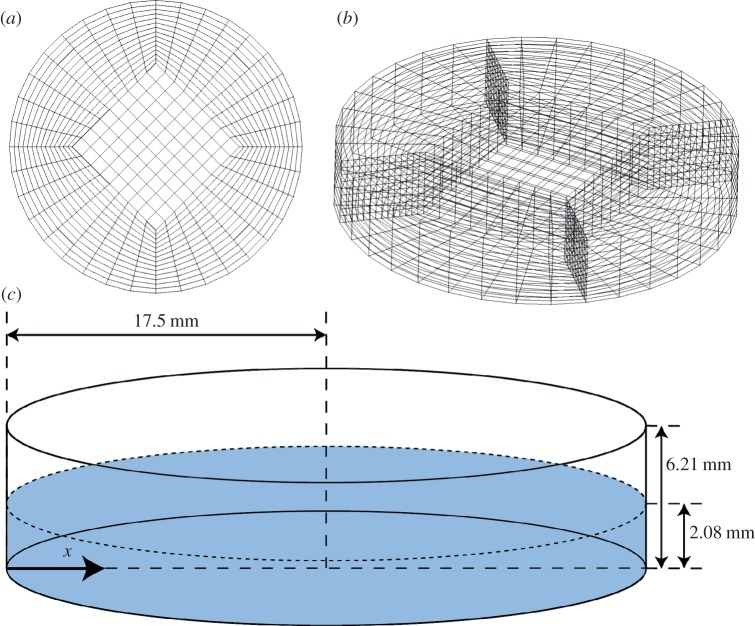
Using geometric modelling and grid generation tools (CFD-GEOM, ESI CFD, France), a domain was established to represent a single well with a height of 6.2 mm and a diameter of 35 mm (figure 1). A butterfly pattern was used to mesh the base of the well using five structured faces with a 360-point circumferential resolution. The mesh grid for the entire cylindrical structure was obtained by extruding this two-dimensional mesh.
Figure 1.
(a) Graphical representation of a butterfly mesh; (b) vertical extrusion of butterfly mesh by 6.21 mm creates the grid used for CFD modelling; (c) schematic showing model dimensions and the x-coordinate system used for analysis. The plane defined by the dashed circumference is the initial free surface boundary, as specified in the volume of fluid method [14].
The fluid depth in the horizontal well was modelled to be 2.08 mm (based upon standard cell culture practices of 2 ml volume of fluid), with a viscosity of 7.8 × 10⁻⁴ kg m−1 s−1 and a density of 1000 kg m−3 [15]. The base and vertical boundaries of the well were assigned no-slip conditions, while the top of the well was modelled as an atmospheric pressure boundary, to represent interaction with the open space above the well. The origin of the coordinate system was located 35 mm below the base of the well, and motion was modelled by sinusoidal rotation about the y-axis at 0.5 Hz and an amplitude of ±7°.
During motion, the interior grid of the well was automatically re-meshed at each time step (0.001 s) through a standard Transfinite Interpolation scheme, which determines the interior node distribution based on the motion of the boundary. The motion of the fluid induced by this movement of the well was then computed by a finite volume solver (CFD-ACE+, ESI CFD), which numerically solves the Navier–Stokes equations. A SIMPLEC-type [16] pressure correction method, along with second-order-accurate discretization in space and time (central differences and second-order time-marching, respectively), and an algebraic multigrid convergence acceleration method [17] are applied.
In addition, the volume of fluid (VoF) technique [14] is employed in order to track and locate the free surface of the liquid within this domain. Within the model, the Bond number was calculated to be much greater than 1 (Bo = 167, where the Bond number is calculated from a length scale of 35 mm and surface tension of 0.072 Nm−1), signifying that the gravitational and inertial forces override capillary effects. As such, computational modelling of surface tension has been neglected in the model of the free surface and a single line interface construction scheme has been employed to track the free surface [18]. A static contact angle has been assigned as the free surface–wall interaction boundary condition. Contact angle measurements confirmed the material of the well to be slightly hydrophilic (water: 84.95 ± 1.39°, medium: 79.74 ± 1.47°); therefore, a static contact angle of 90° was deemed an appropriate assumption.
For the main data presented here, the model was run for a total of 12 000 time steps, capturing six complete cycles. The sixth cycle was used for analysis and inspection; it showed that reported flow velocities of the sixth cycle matched those of the fifth to an accuracy of 99%, confirming that a repeating flow field had been achieved.
2.3. Particle image velocimetry
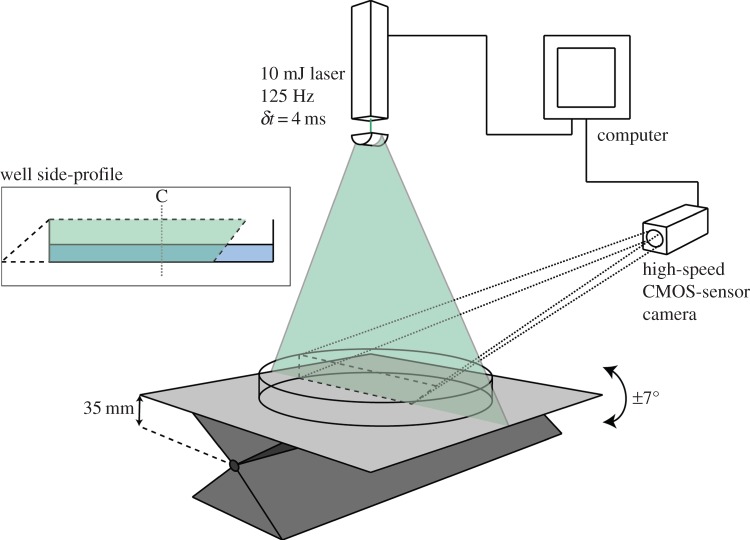
The rocker and a six-well plate, cut down to enable clear imaging, were positioned within a laser sheet PIV set-up (figure 2). A flow field area of approximately 60 × 60 mm was recorded using a high-speed CMOS-sensor camera (Photron SA3: 1024 × 1024 pixels; Photron Ltd, UK). The camera was equipped with a 105 mm lens (Sigma 105 mm f2.8 EX DG), set to aperture 2.8 and mounted on a Scheimpflug adapter. The fluid was seeded with a ca 1% suspension of 48 μm polymer microspheres (density 1.05 g cm−3, Stokes number 0.094 at 3 cm s−1; Duke Scientific Corporation, UK). The suspension was illuminated by a 10 mJ laser (Nd:YLF, 527 nm, Litron LDY-300PIV; Litron Lasers Ltd, UK) producing pulse pairs with a repetition rate of 125 Hz and a pulse separation interval of δt = 4 ms (resulting in an average displacement of 2.5 pixels and negligible peak-locking). The optics chassis was equipped with a −10 mm cylindrical lens spreading the laser beam into a 2 mm thick vertical light sheet across the diameter of the well perpendicular to the tilt axis (figure 2).
Figure 2.
PIV experimental apparatus. A 2 mm thick laser sheet highlights a central plane within the well geometry. A high-speed camera captures the motion of fluorescent microspheres in this plane. Well side-profile: the overlap of camera capture and laser sheet covers 70% of the well base, ensuring that 50% of the well is captured during a complete cycle. C denotes the well centre.
The laser and camera were controlled by the DaVis v. 7.2.2 software package (LaVision GmbH, Germany) and were triggered by a common high-speed controller signal. The camera was calibrated with the built-in calibration routine in DaVis v. 7.2.2 using a 105 × 105 mm dual plane calibration plate (type 11; LaVision GmbH).
The recorded PIV data (125 frames per second) were processed using the graphical processing unit module of DaVis v. 8.0.8. Raw images were filtered by subtracting a sliding minimum over three frames. Vector fields were computed from the filtered images using multi-pass cross-correlation starting with interrogation windows of 64 × 64 pixels, reducing stepwise to 12 × 12 pixels with 50% overlap for the final pass. The water depth of 2 mm corresponded to 32 pixels in the PIV raw images, so with the overlap of 50% between the interrogation windows this resulted in five to six vectors across the depth. Vectors were considered erroneous and deleted if the magnitude was equal to, or greater than, twice the neighbourhood RMS and reinserted as interpolated vectors if the magnitude was less than three times the neighbourhood RMS (closest neighbour vectors). The proportion of erroneous vectors was on average 28 ± 1.8% on a sample of 30 vector fields. Empty spaces were filled by interpolation (an average of all non-zero neighbour vectors), and the final vector fields were subject to a 3 × 3 smoothing. To further reduce noise, vector fields were reconstructed using the first 20 modes identified from proper orthogonal decomposition (POD) analysis performed in DaVis v. 8.0.8. POD is a technique that identifies the repeated vectors from a signal for reconstruction, thus eliminating non-periodic noise from the final signal used for analysis. The number of modes included in the reconstruction was chosen conservatively to strongly filter non-cyclic noise while at the same time retain the salient features of the flow. The results from the PIV were used to validate the main flow characteristics from the CFD model.
2.4. Cell culture, stimulation protocol and biochemical assays
Tenocyte populations were explanted from healthy hamstring tendon tissue samples obtained from anterior cruciate ligament replacement surgery in accordance with methods previously described [19]. Tissue samples from two patients were obtained from the Oxford Musculoskeletal Biobank and were collected with informed donor consent in full compliance with national and institutional ethics requirements, the United Kingdom Human Tissue Act and the Declaration of Helsinki (HTA Licence 12217 and Oxford REC C 09/H0606/11). Tendon tissue was mechanically broken down into 1 mm2 pieces, allowing tenocytes to migrate out from the tissue and proliferate.
Tenocytes (up to passage 3) in Dulbecco's modified Eagle medium (DMEM):F12 (Lonza, Slough, UK), 10% fetal calf serum (FCS) (Biosera, Ringmer, UK) and 1% penicillin streptomycin (PS) solution were cultured to confluency in six-well plates treated with an adherent coating (Greiner Bio-One, UK).
Tenocytes were stimulated under two loading regimes, either 7 days constant stimulation, or stimulation for 4 h, rest for 20 h and finally stimulation for 4 h (total regime duration of 28 h). These loading regimes are referred to as continuous loading and short-interval (SI) loading, respectively, and both sets of loading were at 5 OPM. Control wells were cultured for the same duration, but subjected to no loading. Prior to stimulation, the medium was replenished with 2 ml of a 0% FCS, 1% PS, DMEM solution in order to inhibit cell proliferation. All experiments were carried out in a 5% CO2, 95% air humidifying chamber at 37°C. The medium was refreshed every 3 days to allow for transport phenomena.
In order to analyse the effect of fluid shear on ECM production, 24 h post-stimulation, Sircol (Biocolor, UK) and dimethyl-methylene blue biochemical assays were employed for collagen and GAG measurement, respectively. A PicoGreen assay was used to normalize all data against double-stranded DNA (dsDNA) content using a representative well for each control and test condition. Cells were lysed using a sonicator (Sonicator W-225; Heat Systems-Ultrasonics Inc., USA).
2.5. Statistical analysis
All statistical analysis was completed within Prism (GraphPad Software Inc., CA, USA) using an independent-samples t-test. Results are considered significant when the calculated p-value is less than 0.05. All error bars presented are the s.e.m.
3. Results
3.1. Computational modelling
Grid independence was achieved with a grid size of 1 068 445 cells, after testing meshes of 107 640, 177 625, 310 930, 497 835, 747 340, 1 068 445 and 1 470 150 elements. Differences in velocities between the finest and the second finest mesh were always under 1%. Time-step size optimization and parallel run procedures were used to ensure model convergence in the shortest period of time. In-built auto-time-step functions proved to be too time consuming owing to the fluctuating sinusoidal angular velocity input. Estimations of the Courant–Friedrichs–Lewy (CFL) number, based on angular velocity, indicated the use of 0.001 s as a suitable time-step size, aiming for a CFL value of 0.25. Full volume data files and selected monitoring point time series of velocity and shear stress at select locations (at the well base along the centre line) were recorded.
3.2. Particle image velocimetry validation of computational fluid dynamics
Owing to laminar conditions, fluid flow was expected to oscillate with the sinusoidal angular frequency dictated by the see-saw rocker. Peaks of velocity were expected to occur at 0° as the bulk of the fluid is being displaced from one side of the well to the other. At maximal angles of tilt, it was expected that the fluid would reach its lowest velocity as the angular velocity reaches zero in preparation to change direction. Owing to boundary layer effects, flow velocities were expected to be especially low at the well base, in contrast to higher fluid velocities at the air–medium interface.
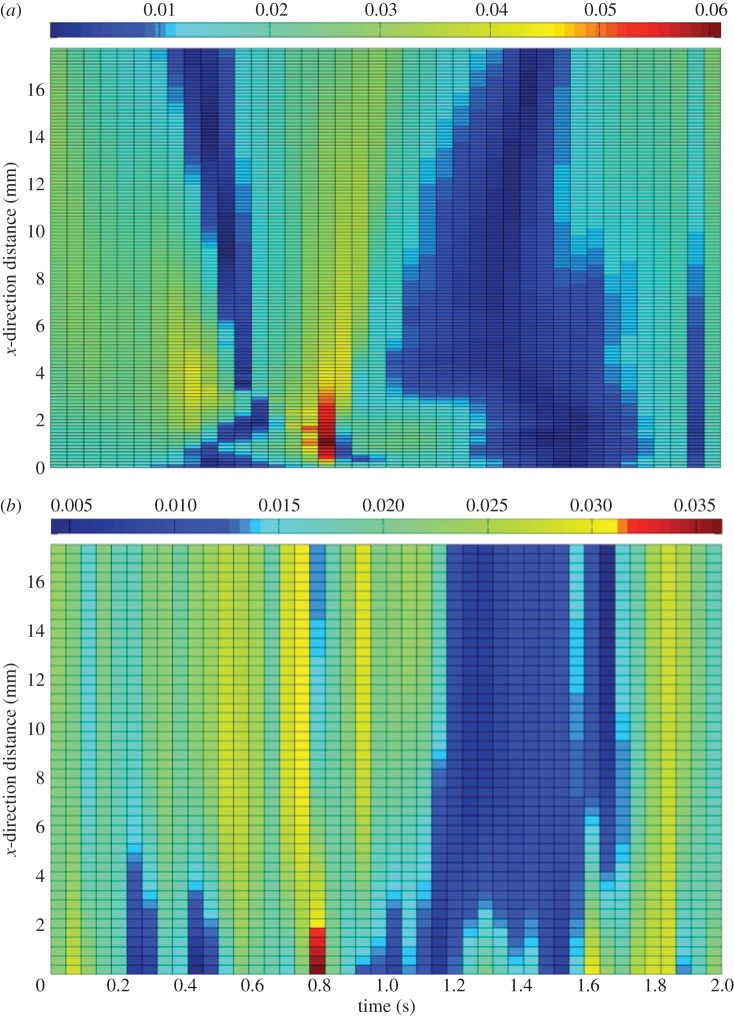
A qualitative comparison of low-pass filtered PIV and CFD velocity magnitude patterns indicates that flow follows this pattern as expected, with a clear peak in velocity magnitude occurring in both analyses at 0.8 s (figure 3). At 0.8 s, velocity peaks near the well edge and reduces across the radius of the well to the centre. Prior to 0.8 s, the well is accelerating towards the 0° position causing the flow to be directed across the well from one side to the other.
Figure 3.
(a) CFD velocity magnitude. (b) PIV velocity magnitude subjected to a low-pass filter (m s−1). Velocity magnitudes are presented along the centre line of the well for one-half of the diameter owing to phase-symmetric flow behaviour. One complete cycle is shown. (For further information, see electronic supplementary material, ‘CFD velocity profile’ and ‘PIV velocity profile’.)
A clear area of matching low-velocity magnitude, indicated by dark blue, is visible in both the PIV and CFD surface plots (figure 3). During this period, the well is reaching its maximal angle of tilt of 7° before coming to a complete standstill and accelerating in the opposite direction. For the half of the well analysed, during this time period, the fluid depth is at its maximum as the bulk of the culture medium has displaced to one side of the well.
After an area of low velocity, and once the rocker has stopped and then changed direction, velocities begin to increase once more, as the rocker accelerates towards the horizontal start-point (1.5–2.0 s).
Raw-PIV data were subjected to a low-pass filter (pass band of 2–3 Hz and signal attenuation of 45 dB). Prior to filtering, raw-PIV velocity magnitude had a range of 0–55 mm s−1. Post-filtering this reduced to 0–36 mm s−1, indicating that some noise is present in the signal. A pass band of 2–3 Hz was used as the rocker is rotating at 0.5 Hz, and flow frequencies were expected to be in that range, since no higher frequency instabilities emerge.
PIV vectors were calculated at 0.44 mm intervals. Extracting the PIV data proved to be complicated owing to the moving platform and inherent difficulties connected with identifying the base of the well. Within the captured flow field, the area of rotating data was identified for each time step of 4 ms and the second lowest velocity vectors extracted within this field. As the vector grid used to calculate velocity vectors did not move with the rotating platform, linear interpolation was required to obtain an array of vectors for the well base.
As the resolution of the PIV was limited to 0.44 mm, CFD velocity magnitude was extracted 0.1 mm above the well base (and thus securely away from the no-slip condition) and additionally at 0.4 mm. This provided a range for the CFD across the well centre line and was used as a tool for quantitative analysis.
Such quantitative analysis was performed at 0.8 s, as the instant that the velocity peak occurred, for both the filtered-PIV and CFD data.
Analysis showed that the filtered-PIV signal fell comfortably within the CFD velocity magnitude boundaries extracted at the 0.1 and 0.4 mm positions (figure 4). The low-pass filter resulted in a smoothing process of the PIV data, eliminating noise, but potentially also eliminating some of the true signal. Comparison of the raw-PIV data with the CFD boundary at 0.4 mm shows a very similar general trend, albeit at a lower magnitude. A peak in the raw-PIV data is present in the 0.4 mm CFD signal at 2 mm radially from the well centre. In addition, at 14 mm, a large peak in the PIV, where some noise may be present, is also reflected by a small increase in the 0.4 mm CFD signal that was otherwise following a gradual descent. As a result, it is suggested that some of the true signal may have been eliminated by the low-pass filter that resulted in an over-smoothing effect seen across the PIV data in figure 3.
Figure 4.
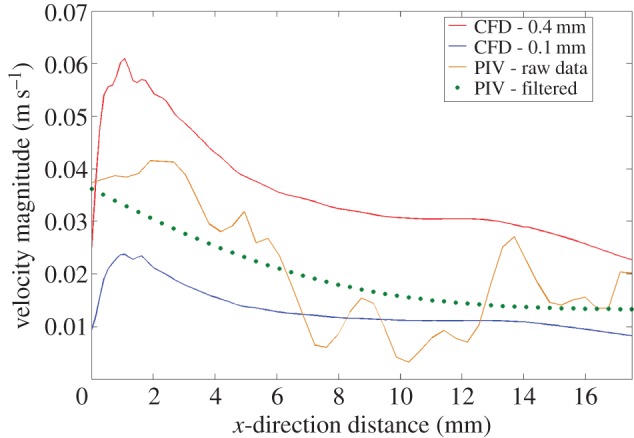
Quantitative comparison of PIV raw and filtered velocity magnitudes with CFD velocity magnitudes at 0.1 and 0.4 mm above the base of the well.
In conclusion, it is clear that the PIV and CFD velocity magnitudes indicate that flow behaviour matches. A clear peak in both the CFD and PIV data is present and practically coincident, and, in addition, flow velocities follow predictions as they increase and decrease when reaching the 0° and 7° positions, respectively. Quantitative analysis has indicated that PIV velocities obtained at a resolution of 0.44 mm fall within the range of CFD velocities obtained at the same resolution.
3.3. Characterizing fluid behaviour and shear stress at the cell layer
Analysis of CFD-predicted shear stress at the base of the well along a central plane (figure 5) shows that the vast majority of the well is subjected to largely similar shear stresses. The exception to this relatively uniform behaviour is noted 1.05 mm from the well edge, where shear stress reaches 0.22 Pa, a 6.7-fold increase on the time-averaged shear stress of 0.033 Pa; although it is noted that the ascent and descent from this peak occurs for only 0.3 s of the 2 s cycle. The shear stress maps in figure 6 show that this peak in shear stress is limited to the edge of the well and quickly reduces to much lower shear stresses across the remainder of the well.
Figure 5.
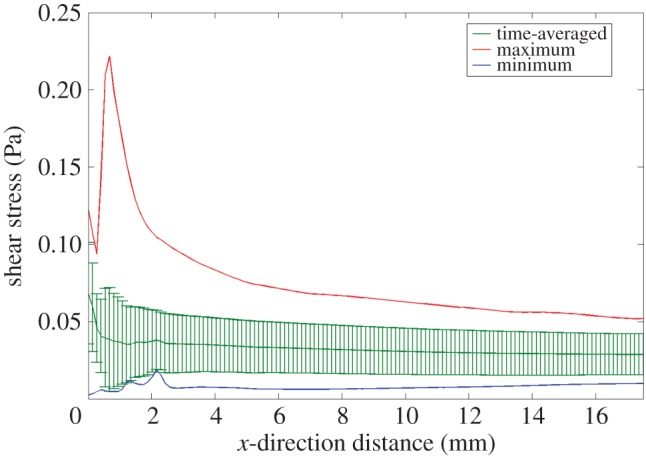
Maximum, time-averaged and minimum shear stress along the well centre line. Standard deviation bars are shown on the time-averaged profile, indicating relatively minimal variance at each location. (For further information, see electronic supplementary material, ‘CFD shear stress profile’.)
Figure 6.
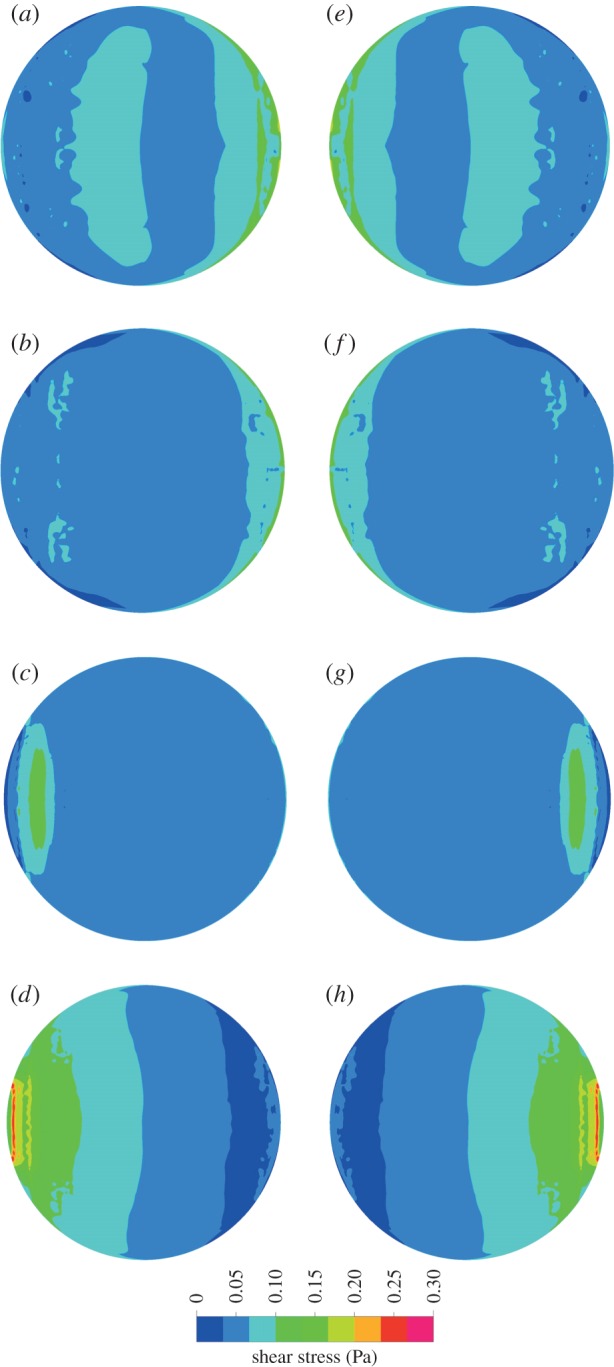
Shear stress maps showing the shear stress at the cell layer every 0.25 s of a 2 s cycle at 30 OPM, starting at 0° (a).
Analysis of CFD shear stresses every 0.25 s of a 2 s cycle confirms that the rocking system generates symmetrical fluid behaviour during each cycle (figure 6). Peaks in velocity magnitude of ±0.08 m s−1 are identifiable at the medium–air interface at the start, middle and end of a cycle, suggesting that the free surface reaches the highest velocity at the sinusoidal peak angular velocity, i.e. when the platform is at 0°. Shear stress profiles are reflected about the x-axis, and shear stress is shown to be at its lowest when the well is at maximum tilt and the angular velocity and fluid velocities are at their lowest (figure 6).
Although shear stress reaches a maximum of 0.22 Pa near the well edge, time-averaged shear stress is relatively stationary at 0.033 Pa over the entire cycle (figure 5). Standard deviation is low near the well edge and consistent with the remainder of the well, emphasizing that the cell monolayer is subject to relatively similar shear stresses for the entire cycle. For over 80% of the well, maximum shear stress does not exceed 0.1 Pa.
Velocity magnitude vectors are driven by the primary motion of the rocker, moving across the axis of rotation in plane with the base of the well (figure 7). Secondary motion is minimal as velocities are at their lowest near the well walls at large angles of tilt causing the walls to have minimal interference in directing flow behaviour.
Figure 7.
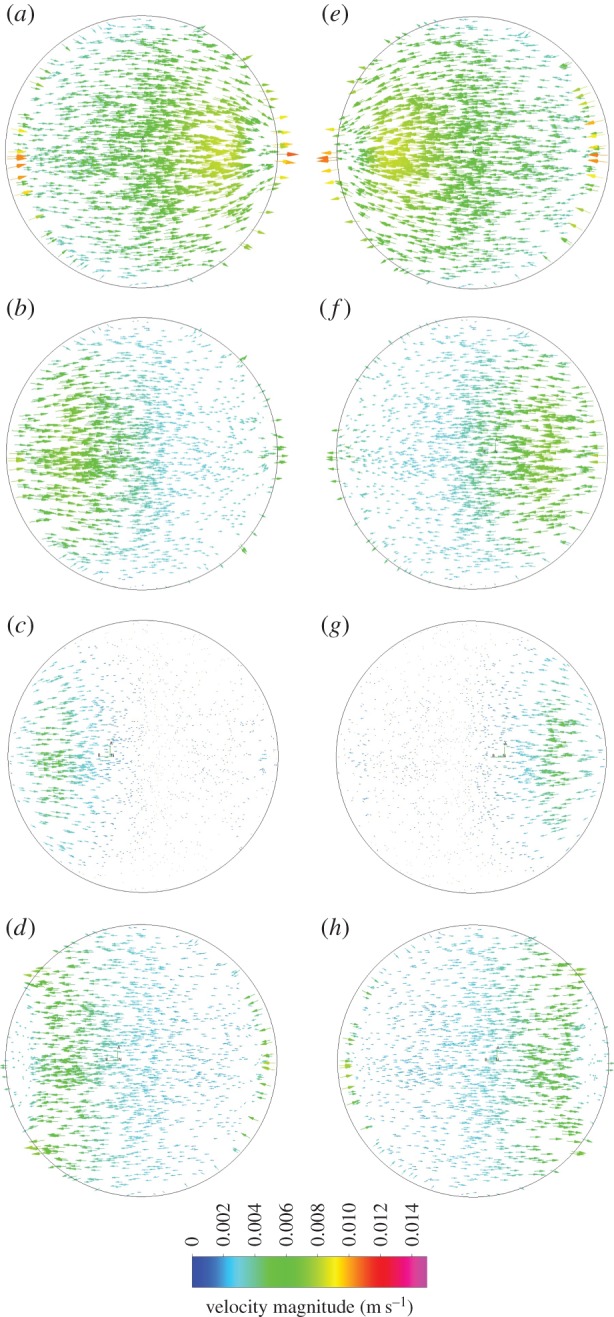
Velocity magnitude vectors showing the magnitude and direction of velocity 0.1 mm above the base of the well every 0.25 s of a 2 s cycle at 30 OPM, starting at 0° (a).
3.4. Cyclic fluid shear stress increases matrix synthesis
SI and continuous stimulation created an increase in production of both collagen and GAG content in comparison with controls (sample replicates, n = 6) (figure 8). All results were significant (p < 0.001) except for GAG synthesis after 7 days of continuous stimulation.
Figure 8.
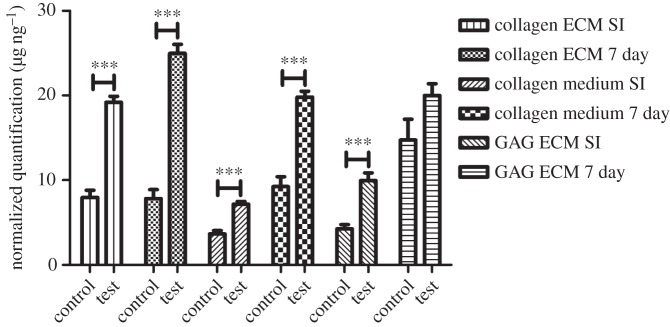
Normalized secretion of collagen and GAG: collagen at the cell layer (ECM) and within the medium increases following both SI and constant stimulation. A similar pattern is identified with GAG secreted at the cell layer. All data have been normalized to dsDNA content. (For further information, see electronic supplementary material, ‘Protein secretion data’.)
After continuous stimulation, an increase in collagen content was found within the culture medium (186%) and at the cell layer (ECM) (324%) in comparison with controls. SI stimulation produced similar results, showing increases in collagen within the medium and at the cell layer; the increase in medium collagen was 107% compared with over 150% at the cell layer. After SI stimulation, GAG secretion was shown to increase by ca 150%.
4. Discussion
We report a novel physical and biological validation for a simple in vitro system for cell culture mechanical stimulation. A computational model provides comprehensive characterization of the fluid shear stress environment experienced by all the cultured cells. The CFD result has been compared with internally consistent PIV characterization of the actual fluid flow and shows good agreement. Initial experiments with the device show significant protein responses due to fluid flow stimulation of cultured tendon cells.
Shear stresses at the well base are not homogeneous across the well and peaks of stress occur at different angles of tilt (figure 6). However, time-averaged shear stress along the majority of the plate centre line is 0.033 Pa, ranging between 0 and 0.22 Pa throughout the cycle. The ranges of shear stress magnitude produced in this system are similar to those predicted to occur in biphasic fibre matrix models of tendons (1.21 Pa) which occur in the small gap between adjacent fibrils [20,21]. The highly loaded and poorly vascularized tendon presents a suitable problem for investigation with cyclic flow. Within tendon tissue, fluid flow impacts on cells because of the circulation of interstitial fluid [22] and hypothesized fibre sliding [23] could cause fluid-like effects on cell mechanotransducers, such as the primary cilium. However, the level of shear stress experienced by tendon cells in vivo is currently unknown. This makes the see-saw rocker as an in vitro tool especially valuable. Heterogeneity across the well base can be used for various cell studies. Cell–cell communications from areas of high shear stress (more than 0.1 Pa) to areas of low shear stress are of great interest, as well as identifying the spread of protein secretion, or difference in cell behaviour such as cytoskeleton structure, or morphology. Computationally derived shear stress maps allow for the development of targeted experiments to establish these differences within the same culture, experiencing the same environmental conditions and ultimately identifying the shear stress instigating the response.
As shown to be required for the fluid flow activation of bone cells, the peak in shear stress at the well edge (figure 6) may be a ‘stress-kick’, starting cell–cell communications and ultimately the protein response [24]. Other in vitro fluid flow devices report shear stress in a similar range to the see-saw rocker. A biaxial cell stretching device has shown fluid shear to be reported in the range of 0.09–5.2 Pa [13]. Additionally, an early investigation of cells in a parallel plate flow chamber reported shear stress in the range of 1–8.5 Pa [25]. This study indicates a range of 0–0.22 Pa at 30 OPM, with the potential for increased shear stress at higher rocking frequencies, or an increased medium viscosity.
A mathematical model of shear stress in a rocking well suggests a higher maximum shear stress than these computational results [11]. Differences are most likely due to model parameters; the mathematical model has an origin of rotation at the well base.
An alternative in vitro stimulation device has been validated for the investigation of endothelial cells, where high OPM and simulation of pulse flow is of particular relevance [26]. This study validates a tool ideal for the study of musculoskeletal cells experiencing cyclic flow in vivo where lower frequencies of cyclic flow are paramount.
Differences between PIV and CFD can be attributed to potential error sources, such as: flow visualization through the free surface during PIV experiments, causing distorted velocity readings; background, cyclic noise not eliminated through POD (for example, periodic glare from the well); and the limitation of experimentally capturing the extremely low flow velocities at the fluid–wall interface as suggested by our CFD modelling. Flow patterns of PIV match that of CFD, suggesting that differences in quantitative analysis are most likely due to the problem of identifying the PIV vectors precisely at the well base (in the boundary layer) and achieving the same resolution as the CFD model.
Cells in the musculoskeletal system are known to be involved in the production and regulation of the ECM. Continuous and interval stimulation showed a significant upregulation in ECM molecule secretion, indicating that shear stress induced by cyclic fluid flow is sensed by human tenocytes. Collagen at the cell layer, and released into the medium, significantly increased after both SI and continuous stimulation. GAG was shown to significantly increase after SI stimulation, but analysis after continuous 7 day stimulation showed a large variance in GAG measurements, indicating that the applied shear stress may only have an impact in the short term on GAG synthesis. Comparison of SI stimulation with continuous stimulation indicates that although an increased period of stimulus results in an increase in ECM secretion, the linear rate of secretion was reduced for the continuous stimulation condition.
Results show that cell number drives the significant differences with dsDNA levels being twice as high in unstimulated controls. As, prior to stimulation, all wells are cultured to confluency, it is concluded that shear stress is inhibiting further cellular proliferation in stimulated wells and that in controls proliferation continues to create a culture in excess of a monolayer. Live/dead staining techniques employed ensured that the difference in dsDNA levels was not due to cell necrosis (data not shown).
There are some limitations to the CFD model that require acknowledgement. This model does not consider the impact of secreted proteins or cell layer height on the shear stresses. However, it is considered that, owing to the free surface and the fact that proteins are small in comparison with the height of rocking fluid, the impact on overall shear generation would be minimal. In addition, modelling is completed for a well that is placed directly above the centre of rotation and further work will involve establishing the effect of well displacement from the central axis on shear stress generation.
In summary, this work validates a widely available, inexpensive, in vitro platform to be used across research institutions for the study of musculoskeletal cells and the generation of comparable research that will form the foundation for a better understanding of fluid effects on cell layers. The defined geometry of a six-well plate and repeatability of conditions allow for experiments to be easily repeated and advanced. Furthermore, the versatility of the platform allows for a wide-ranging change in variables, such as considering a hypoxic state. The platform is ideal for the in vitro investigation of musculoskeletal cells that are exposed to cyclic loading in vivo.
Supplementary Material
Acknowledgements
The authors thank Dr Philippa Hulley for her advice concerning cell culture. The support of the NIHR Musculoskeletal Biomedical Research Unit, Oxford, UK, is also acknowledged. Dr Mustafa Megahed and the ESI Group are gratefully acknowledged for allowing the use of the CFD-ACE multiphysics platform.
Funding statement
The authors thank EPSRC for a doctoral training grant in support of this work. R.J.B. and P.H. were supported by EPSRC grant no. EP/H004025/1. D.C. was supported by the National Natural Science Foundation of China (31200704). In addition, P.H. was supported by the Swedish Research Council (grant no. 2013-4838).
References
- 1.Wang N, Butler JP, Ingber DE. 1993. Mechanotransduction across the cell surface and through the cytoskeleton. Science 260, 1124. [DOI] [PubMed] [Google Scholar]
- 2.Fung Y, Cowin S. 1994. Biomechanics: mechanical properties of living tissues. J. Appl. Mech. 61, 1007 ( 10.1115/1.2901550) [DOI] [Google Scholar]
- 3.Porter B, Zauel R, Stockman H, Guldberg R, Fyhrie D. 2005. 3-D computational modeling of media flow through scaffolds in a perfusion bioreactor. J. Biomech. 38, 543–549. ( 10.1016/j.jbiomech.2004.04.011) [DOI] [PubMed] [Google Scholar]
- 4.Gemmiti CV, Guldberg RE. 2006. Fluid flow increases type II collagen deposition and tensile mechanical properties in bioreactor-grown tissue-engineered cartilage. Tissue Eng. 12, 469–479. ( 10.1089/ten.2006.12.469) [DOI] [PubMed] [Google Scholar]
- 5.Turner C, Forwood M, Otter M. 1994. Mechanotransduction in bone: do bone cells act as sensors of fluid flow? FASEB J. 8, 875. [DOI] [PubMed] [Google Scholar]
- 6.Owan I, Burr DB, Turner CH, Qiu J, Tu Y, Onyia JE, Duncan RL. 1997. Mechanotransduction in bone: osteoblasts are more responsive to fluid forces than mechanical strain. Am. J. Physiol. Cell Physiol. 273, C810-5. [DOI] [PubMed] [Google Scholar]
- 7.White CR, Frangos JA. 2007. The shear stress of it all: the cell membrane and mechanochemical transduction. Phil. Trans. R. Soc. B 362, 1459–1467. ( 10.1098/rstb.2007.2128) [DOI] [PMC free article] [PubMed] [Google Scholar]
- 8.Anderson EJ, Knothe Tate ML. 2007. Open access to novel dual flow chamber technology for in vitro cell mechanotransduction, toxicity and pharamacokinetic studies. Biomed. Eng. Online 6, 46 ( 10.1186/1475-925X-6-46) [DOI] [PMC free article] [PubMed] [Google Scholar]
- 9.Delaine-Smith R, MacNeil S, Reilly G. 2012. Matrix production and collagen structure are enhanced in two types of osteogenic progenitor cells by a simple fluid shear stress stimulus. Eur. Cells Mater. 24, 162–174. [DOI] [PubMed] [Google Scholar]
- 10.Hoey DA, Kelly DJ, Jacobs CR. 2011. A role for the primary cilium in paracrine signaling between mechanically stimulated osteocytes and mesenchymal stem cells. Biochem. Biophys. Res. Commun. 412, 182–187. ( 10.1016/j.bbrc.2011.07.072) [DOI] [PMC free article] [PubMed] [Google Scholar]
- 11.Zhou X, Liu D, You L, Wang L. 2010. Quantifying fluid shear stress in a rocking culture dish. J. Biomech. 43, 1598–1602. ( 10.1016/j.jbiomech.2009.12.028) [DOI] [PMC free article] [PubMed] [Google Scholar]
- 12.Geest JPV, Martino ESD, Vorp DA. 2004. An analysis of the complete strain field within FlexercellTM membranes. J. Biomech. 37, 1923–1928. ( 10.1016/j.jbiomech.2004.02.022) [DOI] [PubMed] [Google Scholar]
- 13.Thompson M, Abercrombie S, Ott C-E, Bieler F, Duda G, Ventikos Y. 2011. Quantification and significance of fluid shear stress field in biaxial cell stretching device. Biomech. Model. Mechanobiol. 10, 559–564. ( 10.1007/s10237-010-0255-1) [DOI] [PubMed] [Google Scholar]
- 14.Hirt CW, Nichols BD. 1981. Volume of fluid (VOF) method for the dynamics of free boundaries. J. Comput. Phys. 39, 201–225. ( 10.1016/0021-9991(81)90145-5) [DOI] [Google Scholar]
- 15.Bacabac RG, Smit TH, Cowin SC, Van Loon JJ, Nieuwstadt FT, Heethaar R, Klein-Nulend J. 2005. Dynamic shear stress in parallel-plate flow chambers. J. Biomech. 38, 159–167. ( 10.1016/j.jbiomech.2004.03.020) [DOI] [PubMed] [Google Scholar]
- 16.Van Doormaal J, Raithby G. 1984. Enhancements of the SIMPLE method for predicting incompressible fluid flows. Numer. Heat Transf. 7, 147–163. [Google Scholar]
- 17.Lonsdale G, Schueller A. 1993. Multigrid efficiency for complex flow simulations on distributed memory machines. Parallel Comput. 19, 23–32. ( 10.1016/0167-8191(93)90103-R) [DOI] [Google Scholar]
- 18.Noh WF, Woodward P. (eds). 1976. SLIC (simple line interface calculation). In Proc. of the 5th Int. Conf. on Numerical Methods in Fluid Dynamics, Enschede, The Netherlands, 28 June–2 July 1976, pp. 330–340. Berlin, Germany: Springer. [Google Scholar]
- 19.Torricelli P, Fini M, Giavaresi G, Carpi A, Nicolini A, Giardino R. 2006. Effects of systemic glucocorticoid administration on tenocytes. Biomed. Pharmacother. 60, 380–385. ( 10.1016/j.biopha.2006.07.003) [DOI] [PubMed] [Google Scholar]
- 20.Butler SL, Kohles SS, Thielke RJ, Chen C, Vanderby R., Jr 1997. Interstitial fluid flow in tendons or ligaments: a porous medium finite element simulation. Med. Biol. Eng. Comput. 35, 742–746. ( 10.1007/BF02510987) [DOI] [PubMed] [Google Scholar]
- 21.Chen CT, Malkus DS, Vanderby R., Jr 1998. A fiber matrix model for interstitial fluid flow and permeability in ligaments and tendons. Biorheology 35, 103–118. ( 10.1016/S0006-355X(99)80001-8) [DOI] [PubMed] [Google Scholar]
- 22.Archambault JM, Elfervig-Wall MK, Tsuzaki M, Herzog W, Banes AJ. 2002. Rabbit tendon cells produce MMP-3 in response to fluid flow without significant calcium transients. J. Biomech. 35, 303–309. ( 10.1016/S0021-9290(01)00217-2) [DOI] [PubMed] [Google Scholar]
- 23.Screen H, Seto J, Krauss S, Boesecke P, Gupta H. 2011. Extrafibrillar diffusion and intrafibrillar swelling at the nanoscale are associated with stress relaxation in the soft collagenous matrix tissue of tendons. Soft Matter 7, 11 243–11 251. ( 10.1039/c1sm05656e) [DOI] [Google Scholar]
- 24.Bacabac RG, Smit TH, Mullender MG, Van Loon JJ, Klein-Nulend J. 2005. Initial stress-kick is required for fluid shear stress-induced rate dependent activation of bone cells. Ann. Biomed. Eng. 33, 104–110. ( 10.1007/s10439-005-8968-5) [DOI] [PubMed] [Google Scholar]
- 25.Levesque M, Nerem R. 1985. The elongation and orientation of cultured endothelial cells in response to shear stress. J. Biomech. Eng. 107, 341–347. ( 10.1115/1.3138567) [DOI] [PubMed] [Google Scholar]
- 26.Salek MM, Sattari P, Martinuzzi RJ. 2012. Analysis of fluid flow and wall shear stress patterns inside partially filled agitated culture well plates. Ann. Biomed. Eng. 40, 707–728. ( 10.1007/s10439-011-0444-9) [DOI] [PubMed] [Google Scholar]
Associated Data
This section collects any data citations, data availability statements, or supplementary materials included in this article.


