Abstract
Shear-induced migration of red blood cells (RBCs) is a well-known phenomenon characterizing blood flow in the small vessels (micrometre to millimetre size) of the cardiovascular system. In large vessels, like the abdominal aorta and the carotid artery (millimetre to centimetre size), the extent of this migration and its interaction with secondary flows has not been fully elucidated. RBC migration exerts its influence primarily on platelet concentration, oxygen transport and oxygen availability at the luminal surface, which could influence vessel wall disease processes in and adjacent to the intima. Phillips' shear-induced particle migration model, coupled to the Quemada viscosity model, was employed to simulate the macroscopic behaviour of RBCs in four patient-specific geometries: a normal abdominal aorta, an abdominal aortic aneurysm (AAA), a normal carotid bifurcation and a stenotic carotid bifurcation. Simulations show a migration of RBCs from the near-wall region with a lowering of wall haematocrit (volume fraction of RBCs) on the posterior side of the normal aorta and on the lateral-external side of the iliac arteries. A marked migration is observed on the outer wall of the carotid sinus, along the common carotid artery and in the carotid stenosis. No significant migration is observed in the AAA. The spatial and temporal patterns of wall haematocrit are correlated with the near-wall shear layer and with the secondary flows induced by the vessel curvature. In particular, secondary flows accentuate the initial lowering in RBC near-wall concentration by convecting RBCs from the inner curvature side to the outer curvature side. The results reinforce data in literature showing a decrease in oxygen partial pressure on the inner curvature wall of the carotid sinus induced by the presence of secondary flows. The lowering of wall haematocrit is postulated to induce a decrease in oxygen availability at the luminal surface through a diminished concentration of oxyhaemoglobin, hence contributing, with the reported lowered oxygen partial pressure, to local hypoxia.
Keywords: secondary flow, shear-induced migration, red blood cells, oxygen transport, haemoglobin, artery
1. Introduction
Blood is a biphasic fluid composed of a fluid phase (plasma) and a solid phase composed of blood cells such as red blood cells (RBCs, 6–8 µm in diameter), white blood cells (WBCs, 7–80 µm in diameter) and platelets (PLTs, 2–3 µm in diameter). Blood shows remarkable non-Newtonian effects primarily caused by RBC–RBC interactions and RBC–protein interactions: the aggregation and disaggregation of RBCs and their deformation dictate the value of viscosity [1,2]. A wide body of experimental evidence shows that flowing suspensions of rigid and deformable particles exhibit particle migration [3–10] with a general trend showing migration from regions of higher shear rate to regions of lower shear rate. RBCs also show this behaviour and their migration to the centre of micro and small vessels (micrometre to millimetre size) and the consequent segregation of PLTs near the wall has been the subject of intense study in the past years, both numerically [11–14] and experimentally [15–17]. Different approaches have been proposed to model RBC migration. For example, in [11] a mesoscopic approach employing the immersed boundary method was used to simulate the motion of RBCs, modelled as deformable capsules, flowing through two-dimensional channels 20–300 µm in height. The results showed migration of RBCs perpendicular to the wall and formation of a cell-free layer. An extension to the three-dimensional case of the same mesoscopic approach is presented in [18]. In [19], the immersed boundary method was also employed to model RBC migration in two-dimensional channels of 6–12 µm in height; cell migration from the vessel wall was also observed. In [20], the dissipative particle dynamics method was applied to blood flow in microtubes ranging from 10 to 40 µm in diameter, and cell migration away from the wall to the tube centre was reported. A different approach is represented by continuum models, which are able to simulate larger domains for longer time scales. An example of this approach can be found in [12], where blood flow in vessels with diameter ranging from 40 to 100 µm was investigated using the shear-induced migration model proposed in [21]. Particle migration away from the wall was also observed in this case. RBC distribution influences blood viscosity, and therefore the velocity profile, and also a series of biological activities such as oxygen distribution in the lumen and the scavenging of nitric oxide (NO) by haemoglobin in the RBCs [22]. Arterial wall hypoxia has been proposed to be a contributing factor to atherosclerosis and intimal hyperplasia [23–25], and altered NO transport in arteries has been postulated to induce atherogenesis [22]. Evaluation of the adimensional wall oxygen consumption rate, the Damköhler (Da) number, and comparison with the adimensional mass transport coefficient, the Sherwood (Sh) number, led to postulate that oxygen supply to the arterial wall is fluid-limited [25], therefore underlining the importance of mass transport from and to the wall. It has been shown [26] that the effect of disregarding the presence of haemoglobin, and therefore its possible lowering in concentration due to RBC migration, is a drastic decrease in oxygen transport to the wall. Therefore, given the importance of RBC concentration in the aforementioned series of biological activities, this study aims at evaluating RBC distribution as a result of the synergy between shear-induced migration and secondary flows in four patient-specific geometries, a normal abdominal aorta, a fusiform abdominal aortic aneurysm (AAA), a normal carotid bifurcation and a stenotic carotid bifurcation, and to discuss possible effects on oxygen transport.
2. Material and methods
2.1. Geometry representation and discretization
Four different patient-specific geometries were investigated: Case (A) a normal abdominal aorta, Case (B) a fusiform AAA, Case (C) a normal carotid bifurcation, Case (D) a stenotic carotid bifurcation. The patient-specific geometries were reconstructed from computer tomography angiography (CT-A) scans acquired at Karolinska University Hospital, Stockholm. Standard CT-A scans, details in table 1, of the abdominal aorta and of the carotid bifurcation were obtained with a 64-slice CT machine (Lightspeed VCT, General Electric). The luminal geometries were reconstructed using active contour (deformable) models with the diagnostic software A4clinics-Research Edition (VASCOPS GmbH, Graz, Austria). For more details, please refer to [27]. The investigated geometries are shown in figure 1, the basic determinants are reported in tables 2 and 3 and the bounding box sizes are reported in table 4.
Table 1.
Pixel spacing and slice thickness used in CT-A scans.
| pixel spacing (mm) | slice thickness (mm) | |
|---|---|---|
| normal aorta | 0.717 × 0.717 | 0.5 |
| AAA | 0.74 × 0.74 | 0.5 |
| normal carotid | 0.504 × 0.504 | 0.7 |
| stenotic carotid | 0.504 × 0.504 | 0.7 |
Figure 1.
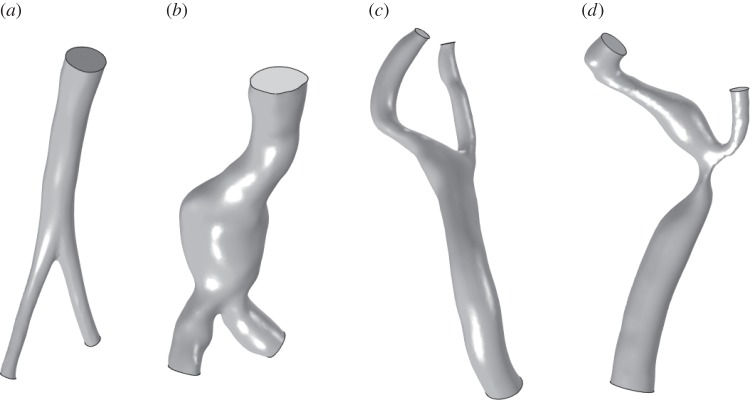
Investigated patient-specific luminal geometries: (a) normal abdominal aorta, (b) fusiform AAA, (c) normal carotid bifurcation and (d) stenotic carotid bifurcation. Images not to scale.
Table 2.
Basic determinants of the investigated normal abdominal aorta and AAA. AInlet and AIliacs denote the cross-sectional areas at the inlet and the outlets, i.e. at the iliac arteries.
| age | gender | AInlet (cm2) | AIliacs (cm2) | |
|---|---|---|---|---|
| normal aorta | 49 | male | 1.606 | 0.306/0.307 |
| AAA | 85 | male | 5.134 | 2.041/1.646 |
Table 3.
Basic determinants of the investigated carotid arteries. ACCinlet, AECoutlet and AICoutlet denote the cross-sectional areas at the inlet, common carotid artery, and at the outlets, external carotid artery and internal carotid artery. CC, common carotid; EC, external carotid; IC, internal carotid.
| age | gender | ACCinlet (cm2) | AECoutlet (cm2) | AICoutlet (cm2) | |
|---|---|---|---|---|---|
| normal carotid | 72 | male | 0.432 | 0.063 | 0.12 |
| stenotic carotid | 70 | female | 0.388 | 0.071 | 0.195 |
Table 4.
Bounding box sizes for the four investigated geometries; x and y are coordinates spanning the transverse plane, whereas the z coordinate is oriented in the streamwise direction.
| x (mm) | y (mm) | z (mm) | |
|---|---|---|---|
| normal aorta | 50 | 25 | 130 |
| AAA | 70 | 50 | 150 |
| normal carotid | 40 | 40 | 70 |
| stenotic carotid | 25 | 25 | 50 |
2.2. Mathematical models and solution procedure
2.2.1. Fluid-dynamical model
Particle migration in inhomogeneous shear flows can be captured by modelling the effects of spatially varying interparticle interaction frequency and spatially varying viscosity. This work is based on Phillips' model [21] for shear-induced migration of rigid particles in concentrated suspensions. Blood is considered to be a concentrated monomodal suspension of solid particles, RBCs, in a Newtonian incompressible fluid, plasma. RBCs are modelled in a Eulerian sense through their volume/mass fraction. RBC density is different from the density of plasma but since in the present cases the gravitational field is neglected, buoyancy is absent.
The equations reported below are equivalent to the extension of Phillips' model [21] to the case of solid and fluid phases with different densities developed in [28]. The commercial software COMSOL Multiphysics, used to solve the set of equations, employs a formulation based on the slip velocity uslip between the fluid and the solid phase [29], while the shear-induced migration model proposed in [21,28] is formulated in terms of particle fluxes. This difference in formulations required some manipulation of the original equations with the slip velocity uslip being formulated as a function of the particle fluxes. Indicating with ϕ and cs, the volume and mass fractions of the solid phase, with ρf and ρs the constant densities of the fluid and solid phase, respectively, with uslip = us − uf the slip velocity between the fluid and the solid phase and with umigr = (1 − cs)uslip the RBC migration velocity, the continuity equation (the full derivation is given in appendix A) reads [28,29]
| 2.1 |
where the mixture velocity (mass-averaged velocity) is given by
| 2.2 |
with the mixture density (kg m−3) defined as
| 2.3 |
The momentum equations take the form [28,29]
 |
where uslip is expressed as a function of the particle flux Js (kg m−2s−1) as
| 2.5 |
with the particle flux defined according to Phillips' model [21]
| 2.6 |
where  denotes the scalar shear rate with D = gradSl being the symmetric part of the velocity gradient tensor l [30], and Kc and Kμ phenomenological constants of order unity. In this work, Kc was set equal to 0.41 and Kμ to 0.62 as used in, for example, [12,21].
Finally, the transport equation for the solid-phase volume fraction reads
| 2.7 |
where the solid-phase velocity is given by
| 2.8 |
A list of all variables and parameters used in the model is reported in table 5.
Table 5.
Variables and parameters used to simulate RBC migration.
| symbol | description | unit | value |
|---|---|---|---|
| u | mass-averaged mixture velocity | m s−1 | — |
| uf | fluid phase (plasma) velocity | m s−1 | — |
| us | solid-phase (RBC) velocity | m s−1 | — |
| ρ | mixture density | kg m−3 | — |
| ρf | fluid phase (plasma) density | kg m−3 | 1025.0 |
| ρs | solid-phase (RBC) density | kg m−3 | 1096.5 |
| μf | pure fluid (plasma) viscosity | Pa·s | 0.0012 |
| p | pressure | Pa | — |
| cs | mass fraction of the solid (RBC) phase | — | — |
| ϕ | volume fraction of the solid (RBC) phase | — | — |
| uslip | relative (slip) velocity between the two phases | m s−1 | — |
| umigr | solid-phase shear-induced migration velocity | m s−1 | — |
| Js | solid-phase (RBC) particle flux | kg m−2s−1 | — |
| Kc | interparticle collision component constant | — | 0.41 |
| Kμ | viscosity component constant | — | 0.62 |
The model also assumes that the Péclet number  , with a being the particle radius,
  the scalar shear rate introduced above and D the Brownian diffusion coefficient, is large due to a very small Brownian diffusion—which is therefore neglected in this model. Both phases share the same pressure field [29].
RBC migration leads to the formation of a plasma skimming layer, a thin layer of around 3 µm adjacent to the wall devoid of RBCs [31]. The continuum approach to model RBC migration can capture the macroscopic haematocrit distribution but not the plasma skimming layer, which is inherently a microscopic phenomenon. For this reason, the wall haematocrit distribution presented in this work must be considered as the haematocrit value at the inner boundary of the plasma skimming layer.
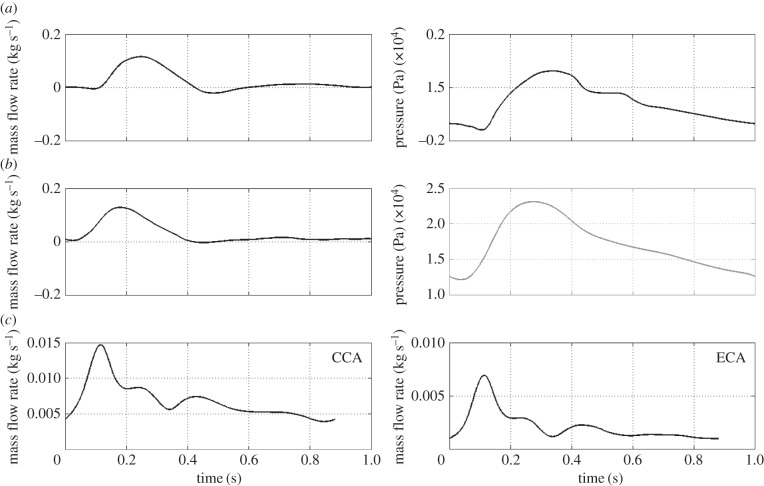
Boundary conditions in the form of an inlet mass flow rate and an outlet pressure waveform, taken from [32] for the normal abdominal aorta and from [33] for the AAA, were applied. For the carotid simulations, flow rates taken from [34] were applied at the common carotid artery (CCA) inlet and at the external carotid artery (ECA) outlet (figure 2). At the internal carotid artery (ICA) outlet, a constant pressure was applied. Additionally, for all cases, a no viscous stress condition, τn = 0, was applied at the pressure outlets. At time t, the prescribed mass flow rate m(t) is related to the inlet/outlet velocity by
| 2.9 |
with S and n defining the inlet/outlet surface area and the outward normal unit vector, respectively. The no-slip boundary condition, uw = 0, was applied at the walls. Regarding the solid phase, at the inlet a fixed volume fraction of ϕ = 0.45, representing a normal haematocrit value, was set for all cases. The use of a pure convective boundary condition at the outlet induced severe oscillations of the volume fraction of the solid phase, forcing to impose a fixed volume fraction value of ϕ = 0.45; for an analysis regarding this assumption refer to the §4. At the wall, a no-flux condition, −n · ϕu = 0, was applied. In the case of rigid wall and incompressible fluid, the imposition of a pressure wave at the outlet is not strictly necessary since given the mass flow rate the pressure differential (Δp) is calculated. This means that a constant pressure can also be applied, as done for the carotid artery case. However, in order to get a meaningful pressure distribution (amplitude and phase), a physiological pressure wave needs to be used. A correct pressure boundary condition is also required in cases like fluid–structure interaction simulations. For a detailed explanation of different boundary conditions, the reader is referred to [35].
Figure 2.
Inlet and outlet boundary conditions over the cardiac cycle. Row (a) normal aorta; row (b) AAA; row (c) normal and stenotic carotid bifurcations.
2.2.2. Constitutive modelling of blood
Blood has complex rheological properties involving shear-thinning, thixotropy and viscoelasticity [36,37]. Even in large arteries, the dependence of viscosity from the shear rate has been shown [38] to produce substantial differences in the flow pattern compared with a Newtonian viscosity model. In the present context, the viscosity is considered a function of shear rate and haematocrit and blood is modelled as a structured fluid [39]. To this end, the Quemada viscosity model [40] was used to represent this dependency. Hence, the viscosity reads
| 2.10 |
where q is an empirical parameter, k0 and k∞ the intrinsic viscosities for  and
and  , respectively, and
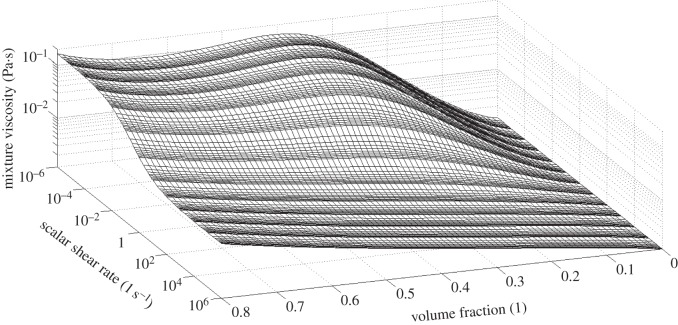
  a critical shear rate related to the critical shear stress under which the structure is broken. The values used in the present work are taken from [14] and summarized in table 6. The viscosity behaviour as a function of shear rate and haematocrit is shown in figure 3.
Table 6.
Quemada model parameters to model blood behaviour. Parameters taken from [14].
| parameter | value/expression |
|---|---|
| q | 0.5 |
| k0 | 55ϕ0.7e−6ϕ+ 1.9 |
| k∞ | 1.65(ϕ + 0.05)−0.3 |
 |
1 |
Figure 3.
Viscosity as a function of the scalar shear rate and solid-phase volume fraction (haematocrit) as predicted by the Quemada viscosity model with parameters taken from [14] and summarized in table 6. For the scalar shear rate and the mixture viscosity, a logarithmic scale has been used.
2.2.3. Finite-element discretization and numerical algorithms
Lagrange P2P1 elements were employed to discretize, with quadratic interpolation, the velocity field and, with linear interpolation, the pressure field. Lagrange linear elements were used for the volume fraction of the solid phase. The Galerkin method was used to discretize the equations with anisotropic diffusion with δani = 0.25 for the momentum transport and δani = 0.5 for the dispersed phase transport [29].
2.2.3.1. Time-advancing algorithm
The generalized-α method [41] with the numerical parameter ρ∞ = 0.75 was used the as time-advancing algorithm. An adaptive time stepping approach was employed [29] to ensure a proper resolution of the transient flow field. The equations were solved using an affine invariant form of the damped Newton method [42] with the use of a segregated approach where the first segregated step solved for the velocity and pressure fields while the second segregated step solved for the solid-phase volume fraction. The PARDISO direct solver was used to solve the arising linear system of equations.
All computations were performed on a 64-bit Dell machine equipped with 4 four cores (16 cores in total) Intel(R) Xeon(R) CPU E7-8837 2.66 GHz with 512 GB of RAM, with Windows Server 2008 R2 Enterprise.
3. Results
3.1. Model validation
To validate the code used in this work, a series of comparisons with previous published results were conducted; a representative one is reported below.
The used benchmark corresponds to the pipe flow studied in [43]: it consists of a pressure-driven axial flow of a monomodal suspension through a 122 cm long pipe with radius 2.54 cm. A uniformly mixed suspension of spherical particles of 3178 µm in diameter with initial volume fraction of 0.50 was set in motion under an inlet mass flow rate of 0.3 kg s−1 with a constant inlet volume fraction of 0.5. Viscosity followed the relation proposed by Krieger [44]
| 3.1 |
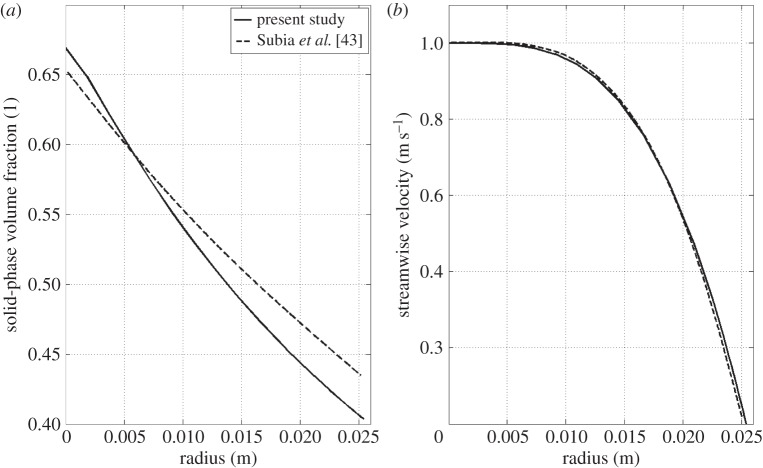
where ϕmax is the maximum packing volume fraction. Table 7 summarizes the parameters and data of the simulation. Only one quarter of the tube was simulated with a quadrilateral mapped mesh with a boundary layer mesh consisting of 10 layers of increasing thickness. The mesh consisted of 21 200 elements, resulting in a total of 582 322 d.f. It is important to underline that for this case the steady-state solution is only a function of the inlet volume fraction, the maximum packing concentration and the ratio Kc/Kμ. Figure 4 shows the volume fraction and the streamwise velocity in the radial direction at the pipe outlet. Good agreement with the results of [43] is achieved, even though the present solution shows a more pronounced migration with lower values of volume fraction at the pipe outer wall and a smaller slope at the centre of the tube. The normalized velocity field also showed slight discrepancies in line with the volume fraction distribution. Several factors might be the cause of this discrepancy; a possible cause can be the difference in the stabilization method employed. This set of equations is known to be prone to instability [45] and it has been found that the consistent stabilization method Galerkin least squares [46] was not able to stabilize the equations, i.e. resulting in pronounced oscillations in the solution. For this reason, anisotropic diffusion was used instead. Anisotropic diffusion is an inconsistent stabilization method, which might lead to a slightly different solution than the one of the original governing equations. For a discussion regarding the presence of the cusp in the solid-phase volume fraction curve at the pipe centre refer to [43].
Table 7.
Summary of the parameters and data used for the comparison with the pipe flow simulation of [43].
| parameter | value |
|---|---|
| pipe length | 122 cm |
| radius | 2.54 cm |
| initial volume fraction | 0.5 |
| inlet volume fraction | 0.5 |
| ρs | 1.182 kg m−3 |
| ρf | 1.182 kg m−3 |
| μf | 4.95 Pa·s |
| ϕmax | 0.68 |
| particle diameter | 3179 µm |
| Kc | 0.43 |
| Kμ | 0.65 |
Figure 4.
Pipe flow test case; (a) solid-phase volume fraction in the radial direction at the pipe outlet and (b) normalized streamwise velocity distribution in the radial direction at the pipe outlet. x = 0 indicates the centre of the pipe.
3.2. Role of secondary flows
Secondary flows play a major role in RBC migration. In order to elucidate their role, before tackling the more complex patient-specific cases, a comparison between the steady and laminar flow in a straight pipe, where no secondary flows are present, and the steady and laminar flow in a curved pipe where well-defined secondary flows, in the form of Dean vortices, are present was conducted. The data relative to the two pipes, representative of a CCA, are reported in table 8. While the Reynolds number used here ensures that the flow is laminar, the value of the Dean number ensures the presence of two stable Dean vortices in the cross-section of the curved pipe.
Table 8.
Geometrical and fluid-dynamical data of the two investigated pipe flows; RoC, radius of curvature; MFR, mass flow rate; Re, Reynolds number; D, Dean number. Re and D numbers are calculated based on inlet quantities.
| diameter (mm) | RoC (m) | inlet MFR (kg s−1) | Re | D | |
|---|---|---|---|---|---|
| straight pipe | 5 | — | 0.0125 | ≈738 | — |
| curved pipe | 5 | 0.5 | 0.0125 | ≈738 | ≈52 |
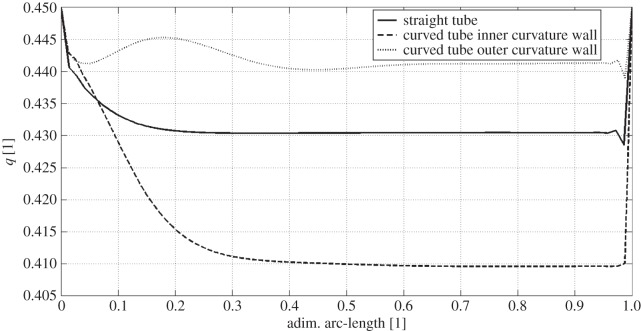
In figure 5, a comparison between the wall haematocrit in the straight pipe and in the curved pipe, inner and outer curvature walls (see figure 6 for nomenclature), is reported. The straight pipe's wall haematocrit values lie in between the ones of the curved pipe, which shows higher values for the outer curvature side and lower values for the inner curvature side. This result shows the effect of secondary flows, which consists of moving the solid phase from the inner curvature side and accumulate it on the outer curvature side. The following mechanism is postulated to take place: at first, the strong shear layer in the near-wall region induces particle migration thus slightly lowering the haematocrit on both sides, then secondary flows kick in and convect particles away from the inner curvature side region further lowering the haematocrit value. This mechanism is responsible for the haematocrit pattern observed in the patient-specific cases (§3.3).
Figure 5.
Wall haematocrit comparison between flow in a straight pipe and in a curved pipe. The dimensionless arc-length is defined as x/X, i.e. the normalized (local) axial position along the vessel wall. Straight line, straight tube; dashed line, curved tube inner curvature wall; dotted line, curved tube outer curvature wall.
Figure 6.

(a) Dean vortices in a section perpendicular to the centreline of the curved tube. Solid-phase velocity vectors superimposed to the haematocrit (solid-phase volume fraction) contours. (b) Curved tube section with inner and outer curvature sides indicated.
In figure 6, the solid-phase velocity vectors are plotted on top of the solid-phase volume fraction showing the Dean vortices in the cross-section of the curved pipe. The wall haematocrit is lower on the inner curvature side owing to the convective motion of the solid phase induced by the Dean vortices.
3.3. Patient-specific arteries
3.3.1. Normal aorta
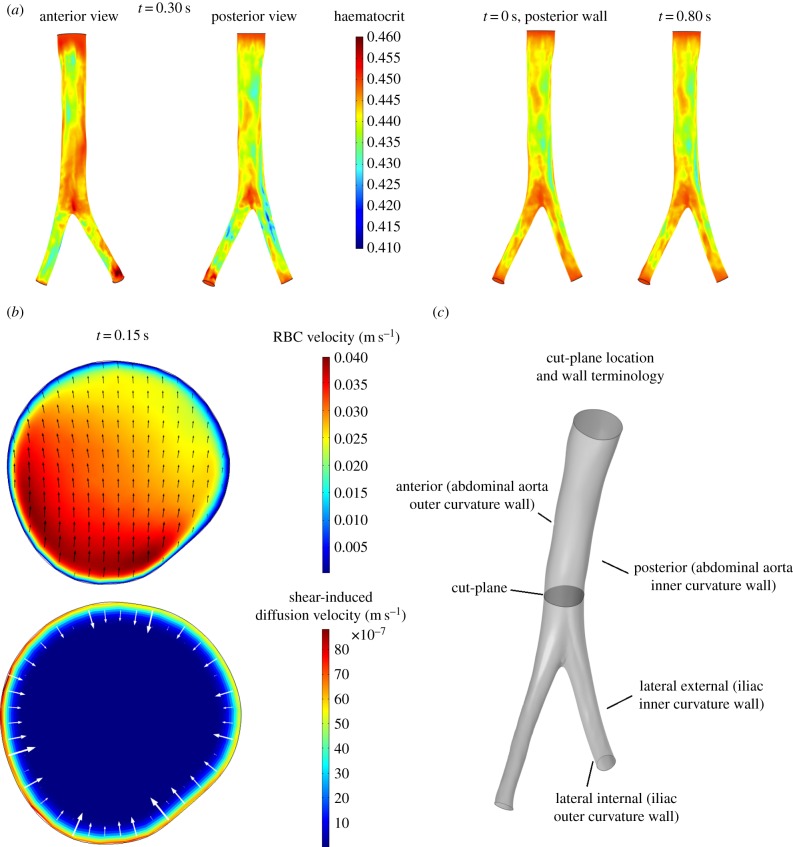
The normal aorta studied in this work presents a prominent anterior–posterior curvature which leads the posterior wall, the inner curvature wall, to experience a slightly larger migration compared with the anterior wall. The minimum wall haematocrit, of around 0.42–0.43, was observed around t = 0.2 s (peak systole). A slightly larger migration is observed in the iliac arteries, particularly in the right iliac, where a minimum haematocrit of approximately 0.41 is observed at t = 0.30 s (figure 7a). The lateral-external wall, the inner curvature wall, of both iliac arteries consistently shows a lower haematocrit than the lateral-internal wall, the outer curvature wall (figure 7a). Notably, the low haematocrit spots on the inner curvature wall of the iliac arteries are one of the locations where atherosclerotic lesions are usually observed [47]. RBC migration is caused by two phenomena: the shear layer formed in the near-wall region inducing initial RBCs migration from the wall to the core flow and the secondary flows directed away from the inner curvature wall enhancing RBC transport from the inner curvature wall to the outer one (figure 7b). The time scale of RBC migration is longer compared with the fluid-dynamical scales; this can be observed in figure 7a where, despite ample variations in the flow field, the wall haematocrit distribution is fairly constant throughout the cardiac cycle.
Figure 7.
Wall haematocrit and RBC velocity field in the normal aorta. (a) Wall haematocrit in the patient-specific normal aorta during the cardiac cycle, posterior wall view. Inset: anterior and posterior wall views at t = 0.30 s. The posterior side (inner curvature wall) of the abdominal aorta experiences a higher migration compared with the anterior side (outer curvature wall). The maximum RBC migration is observed on the lateral-external wall (inner curvature wall) of the right iliac artery. The lateral-external wall of the iliac arteries consistently shows a lower haematocrit value compared with the lateral-internal wall. (b) Cross-sectional view of the normal aorta lumen on a plane perpendicular to the streamwise direction located 2.5 cm above the aortic bifurcation, indicated in (c). Top: RBCs' velocity field us (convection plus shear-induced diffusion); Bottom: RBC shear-induced diffusion velocity (1 − cs)uslip. The RBC velocity field (top) shows the effects of the secondary flows directed away from the inner curvature wall (i.e. from bottom to top) which helps in further reducing the haematocrit at this site.
3.3.2. Fusiform aneurysm
In the fusiform AAA, no important RBC migration is observed. The proximal portion of the aorta on the inner curvature wall (figure 8) presents wall haematocrit values of around 0.43. The aneurismatic bulge, instead, presents wall haematocrit values of around 0.45, the prescribed value, throughout the cardiac cycle indicating that the shear rate values reached in the boundary layer are not sufficient to induce RBC migration (figure 8). It is important to underline here that even with the presence of strong secondary flows, the presence of shear-induced migration is indispensable to create a lower haematocrit region near the wall which can then be convected. In this case, despite the presence of secondary flows, no sufficient near-wall shear-induced migration, except for the proximal region and a few spots in the iliac arteries, is observed and therefore the secondary flows have no effects on the haematocrit value. Two spots of decreased haematocrit are observed on the lateral-external wall of both iliac arteries throughout the cardiac cycle (figure 8), consistent with what observed in the normal aorta case.
Figure 8.
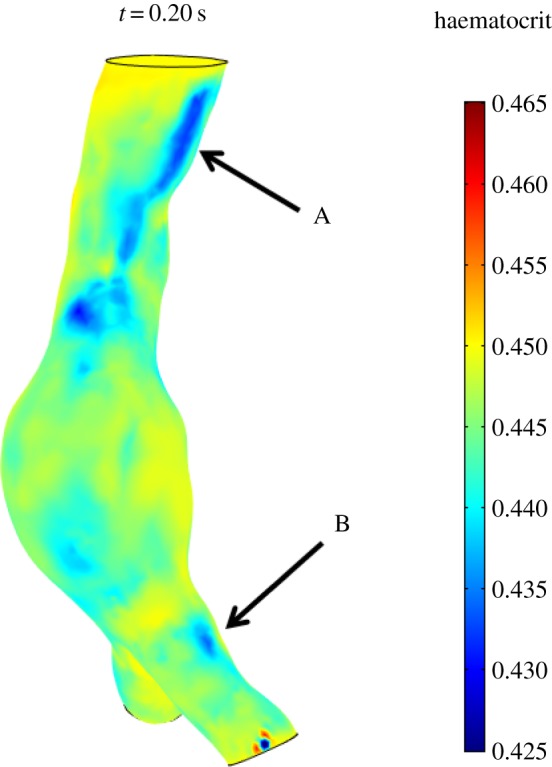
Wall haematocrit in the fusiform aneurysm at t = 0.20 s. The aneurysmatic bulge presents an almost uniform haematocrit of around 0.45 while the proximal region of the aorta, on the inner curvature wall (arrow A), presents haematocrit values of around 0.43. Spots of decreased haematocrit are observed on the lateral-external wall of both iliac arteries throughout the cardiac cycle (arrow B).
3.3.3. Normal carotid bifurcation
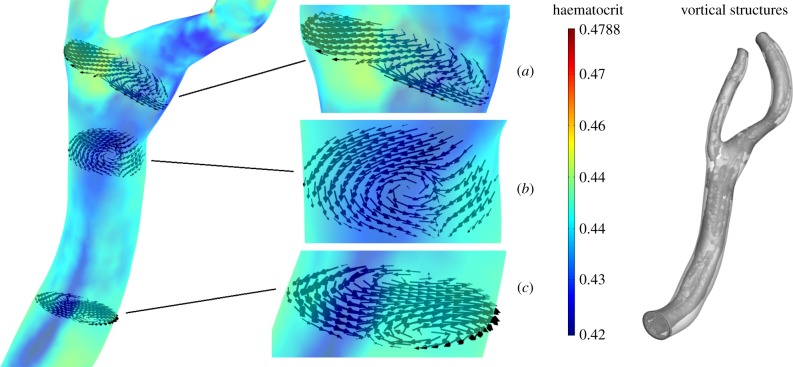
In the normal carotid bifurcation, a clear RBC migration is seen at the outer wall, the inner curvature wall, of the ICA sinus and on the inner curvature wall of the CCA (figure 9). Wall haematocrit values at these locations show approximately a 10% decrease with respect to the normal value of 0.45. Secondary flows convect RBCs away from the CCA inner curvature wall and shift the low wall haematocrit region from the centre of the CCA towards the ICA sinus. This is illustrated in figure 10, where the RBC in-plane velocity vectors at t = 0.30 s are shown together with the wall haematocrit at t = 0.40 s. A time-shift of 0.10 s was adopted since the haematocrit distribution evolves from the RBC velocity field history. In the proximal CCA region (figure 10c), the secondary flows induce a velocity field that moves RBCs from the inner curvature wall towards the outer curvature wall; in the middle CCA (figure 10b) and in the carotid sinus (figure 10a) the secondary flows induce a velocity field that moves RBCs towards the ICA sinus. The origin of this complex flow behaviour is the presence of streamwise vortices running through the whole carotid length (figure 10). Similar vortical structures (VSs) are present in the other analysed cases (not shown). It is worth noting that the pattern of low wall haematocrit correlates with sites where atherosclerotic plaque formation is reported [49,50].
Figure 9.
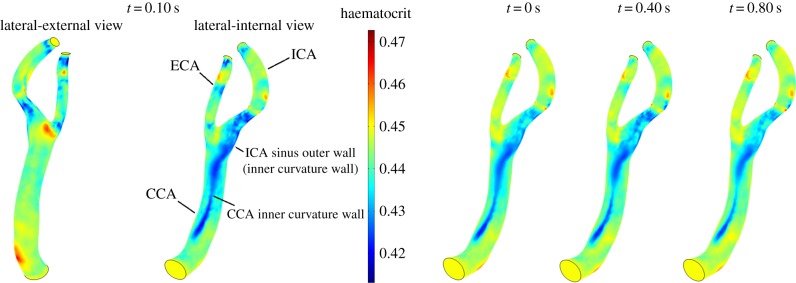
Wall haematocrit in the patient-specific normal carotid bifurcation during the cardiac cycle, lateral-internal wall view. Inset: lateral-external and lateral-internal wall views at t = 0.10 s. RBC migration is clearly observed at the outer wall, the inner curvature wall, of the ICA sinus and on the inner curvature wall of the CCA.
Figure 10.
In-plane RBC velocity vectors at t = 0.30 s, wall contours of wall haematocrit at t = 0.40 s and vortical structures educed with the λ2-method [48] with λ2th = −120 s−2 at t = 0.30 s. (a) Carotid sinus, (b) medial CCA and (c) proximal CCA.
3.3.4. Stenotic carotid bifurcation
The stenotic carotid bifurcation presents low haematocrit values in the stenotic throat caused by the high values of  that lead to a pronounced RBC migration (figure 11). The wall haematocrit in the throat region reached values of approximately 0.35, a decrease of around 22% with respect to the normal value. In the carotid sinus, a streak of low haematocrit values on the outer wall, the inner curvature wall, caused by the secondary flows, is observed throughout the cardiac cycle (figure 11). The inhomogeneities in wall haematocrit observed in the ICA and ECA are likely the result of the turbulent nature of the flow in those particular regions (see the Discussion section). The spot of low haematocrit present on the ICA sinus inner wall (figure 11) only at t = 0.1 s is caused by the strong impinging systolic jet originating in the throat.
Figure 12.
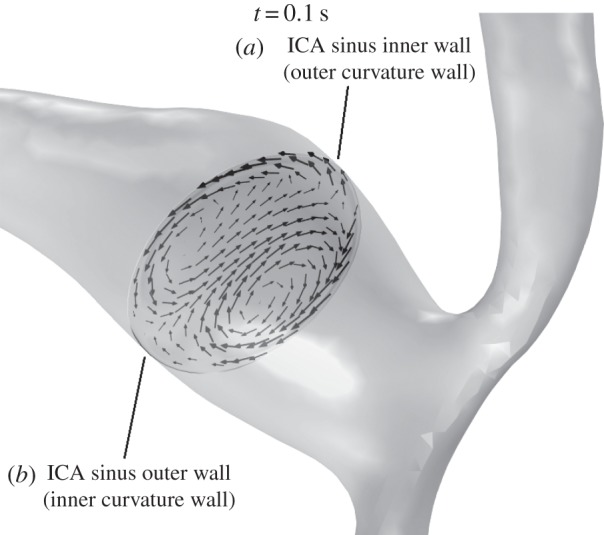
In-plane RBC velocity vectors on a plane normal to the centreline in the carotid sinus of the stenotic carotid bifurcation at t = 0.10 s. Secondary flows in the form of Dean vortices are observed and are present throughout the cardiac cycle (not shown). This secondary flow pattern plays a key role in lowering the haematocrit on the outer wall of the ICA sinus (see main text).
Figure 11.

Wall haematocrit in the patient-specific stenotic carotid bifurcation during the cardiac cycle, lateral-internal wall view. Inset: lateral-internal and lateral-external wall views at t = 0.10 s.
4. Discussion
Oxygen availability to the underlying vessel wall is linked to wall haematocrit values [26]; considerations on the Sh and Da numbers led to postulate that oxygen supply to the arterial wall is fluid-limited [25], hence the need to evaluate RBC migration in large vessels. Consequently, this work investigated the shear-induced migration of RBCs and its relation with secondary flows in the abdominal aorta and in the carotid artery using Phillips' model [21]. The present results show the importance of secondary flows in the RBC migration process in the macrovasculature. In regions of marked curvature like the CCA, the ICA sinus, the iliac arteries and for this particular case also the abdominal aorta, secondary flows convect RBCs from the inner curvature wall to the outer curvature wall. Shear-induced migration induces the initial lowering in wall haematocrit values while secondary flows enhance or dampen the migration (figure 13). In the stenosis, instead, the drastic reduction in haematocrit is due to the strong shear layer formed in the throat. A correlation emerged between regions of RBC migration and regions prone to atherosclerosis, namely the external wall of the iliac arteries, the external wall of the ICA sinus and the carotid stenosis, being that strong abdominal aortic curvature is not a common occurrence. The present results show that shear-induced migration, and by direct consequence the overall transport, of RBCs loses strength during the enlargement process of the abdominal aorta that leads to the formation of AAAs (compare the normal aorta case with the AAA case), while during the progression of atherosclerosis, and therefore stenosis, RBC migration increases its magnitude, possibly inducing or strengthening hypoxic conditions in the stenotic area, which in turn might lead to further atherosclerosis progression. The decreased wall haematocrit leads to a reduced oxyhaemoglobin availability in the near-wall region which can result, following [26], in a reduced Sh number thus reinforcing hypoxic conditions. The present results are in line with what was observed in [51], where oxygen mass transport in a carotid bifurcation was simulated considering only free oxygen dissolved in plasma. A lowered Sh number on the outer wall of the carotid sinus, the site where atherosclerotic plaques are usually observed, was reported. This decrease in Sh number was attributed to the secondary flows established in the carotid sinus region, which were directed from the outer wall (inner curvature wall) to the inner wall (outer curvature wall) of the carotid sinus, convecting oxygen away from the former to the latter. Also in [52], a decrease in Sh number along the outer wall of the carotid sinus due to recirculating separated flow was observed. This led the authors to postulate that mass transfer of various molecules (e.g. oxygen, NO, mitogens) can be impaired at the outer wall of the carotid sinus, and therefore relating to regions of intimal thickening and atherosclerosis. The same curvature effect was also reported in [53] for a coronary artery model.
Figure 13.
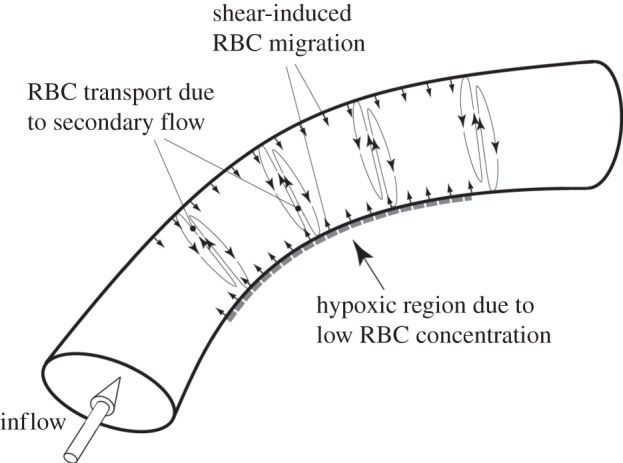
Schematic of the proposed mechanism of RBCs migration and wall hypoxia. Shear-induced migration of RBCs takes places along the vessel wall inducing the initial RBC migration from the near-wall region. Secondary flows, induced by the vessel curvature, enhance RBC migration convecting them from the inner curvature side to the outer curvature one. This migration leads to a lowered haematocrit region on the inner curvature wall, which might results in localized hypoxia.
Decades of intense research on the role of wall shear stress (WSS) in atherosclerosis were able to unravel its effects on the endothelial cell layer (e.g. [54]). Despite the clear role played by WSS in atherosclerosis, no conclusive evidence of a direct link between low and oscillatory WSS and this pathology [55] has surfaced. WSS, on the other hand, is a manifestation of a more global phenomenon, the flow field as a whole. Focusing on wall-metrics such as WSS, oscillatory shear index (OSI) and relative residence time (RRT) led to the conclusion that curvature-induced secondary flows have a beneficial flow stabilizing effect [56]. On the other hand, this work shows the negative aspects of these secondary flows, which cannot be captured by wall-metrics alone. In this view, coupling wall-metrics (WSS, OSI and RRT) with global flow field structures (secondary flows) in the analysis process might prove beneficial. A possible way to do so is to improve the haemodynamically inspired geometric variables approach [57], by taking into consideration global flow structures in the definition of the geometric variables. Future studies should therefore analyse the co-localization of regions of low/high WSS and low/high mass transport of oxygen and other important atherogenic molecules such as LDL.
Infrarenal aorta and CCA flow rates, ICA/ECA and iliac flow partitions are patient-specific. On the other hand, proximal CCA and bifurcation geometry are the primary responsible for flow characteristics [58,59], meaning that the carotid flow features investigated in this work are strongly geometry dependent. The same assumption is likely to hold valid also for aortic flows. For this reason, the same secondary flows characteristics are most likely to be observed also under different boundary conditions. The open points and limitations of this study that should be addressed in future research are presented below.
4.1. Shear-induced migration model
— Phillips' model was developed for rigid particles while RBCs are deformable; the effect of deformability and loss of symmetry of RBCs might affect RBC migration.
— The best values for Kc and Kμ could not be assessed due to a lack of experimental data; values from literature were used instead.
— Phillips' model was developed for one-dimensional flows, its extension to three-dimensional flows employs the scalar shear rate
 . The validity of this approach cannot be fully quantified owing to the lack of experimental data.
4.2. Uncertainty on the inlet ϕ value
The inlet distribution of ϕ has been considered uniform and equal to 0.45; in reality, a non-uniform distribution is expected, with lower values of ϕ at the wall. Approximation of the ϕ distribution as a constant introduces a development length (conceptually similar to the length needed to develop a parabolic flow profile) that might affect the downstream wall haematocrit distribution and possibly leading to higher values of ϕ than would occur in reality.
4.3. Numerical challenges
Phillips' model showed a tendency to develop oscillations in the values of the solid-phase volume fraction, an issue already reported in literature (e.g. [60]). Anisotropic diffusion, an inconsistent stabilization method, was able to partially solve this issue: in the outlet region and in localized regions of the analysed geometries, the presence of uncontrolled oscillations was still observed. At the outlets of the domains, a fixed volume fraction has been imposed due to uncontrolled oscillations in its value if a pure convective boundary condition was employed. This assumption, while imposing a constraint on the volume fraction field, is not considered restricting based on the fact that the bulk flow presents a constant haematocrit value of ϕ = 0.45 while the differences in haematocrit are confined into a small boundary layer leading to an average value, over the outlet section, of ϕ close to 0.45. Moreover, as can be observed in figure 5, the effects of this boundary condition are segregated in a very narrow region close to the outlet, therefore not affecting the domain of interest. Lastly, the use of an inconsistent stabilization method is one possible cause of the discrepancy observed in the model validation example.
4.4. Turbulence
All simulations assumed laminar flow. While this assumption is justified in the larger vessels, such as the normal abdominal aorta and the AAA, where the Re is low [38], in the normal carotid artery and, in particular, in the stenotic carotid artery turbulent flow can occur [61,62], as observed in the wall haematocrit pattern for the stenotic carotid artery case (figure 11). Therefore, in future work, a proper treatment of the turbulent flow should be applied for these cases to evaluate the effect of turbulence on RBCs transport.
4.5. Oxygen transport
This work assesses low wall oxygen availability by locating regions of low wall haematocrit. Despite being shown to be a valid approach [26], a complete assessment of wall oxygen flux/consumption would require to also consider oxygen transport.
5. Summary
In conclusion, the work presented here analyses the combined effect of near-wall, shear-induced migration and secondary flows on the distribution of wall haematocrit. Shear-induced migration was modelled using a phenomenological model taking into account gradients in scalar shear rate, haematocrit and viscosity. The synergistic effect of these two flow phenomena leads to lowered haematocrit values in regions shown to be prone to atherosclerosis. These lowered wall haematocrit values were shown [26] to induce a lowered oxygen wall flux, which in turn might induce wall hypoxia.
Acknowledgements
The authors would like to thank Dr Anders Ekerot from COMSOL AB for his invaluable technical support and Andrii Grytsan for providing a routine to import COMSOL data into Tecplot.
Appendix A
The continuity equation (2.1) can be derived as follow. First, equation (2.8) is derived starting from equation (2.2) and recalling the definition of the slip velocity uslip = us − uf so to obtain
| A1 |
This equation gives
| A2 |
Recalling the definition of the mixture density, equation (2.3), and substituting
| A3 |
which gives equation (2.8)
| A4 |
Starting now from the general continuity equation for a mixture [63]
| A5 |
and manipulating the first l.h.s. term, one obtains
| A6 |
In order to eliminate the time derivative, a particle conservation equation formulated using the mixture velocity can be employed. This equation takes the form
| A7 |
which when substituted in equation (A 6) gives
| A8 |
The particle flux Js is the particle flux induced by the shear-induced migration, hence in its formulation umigr should be employed. The flux takes then the form
| A9 |
Substituting back one obtains
| A10 |
The second l.h.s. term in equation (A 5) can be written as
 |
A11 |
Putting the two terms together, one finally gets the continuity equation (2.1)
| A12 |
The same approach can be used to recover the momentum equations (2.4).
Funding statement
This work has been financially supported by the Project grant no. 2010-4446 from the Swedish Research Council.
References
- 1.Chien S, Usami S, Taylor HM, Lundberg JL, Gregersen MI. 1966. Effects of hematocrit and plasma proteins on human blood rheology at low shear rates. J. Appl. Physiol. 21, 81–87. [DOI] [PubMed] [Google Scholar]
- 2.Chien S. 1970. Shear dependence of effective cell volume as a determinant of blood viscosity. Science 169, 977–979. ( 10.1126/science.168.3934.977) [DOI] [PubMed] [Google Scholar]
- 3.Abbott JR, Tetlow N, Graham AL, Altobelli SA, Fukushima E, Mondy LA, Stephens TA. 1991. Experimental observations of particle migration in concentrated suspensions: Couette flow. J. Rheol. 35, 773–794. ( 10.1122/1.550157) [DOI] [Google Scholar]
- 4.Arp PA, Mason SG. 1977. The kinetics of flowing dispersion IX. Doublets of rigid spheres (experimental). J. Colloid Interface Sci. 61, 44–61. ( 10.1016/0021-9797(77)90414-3) [DOI] [Google Scholar]
- 5.Chow AW, Sinton SW, Iwamiya JH. 1994. Shear-induced particle migration in Couette and parallel-plate viscometers: NMR imaging and stress measurements. Phys. Fluids 6, 2561–2576. ( 10.1063/1.868147) [DOI] [Google Scholar]
- 6.Gadala-Maria F, Acrivos A. 1980. Shear-induced structure in a concentrated suspension of solid spheres. J. Rheol. 24, 799–811. ( 10.1122/1.549584) [DOI] [Google Scholar]
- 7.Hookham PA. 1986. Concentration and velocity measurements in suspensions flowing through a rectangular channel. PhD thesis, California Institute of Technology, Pasadena, CA, USA. [Google Scholar]
- 8.Karnis A, Goldsmith HL, Mason SG. 1966. The kinetics of flowing dispersions I. Concentrated suspensions of rigid particles. J. Colloid Interface Sci. 22, 531–553. ( 10.1016/0021-9797(66)90048-8) [DOI] [Google Scholar]
- 9.Koh CJ, Hookham P, Leal LG. 1993. An experimental investigation of concentrated suspension flows in a rectangular channel. J. Fluid Mech. 266, 1–32. ( 10.1017/S0022112094000911) [DOI] [Google Scholar]
- 10.Leighton D, Acrivos A. 1987. Measurement of shear-induced self-diffusion in concentrated suspensions of spheres. J. Fluid Mech. 177, 109–131. ( 10.1017/S0022112087000880) [DOI] [Google Scholar]
- 11.Bagchi P. 2007. Mesoscale simulation of blood flow in small vessels. Biophys. J. 92, 1858–1877. ( 10.1529/biophysj.106.095042) [DOI] [PMC free article] [PubMed] [Google Scholar]
- 12.Mansour MH, Bressloff NW, Shearman CP. 2010. Red blood cell migration in microvessels. Biorheology 47, 73–93. [DOI] [PubMed] [Google Scholar]
- 13.Sharan M, Popel AS. 2001. A two-phase model for flow of blood in narrow tubes with increased effective viscosity near the wall. Biorheology 38, 415–428. [PubMed] [Google Scholar]
- 14.van Weert K. Numerical and experimental analysis of shear-induced migration in suspension flow. Report no. WFW 96.062, Eindhoven University of Technology (EUT), Eindhoven, The Netherlands. [Google Scholar]
- 15.Aarts PAMM, van den Broek ST, Prins GW, Kuiken GDC, Sixma JJ, Heethaar RM. 1988. Blood platelets are concentrated near the wall and red blood cells, in the center in flowing blood. Arterioscler. Thromb. Vasc. Biol. 8, 819–824. ( 10.1161/01.ATV.8.6.819) [DOI] [PubMed] [Google Scholar]
- 16.Cokelet GR. 1999. Viscometric, in vitro and in vivo blood viscosity relationships: how are they related? Biorheology 36, 343–358. [PubMed] [Google Scholar]
- 17.Pries AR, Neuhaus D, Gaehtgens P. 1992. Blood viscosity in tube flow: dependence on diameter. Am. J. Physiol. 263, H1770–H1778. [DOI] [PubMed] [Google Scholar]
- 18.Doddi SK, Bagchi P. 2009. Three-dimensional computational modeling of multiple deformable cells flowing in microvessels. Phys. Rev. E Stat. Nonlin. Soft Matter Phys. 79, 046318 ( 10.1103/PhysRevE.79.046318) [DOI] [PubMed] [Google Scholar]
- 19.Zhang J, Johnson PC, Popel AS. 2007. An immersed boundary lattice Boltzmann approach to simulate deformable liquid capsules and its application to microscopic blood flows. Phys. Biol. 4, 285–295. ( 10.1088/1478-3975/4/4/005) [DOI] [PubMed] [Google Scholar]
- 20.Fedosov DA, Caswell B, Popel AS, Em Karniadakis G. 2010. Blood flow and cell-free layer in microvessels. Microcirculation 17, 615–628. ( 10.1111/j.1549-8719.2010.00056.x) [DOI] [PMC free article] [PubMed] [Google Scholar]
- 21.Phillips RJ, Armstrong RC, Brown RA, Graham AL, Abbott JR. 1991. A constitutive equation for concentrated suspensions that accounts for shear-induced particle migration. Phys. Fluids A 4, 30–40. ( 10.1063/1.858498) [DOI] [Google Scholar]
- 22.Liu X, Fan Y, Xu XY, Deng X. 2012. Nitric oxide transport in an axisymmetric stenosis. J. R. Soc. Interface 9, 2468–2478. ( 10.1098/rsif.2012.0224) [DOI] [PMC free article] [PubMed] [Google Scholar]
- 23.Crawford DW, Back LH, Cole MA. 1980. In vivo oxygen transport in the normal rabbit femoral arterial wall. J. Clin. Invest. 65, 1498–1508. ( 10.1172/JCI109815) [DOI] [PMC free article] [PubMed] [Google Scholar]
- 24.Crawford DW, Blankenhorn DH. 1991. Arterial wall oxygenation, oxyradicals, and atherosclerosis. Atherosclerosis 89, 97–108. ( 10.1016/0021-9150(91)90049-9) [DOI] [PubMed] [Google Scholar]
- 25.Tarbell JM. 2003. Mass transport in arteries and the localization of atherosclerosis. Annu. Rev. Biomed. Eng. 5, 79–118. ( 10.1146/annurev.bioeng.5.040202.121529) [DOI] [PubMed] [Google Scholar]
- 26.Moore JA, Ethier CR. 1997. Oxygen mass transfer calculations in large arteries. J. Biomech. Eng. 119, 469–475. ( 10.1115/1.2798295) [DOI] [PubMed] [Google Scholar]
- 27.Auer M, Gasser TC. 2010. Reconstruction and finite element mesh generation of abdominal aortic aneurysms from computerized tomography angiography data with minimal user interaction. IEEE Trans. Med. Imaging 29, 1022–1028. ( 10.1109/TMI.2009.2039579) [DOI] [PubMed] [Google Scholar]
- 28.Rao R, Mondy L, Sun A, Altobelli S. 2001. A numerical and experimental study of batch sedimentation and viscous resuspension. Int. J. Numer. Methods Fluids 39, 465–483. ( 10.1002/fld.246) [DOI] [Google Scholar]
- 29.COMSOL v4.3a. 2012 COMSOL user manual, COMSOL AB. See http://www.comsol.com.
- 30.Malvern LE. 1969. Introduction to the mechanics of a continuous medium. Englewood Cliffs, NJ: Prentice Hall. [Google Scholar]
- 31.Ethier CR, Simmons CA. 2007. Introductory biomechanics: from cells to organisms. Cambridge, UK: Cambridge University Press. [Google Scholar]
- 32.Mills C, Gabe I, Gault J, Mason D, Ross J, Braunwald E, Shillingford JP. 1970. Pressure–flow relationships and vascular impedance in man. Cardiovasc. Res. 4, 405–417. ( 10.1093/cvr/4.4.405) [DOI] [PubMed] [Google Scholar]
- 33.Les AS, Shadden SC, Figueroa CA, Park JM, Tedesco MM, Herfkens RJ, Dalman RL, Taylor CA. 2010. Quantification of hemodynamics in abdominal aortic aneurysms during rest and exercise using magnetic resonance imaging and computational fluid dynamics. Ann. Biomed. Eng. 38, 1288–1313. ( 10.1007/s10439-010-9949-x) [DOI] [PMC free article] [PubMed] [Google Scholar]
- 34.Lee S-W, Antiga L, Spence JD, Steinman DA. 2008. Geometry of the carotid bifurcation predicts its exposure to disturbed flow. Stroke 39, 2341–2347. ( 10.1161/STROKEAHA.107.510644) [DOI] [PubMed] [Google Scholar]
- 35.Vignon-Clementel IE, Figueroa CA, Jansen KE, Taylor CA. 2006. Outflow boundary conditions for three-dimensional finite element modeling of blood flow and pressure in arteries. Comput. Methods. Appl. Mech. Eng. 195, 3776–3796. ( 10.1016/j.cma.2005.04.014) [DOI] [Google Scholar]
- 36.McDonald DA. 2004. Blood flow in arteries, 5th edn London, UK: Edward Arnold. [Google Scholar]
- 37.Oka S. 1981. Cardiovascular hemorheology. Cambridge, UK: Cambridge University Press. [Google Scholar]
- 38.Biasetti J, Hussain F, Gasser TC. 2011. Blood flow and coherent vortices in the normal and aneurysmatic aortas: a fluid dynamical approach to intra-luminal thrombus formation. J. R. Soc. Interface 8, 1449–1461. ( 10.1098/rsif.2011.0041) [DOI] [PMC free article] [PubMed] [Google Scholar]
- 39.Quemada D. 1981. A rheological model for studying the hematocrit dependence of red cell-red cell and red cell–protein interactions in blood. Biorheology 18, 501–516. [DOI] [PubMed] [Google Scholar]
- 40.Quemada D. 1978. Rheology of concentrated disperse systems II: a model for non-Newtonian shear viscosity in steady flows. Rheol. Acta 17, 632–642. ( 10.1007/BF01522036) [DOI] [Google Scholar]
- 41.Jansen KE, Whiting CH, Hulbert GM. 2000. A generalized-α method for integrating the filtered Navier-Stokes equations with a stabilized finite element method. Comput. Methods Appl. Mech. Eng. 190, 305–319. ( 10.1016/S0045-7825(00)00203-6) [DOI] [Google Scholar]
- 42.Deuflhard P. 1974. A modified Newton method for the solution of ill-conditioned systems of nonlinear equations with application to multiple shooting. Numer. Math. 22, 289–315. ( 10.1007/BF01406969) [DOI] [Google Scholar]
- 43.Subia SR, Ingber MS, Mondy LA, Altobelli SA, Graham AL. 1998. Modelling of concentrated suspensions using a continuum constitutive equation. J. Fluid Mech. 373, 193–219. ( 10.1017/S0022112098002651) [DOI] [Google Scholar]
- 44.Krieger IM. 1972. Rheology of monodisperse latices. Adv. Colloid Interface Sci. 3, 111–136. ( 10.1016/0001-8686(72)80001-0) [DOI] [Google Scholar]
- 45.Fang Z, Phan-Thien N. 1995. Numerical simulation of particle migration in concentrated suspensions by a finite volume method. J. Non-Newton. Fluid Mech. 58, 67–81. ( 10.1016/0377-0257(94)01355-L) [DOI] [Google Scholar]
- 46.Hughes TJR, Franca LP, Hulbert GM. 1989. A new finite element formulation for computational fluid dynamics: VIII. The Galerkin least squares method for advective–diffusive equations. Comp. Methods Appl. Mech. Eng. 73, 173–189. ( 10.1016/0045-7825(89)90111-4) [DOI] [Google Scholar]
- 47.Humphrey JD. 2002. Cardiovascular solid mechanics: cells, tissues, and organs. New York, NY: Springer. [Google Scholar]
- 48.Jeong J, Hussain F. 1995. On the identification of a vortex. J. Fluid Mech. 285, 69–94. ( 10.1017/S0022112095000462) [DOI] [Google Scholar]
- 49.Ku DN, Giddens DP, Zarins CK, Glagov S. 1985. Pulsatile flow and atherosclerosis in the human carotid bifurcation: positive correlation between plaque location and low oscillating shear stress. Arteriosclerosis 5, 293–302. ( 10.1161/01.ATV.5.3.293) [DOI] [PubMed] [Google Scholar]
- 50.Zarins CK, Giddens DP, Bharadvaj BK, Sottiurai VS, Mabon RF, Glagov S. 1983. Carotid bifurcation atherosclerosis: quantitative correlation of plaque localization with flow velocity profiles and wall shear stress. Circ. Res. 53, 502–514. ( 10.1161/01.RES.53.4.502) [DOI] [PubMed] [Google Scholar]
- 51.Tada S, Tarbell JM. 2006. Oxygen mass transport in a compliant carotid bifurcation model. Ann. Biomed. Eng. 34, 9,1389–1399. ( 10.1007/s10439-006-9155-z) [DOI] [PubMed] [Google Scholar]
- 52.Ma PP, Li XM, Ku DN. 1997. Convective mass transfer at the carotid bifurcation. J. Biomech. 30, 565–571. ( 10.1016/S0021-9290(97)84506-X) [DOI] [PubMed] [Google Scholar]
- 53.Qiu Y, Tarbell JM. 2000. Numerical simulation of oxygen mass transfer in a compliant curved tube model of a coronary artery. Ann. Biomed. Eng. 28, 26–38. ( 10.1114/1.251) [DOI] [PubMed] [Google Scholar]
- 54.Parmar KM, et al. 2006. Integration of flow-dependent endothelial phenotypes by Kruppel-like factor 2. J. Clin. Invest. 116, 49–58. ( 10.1172/JCI24787) [DOI] [PMC free article] [PubMed] [Google Scholar]
- 55.Peiffer V, Sherwin SJ, Weinberg PD. 2013. Does low and oscillatory wall shear stress correlate spatially with early atherosclerosis? A systematic review. Cardiovasc. Res. 99, 242–250. ( 10.1093/cvr/cvt044) [DOI] [PMC free article] [PubMed] [Google Scholar]
- 56.Zhang Q, Steinman DA, Friedman MH. 2010. Use of a factor analysis to characterize arterial geometry and predict hemodynamic risk: application to the human carotid bifurcation. J. Biomech. Eng. 132, 114505 ( 10.1115/1.4002538) [DOI] [PubMed] [Google Scholar]
- 57.Bijari PB, Antiga L, Gallo D, Wasserman BA, Steinman DA. 2012. Improved prediction of disturbed flow via hemodynamically-inspired geometric variables. J. Biomech. 45, 1632–1637. ( 10.1016/j.jbiomech.2012.03.030) [DOI] [PMC free article] [PubMed] [Google Scholar]
- 58.Hoi Y, Wasserman BA, Lakatta EG, Steinman DA. 2010. Carotid bifurcation hemodynamics in older adults: effect of measured versus assumed flow waveform. J. Biomech. Eng. 132, 071006 ( 10.1115/1.4001265) [DOI] [PMC free article] [PubMed] [Google Scholar]
- 59.Hoi Y, Wasserman BA, Lakatta EG, Steinman DA. 2010. Effect of common carotid artery inlet length on normal carotid bifurcation hemodynamics. J. Biomech. Eng. 132, 121008 ( 10.1115/1.4002800) [DOI] [PMC free article] [PubMed] [Google Scholar]
- 60.Phan-Thien N, Fang Z. 1996. Entrance length and pulsatile flows of a model concentrated suspension. J. Rheol. 40, 521–529. ( 10.1122/1.550757) [DOI] [Google Scholar]
- 61.Grinberg L, Yakhot A, Karniadakis GE. 2009. Analyzing transient turbulence in a stenosed carotid artery by proper orthogonal decomposition. Ann. Biomed. Eng. 37, 2200–2217. ( 10.1007/s10439-009-9769-z) [DOI] [PubMed] [Google Scholar]
- 62.Kefayati S, Holdsworth DW, Poepping TL. 2014. Turbulence intensity measurements using particle image velocimetry in diseased carotid artery models: effect of stenosis severity, plaque eccentricity, and ulceration. J. Biomech. 47, 253–263. ( 10.1016/j.jbiomech.2013.09.007) [DOI] [PubMed] [Google Scholar]
- 63.Ishii M, Hibiki T. 2010. Thermo-fluid dynamics of two-phase flow. New York, NY: Springer. [Google Scholar]


