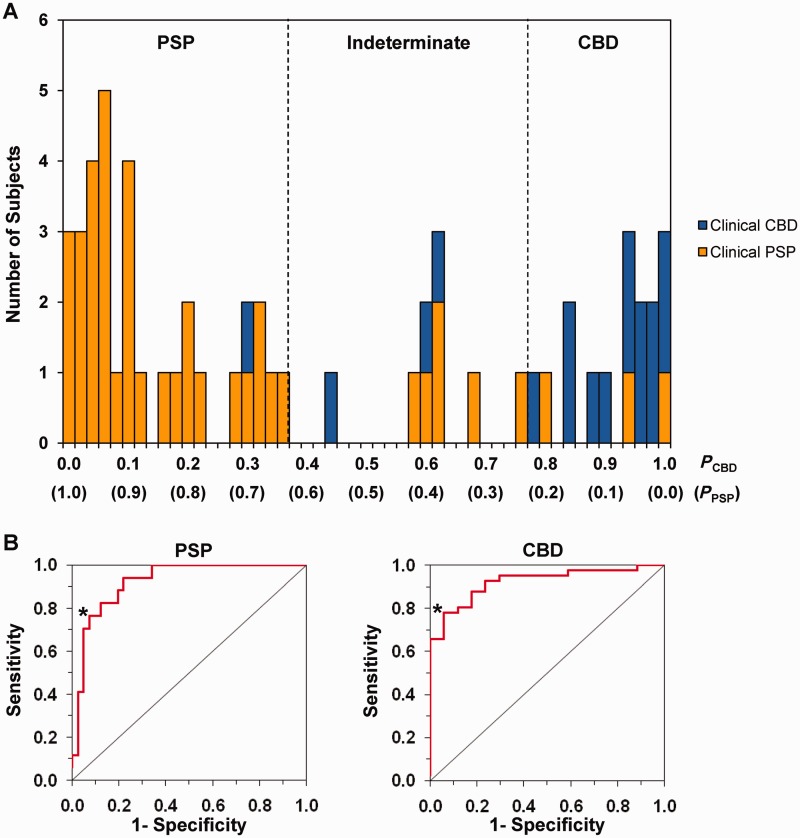
Figure 5.
Results of the automated algorithm for differential diagnosis between CBD and PSP. (A) Frequency distribution diagram illustrating the disease probabilities of CBD and PSP calculated for the 58 subjects (17 CBD and 41 PSP) in the testing sample. Individual patients were classified as having CBD if the probability value for CBD (PCBD) was >0.78 (i.e. cut-offCBD; 16 subjects located to the right of the right dotted line), and as PSP if the probability value for PSP (PPSP) was >0.63 (i.e. cut-offPSP; 33 subjects located to left of the left dotted line). Patients whose probability values for CBD and PSP were both lower than their corresponding cut-off probabilities were classified as indeterminate cases, i.e. nine subjects located between the left and right dotted lines. The final clinical diagnoses of CBD and PSP patients are indicated by blue and orange bars, respectively. (B) Based on the receiver-operating characteristic (ROC) analysis for all patients in the testing sample, the area-under-the-curve (AUC) for PSP (left) and CBD (right) was 0.92 (P < 0.0001), consistent with that (0.94, P < 0.0001; not shown) of the training sample. The cut-off probability of each disease was determined based on the inflection point (asterisk) on each curve corresponding to the high specificity and sensitivity for classifying individual patients with each disease.

