

Abstract
The reactive dicarbonyls, glyoxal and methylglyoxal (MG), increase in diabetes and may participate in the development of diabetic complications. Glyoxal and MG are detoxified by the sequential activities of glyoxalase 1 (GLO1) and glyoxalase 2. To determine the contribution of these dicarbonyls to the etiology of complications, we have genetically manipulated GLO1 levels in apolipoprotein E‐null (Apoe−/−) mice. Male Apoe−/− mice, hemizygous for a human GLO1 transgene (GLO1TGApoe−/− mice) or male nontransgenic Apoe−/− litter mates were injected with streptozotocin or vehicle and 6 or 20 weeks later, aortic atherosclerosis was quantified. The GLO1 transgene lessened streptozotocin (STZ)‐induced increases in immunoreactive hydroimidazolone (MG‐H1). Compared to nondiabetic mice, STZ‐treated GLO1TGApoe−/− and Apoe−/− mice had increased serum cholesterol and triglycerides and increased atherosclerosis at both times after diabetes induction. While the increased GLO1 activity in the GLO1TGApoe−/− mice failed to protect against diabetic atherosclerosis, it lessened glomerular mesangial expansion, prevented albuminuria and lowered renal levels of dicarbonyls and protein glycation adducts. Aortic atherosclerosis was also quantified in 22‐week‐old, male normoglycemic Glo1 knockdown mice on an Apoe−/− background (Glo1KDApoe−/− mice), an age at which Glo1KD mice exhibit albuminuria and renal pathology similar to that of diabetic mice. In spite of ~75% decrease in GLO1 activity and increased aortic MG‐H1, the Glo1KDApoe−/− mice did not show increased atherosclerosis compared to age‐matched Apoe−/− mice. Thus, manipulation of GLO1 activity does not affect the development of early aortic atherosclerosis in Apoe−/− mice but can dictate the onset of kidney disease independently of blood glucose levels.
Keywords: ApoE‐deficient mice, atherosclerosis, diabetes, glyoxalase, nephropathy
Increased levels of methylglyoxal and methylglyoxal‐derived advanced glycation end products may contribute to the development of diabetic complications. We show that overexpression of an enzyme that participates in the pathway of methylglyoxal detoxification, glyoxalase 1, protects streptozotocin‐treated, apolipoprotein E‐deficient mice from diabetic kidney disease but not from diabetes‐induced accelerated aortic atherosclerosis.
Introduction
Diabetes‐induced metabolic derangements including elevated levels of advanced glycation end products (AGEs) are believed to play a causative role in the development of both microvascular and macrovascular diabetic complications (Vlassara and Palace 2002; Yan et al. 2003; Goldin et al. 2006). AGE levels are increased in diabetes (Thornalley et al. 2003) and immunoreactive AGEs are detected at sites of diabetic injury (Sugimoto et al. 1997; Hammes et al. 1999; Vlassara and Palace 2002; Forbes et al. 2003). AGE levels in skin are also strong predictors of cardiac mortality (Meerwaldt et al. 2007), retinopathy and nephropathy (Genuth et al. 2005) in diabetic patients. Reducing sugars and reactive dicarbonyls including glyoxal, methylglyoxal (MG), and 3‐deoxyglucosone can modify N‐terminal and lysine residue amino groups and arginine residue guanidino groups of protein to produce AGEs (Singh et al. 2001; Ulrich and Cerami 2001). MG concentrations are elevated 5‐ to 6‐fold in type 1 diabetic patients and 2‐ to 3‐fold in type 2 diabetic patients (Thornalley 1993) and, when quantified by liquid chromatography/tandem mass spectroscopy (LC‐MS/MS), MG‐derived hydroimidazolone, Nδ‐(5‐hydro‐5‐methyl‐4‐imidazolon‐2‐yl)‐ornithine (MG‐H1), is the predominant AGE in tissues of diabetic humans and rats (Thornalley et al. 2003). MG can be generated by a number of metabolic pathways (Fu et al. 1996; Thornalley 1998; Januszewski et al. 2003; Deng and Yu 2004; Turk 2010), with triose phosphate intermediates of glycolysis being a major source of MG in diabetes (Brownlee 2001). In cells, MG is detoxified primarily by the glyoxalase system. In the presence of reduced glutathione (GSH), MG spontaneously forms a hemithioacetal. Glyoxalase I (GLO1) catalyzes the isomerization of the hemithioacetal to S‐D‐lactoylglutathione that is then converted to D‐lactate by glyoxalase II (Thornalley 1993, 1998; Thornalley 2003).
Methylglyoxal and MG‐derived AGEs could potentially interfere with normal cell function and contribute to pathology by several distinct mechanisms. Approximately 0.2–0.4% of arginine residues are modified by MG‐H1 adducts in normal rat tissues and this is doubled if the rats are rendered diabetic with streptozotocin (STZ; Thornalley et al. 2003). Mitochondrial proteins (Rabbani and Thornalley 2008; Wang et al. 2009), proteasomal subunits (Queisser et al. 2010), factors involved in transcriptional regulation (Yao et al. 2007; Ceradini et al. 2008; El‐Osta et al. 2008; Thangarajah et al. 2009) and enzymes that provide a defense against oxidative stress (Paget et al. 1998; Wu and Juurlink 2002; Wang et al. 2009), and dicarbonyl stress (Takahashi et al. 1995) are among the targets of AGE modification and their inactivation or impaired function could negatively affect cell physiology. MG is present in extracellular fluid and plasma and can arise from different sources (Brownlee 2001; Kalapos 2013). AGE cross‐linking of extracellular matrix proteins in the vessel wall increases vascular stiffness (Wolffenbuttel et al. 1998; Vasan et al. 2003) and can decrease cell adherence and modify integrin‐mediated signaling (Beltramo et al. 2002; Dobler et al. 2006; Bhatwadekar et al. 2008). AGE‐modified extracellular proteins may also cause injury via binding to cell surface AGE receptors, of which, the best characterized is RAGE, the Receptor for AGEs. While there are differing views on whether AGE‐modified proteins are pathophysiological ligands for RAGE (Ahmed and Thornalley 2007; Heizmann 2007; Ramasamy et al. 2007), it is clear from experiments with RAGE‐null mice that RAGE makes an important contribution to both macrovascular (Soro‐Paavonen et al. 2008) and microvascular (Myint et al. 2006; Toth et al. 2008; Reiniger et al. 2010) diabetic complications possibly by binding non‐AGE, RAGE ligands such as S100/calgranulins and high mobility group box 1 protein (HMGB1). Moreover, there is a complex interaction between RAGE and GLO1 gene expression in the context of hyperglycemia. Exposure of cultured endothelial cells to hyperglycemia upregulates expression of RAGE, S100B, and HMGB1 and this can be prevented by overexpression of GLO1 (Yao and Brownlee 2009), whereas genetic inactivation of RAGE prevents the diabetes‐induced downregulation of GLO1 expression in kidneys of OVE26 mice, a mouse model of type 1 diabetes (Reiniger et al. 2010). It has been recently shown that, in humans, compared to stable carotid atherosclerotic plaques, rupture‐prone plaques have decreased GLO1 mRNA and protein and increased protein‐bound MG‐H1 and Nε‐carboxymethyllysine (Hanssen et al. 2014).
Genetic manipulation of GLO1 levels in rodent models has provided additional support for the role of dicarbonyl stress in the development of diabetic complications. Increasing GLO1 activity by somatic gene transfer reduces diabetic hyperalgesia in STZ‐treated mice, whereas hyperalgesia is evident in nondiabetic GLO1 knockdown mice (Bierhaus et al. 2012). Overexpression of GLO1 in bone marrow cells can also reverse impaired neovascularization in diabetic mice after experimental hind limb ischemia (Vulesevic et al. 2014). The increased GLO1 activity in human GLO1 transgenic rats results in lower levels of dicarbonyls and dicarbonyl‐derived AGEs in blood and tissues (Brouwers et al. 2011), and protects against diabetes‐induced endothelial dysfunction (Brouwers et al. 2010) and retinal pathology (Berner et al. 2012). Renal senescence in nondiabetic GLO1 transgenic rats is also retarded. (Ikeda et al. 2012). We have recently shown that GLO1 knockdown (Glo1KD) mice have increased renal levels of MG‐H1 and 3‐nitrotyrosine (3‐NT), a marker of oxidative stress, and show structural and functional changes in the kidney that are similar to those of diabetic mice in spite of normal levels of blood glucose. In contrast, STZ‐treated GLO1 transgenic mice are protected from renal dicarbonyl and oxidative stress and from diabetes‐induced kidney pathology, despite hyperglycemia (Giacco et al. 2014). Thus, MG levels can determine the onset of kidney disease in mice independently of blood glucose levels. Here, we have examined if MG levels have a similar predominant role in the onset of diabetic macrovascular disease. We have tested if GLO1 overexpression can protect against accelerated atherosclerosis in STZ‐treated apolipoprotein E‐deficient (Apoe−/−) mice and if GLO1 knockdown can promote atherogenesis in nondiabetic Apoe−/− mice.
Research Design and Methods
Mice and induction of diabetes
The production and preliminary characterization of the cmyc epitope‐tagged human GLO1 transgenic mice have been described previously (Giacco et al. 2014; Vulesevic et al. 2014). For the atherosclerosis and nephropathy studies reported here, the GLO1 transgenic mice were bred onto an Apoe−/− background. Male mice hemizygous for the GLO1 transgene (GLO1TGApoe−/−) were compared to male nontransgenic Apoe−/− littermates (non‐TG mice). To induce diabetes, 10‐week‐old GLO1TGApoe−/− and non‐TG males were injected intraperitoneally with 50 mg/kg of streptozotocin (STZ) in 0.05 mol/L sodium citrate (pH 4.5) on five consecutive days. Control GLO1TGApoe−/− and non‐TG males were similarly injected with citrate buffer. One week later and, again, 1 day before the mice were sacrificed, blood was taken from the saphenous vein for measurement of blood glucose concentration (One‐Touch, Ultra glucometer). STZ‐injected GLO1TGApoe−/− and non‐TG mice with blood glucose levels above 12 mmol/L were considered diabetic and included in the study. Glo1 knockdown mice (El‐Osta et al. 2008; Giacco et al. 2014) were bred onto an Apoe−/− background (Glo1KDApoe−/− mice) and were maintained on a standard chow diet. All animal procedures confirm to the Guide for the Care and Use of Laboratory Animals published by the US National Institutes of Health (NIH Publication No. 85‐23, revised 1996).
Determination of immunoreactive human GLO1, GLO1 activity, and reduced glutathione in cell and tissue extracts
Immunoreactive cmyc‐hGLO1 was detected in cell and tissue extracts by western blotting using the anti‐cmyc monoclonal antibody 9E10. The 9E10 hybridoma was obtained from ATCC. GLO1 activity in cell and tissue samples was measured by the method of Oray and Norton (Oray and Norton 1982). Reduced glutathione was measured using the Promega GSH‐Glo™ glutathione assay kit (Promega, Madison, WI) using the protocol provided by the manufacturer.
Quantification and characterization of atherosclerotic lesions
The method for quantification of atherosclerotic lesions in tissue sections of the aortic root has been described in detail (Daugherty and Whitman 2003). Briefly, lesion size in the ascending aorta was determined from four 10‐μm Oil Red O‐stained serial sections, taken at 100‐μm intervals with the first section (level 0) being defined as that including the ostia for the coronary arteries. Lesion area was determined as intimal tissue within the internal elastic lamina quantified using Image‐Pro software (Media Cybernetics). The lesion complexity index in the aortic root was determined according to the criteria of the Animal Models of Diabetic Complications Consortium (http://www.amdcc.org). Briefly, on the same slide, the ratio of complex lesions (with cholesterol clefts, necrosis, or fibrous cap formation) to total lesions was determined. Aortic tissues were prepared for en face analysis as has been described (Daugherty and Whitman 2003). Digital images of the exposed intimal surface were captured and analyzed using Image Pro software. Macrophages were identified in frozen sections of the ascending aorta using a rat anti‐mouse CD68 primary antibody (Serotec #MCA1957) followed by sequential incubations with a horse radish peroxidase (HRP)‐conjugated goat anti‐rat‐IgG antibody (Serotec #STAR72) and the HRP substrate, 3,3′diaminobenzidine (Vector Laboratories).
Plasma lipid concentrations and lipoprotein profiles
Serum cholesterol and triglyceride concentrations were measured using commercial kits (Wako Bioproducts, Richmond, VA). To determine serum lipoprotein profiles, 50‐μL serum samples from individual mice were subjected to Superose 6 (Pharmacia LKB Biotechnology, Uppsala, Sweden) gel exclusion chromatography and total cholesterol concentrations (Wako Bioproducts) were measured in 0.5 mL fractions.
Determination of dicarbonyls and protein glycation adducts
Methylglyoxal content of kidney samples was assayed by stable isotopic dilution analysis liquid chromatography–tandem mass spectrometry (LC‐MS/MS) as described (Kurz et al. 2011). Protein glycation adducts and the nitration marker 3‐nitrotyosine (3‐NT) were detected and quantified by stable isotopic dilution analysis LC‐MS/MS. Kidney soluble protein extracts were prepared, hydrolyzed enzymatically, and assayed as described (Karachalias et al. 2010). Protein glycation adducts of aortal collagen was assayed similarly with a modified enzymatic hydrolysis employing bacterial collagenase (Dobler et al. 2006). Protein glycation adducts determined were as follows: the early‐stage glucose‐derived glycation adduct Nε‐fructosyl‐lysine (FL) and AGEs: MG‐derived AGEs – hydroimidazolone MG‐H1 and Nε‐carboxyethyl‐lysine (CEL); glyoxal‐derived AGEs – hydroimidazolone G‐H1, Nε‐carboxymethyl‐arginine (CMA), and Nε‐carboxymethyl‐lysine (CML; also formed from degradation of FL); and others – 3‐DG‐derived hydroimidazolones (3DG‐H) and pentosidine. Detection of immunoreactive MG‐HI in tissues by immunohistochemistry using a anti‐MG‐H1 monoclonal antibody (Kilhovd et al. 2003) was performed as described previously (Giacco et al. 2014). Detection and quantification of MG‐H1‐modified proteins by immunoprecipitation and western blotting has been described in detail (Thangarajah et al. 2009).
Assessment of albuminuria and renal pathology
At week 20, mice were placed in metabolic cages for 24 h and urine was collected. Urinary albumin was measured as described (Giacco et al. 2014). Severity of mesangial sclerosis was based on the mesangial area occupied by matrix and was scored on a semiquantitative 0–3 scale by a renal pathologist (V. D'Agati) blinded to the genotype and treatment protocol of the mice according to the previously published method (Reiniger et al. 2010).
Cytokine arrays
Thirty‐two cytokines were measured in 50 μg of aortic extracts from mice using the RayBio® Mouse Cytokine Antibody Array G2 (Ray Biotech Inc., Norcross, GA) according to the protocol provided by the manufacturer. Fluorescence was measured with a GenePix 4000B Microarray Scanner (Molecular Devices, Sunnyvale, CA).
Results
Characterization of human GLO1 transgenic mice
As we have reported previously, immunoreactive cmyc‐GLO1 was detected by western blotting in all tissues from GLO1TG mice that were tested (heart, aorta, kidney, liver, eye, and brain) and extracts from these tissues showed an approximately 1.5‐fold higher GLO1 activity compared to the respective tissues from nontransgenic littermates. Immunoreactive cmyc‐GLO1 was detected in cultured aortic endothelial cells, in aortic smooth muscle cells and in peritoneal and bone marrow‐derived macrophages isolated from GLO1TG mice and there was an approximately 5‐fold higher GLO1 activity in the cells from the GLO1TG mice compared to the equivalent cells isolated from nontransgenic littermates (Vulesevic et al. 2014). To test the effect of diabetes on GLO1 activity and the efficacy of the GLO1 transgene in reducing MG modification of proteins, GLO1TG mice and nontransgenic litter mates were administered STZ or vehicle. As was the case for nondiabetic mice, 6 weeks after induction of diabetes, GLO1 activity in aortic extracts from GLO1TG mice was about 1.5‐fold that of non‐TG mice (Fig. 1A). Neither STZ treatment, the presence of the GLO1 transgene (Fig. 1B) nor the administration of N‐acetylcysteine in the drinking water (not shown) significantly altered reduced glutathione levels in the aorta. Notably, the elevated GLO1 activity in the GLO1TG mice prevented the increase in MG‐H1 immunoreactive proteins in aortas (Fig. 1C and D) and kidneys (not shown) of the STZ‐treated mice. For all experiments described below, GLO1TG mice were bred onto an Apoe−/− background.
Figure 1.

Glyoxalase 1 (GLO1) activity, reduced glutathione (GSH), and MG‐H1 immunoreactivity in aortic extracts of GLO1TG mice and nontransgenic (Non‐TG) littermates that had been treated with streptozotocin (STZ) or vehicle. Mice were administered STZ or vehicle and 6 weeks later they were sacrificed and GLO1 activity (A), GSH levels (B) and MG‐H1 immunoreactivity (C and D) in aortic extracts were determined. *P < 0.001 GLO1TG versus nontransgenic, **P < 0.0001 STZ‐treated nontransgenic mice versus either nontransgenic vehicle‐treated mice or STZ‐treated GLO1TG mice.
Effect of the hGlo1 transgene on atherosclerosis in diabetic Apoe−/− mice
It has been reported that injection of Apoe−/− mice with STZ leads to accelerated atherosclerosis that is evident as early as 6 weeks after diabetes induction (Park et al. 1998). To test if increased GLO1 activity can retard the development of diabetic atherosclerosis, 10‐week‐old GLO1TGApoe−/− male mice and non‐TG Apoe−/− male litter mates maintained on a chow diet were injected with STZ or vehicle and, 6 weeks later, the animals were sacrificed and aortic atherosclerosis was quantified. Over the 6 weeks, both Glo1TGApoe−/− and non‐TGApoe−/−, STZ‐treated mice gained weight more slowly than did their nondiabetic counterparts. The GLO1 transgene did not influence fasting glucose levels. At the time of sacrifice, plasma cholesterol levels in STZ‐treated mice were about twice those of the vehicle‐injected mice (Table 1), with the excess cholesterol being associated primarily with VLDL/LDL‐sized lipoproteins (Fig. 2C) and neither plasma cholesterol levels nor lipoprotein profile were significantly altered by the GLO1 transgene. Plasma triglycerides were also higher in the diabetic mice and did not differ between GLO1TGApoe−/− mice and non‐TG mice. No differences between groups were observed in the level of the GLO1 cofactor, reduced GSH, in heart tissue adjacent to the aortic root (Table 1). As is seen in Figure 2A, mice showed little atherosclerosis in the aortic root and, while GLO1TGApoe−/− mice and non‐TGApoe−/− littermates that had been administered STZ, showed a trend toward increased lesion area compared to vehicle‐treated mice, this did not achieve statistical significance (P < 0.1). No differences in aortic root lesions between diabetic GLO1TGApoe−/− and diabetic nontransgenic litter mates were observed. En face analysis of atherosclerosis in the aortic arch (Fig. 2B) showed that lesion areas were similar between diabetic GLO1TGApoe−/− and diabetic nontransgenic Apoe−/− mice and, in both cases, were greater than nondiabetic mice (P < 0.02). Cytokine arrays on aortic extracts (n = 4) revealed no significant differences between any of the groups when normalized for total protein (not shown). Thus, in spite of increased GLO1 activity in tissues (Table 1), the GLO1TGApoe−/− mice were not protected from accelerated atherosclerosis due to the induction of diabetes in the aortic arch.
Table 1.
Physical and biochemical characteristics of mice at time of sacrifice
| Diabetes | Non‐TGApoe−/− | GLO1TGApoe−/− | STZ‐non‐TG Apoe−/− | STZ‐GLO1TG Apoe−/− |
|---|---|---|---|---|
| 6 weeks | ||||
| n | 14 | 9 | 14 | 15 |
| Body weight | 33.7 ± 1.0* | 31.5 ± 1.2 | 26.9 ± 1.0 | 28.5 ± 1.1 |
| Glucose (mmol/L)* | 8.2 ± 0.5 | 7.2 ± 0.7 | 25.6 ± 1.2 | 26.6 ± 1.2 |
| Cholesterol (mmol/L)* | 9.1 ± 0.6 | 9.4 ± 0.7 | 17.7 ± 2.0 | 17.5 ± 1.3 |
| Triglyceride (mmol/L)* | 1.3 ± 0.1 | 1.0 ± 0.1 | 2.1 ± 0.4 | 1.6 ± 0.4 |
| Glo1 activity* heart* | 1.4 ± 0.1 | 2.1 ± 0.1 | 1.3 ± 0.1 | 2.1 ± 0.1 |
| GSH (ng/μL) heart* | 7.8 ± 0.2 | 7.9 ± 1.0 | 7.9 ± 1.3 | 7.1 ± 0.3 |
| 20 weeks | ||||
| n | 13 | 13 | 15 | 14 |
| Body weight (g) | 40.2 ± 2.0 | 37.8 ± 1.4 | 31.8 ± 0.7 | 30.5 ± 0.7 |
| Glucose (mmol/L)* | 8.1 ± 0.6 | 6.4 ± 0.4 | 26.8 ± 0.7 | 27.1 ± 1.1 |
| Cholesterol (mmol/L)* | 9.8 ± 0.7 | 12.0 ± 0.9 | 21.6 ± 1.3 | 23.3 ± 1.4 |
| Triglyceride (mmol/L)* | 0.6 ± 0.1 | 1.0 ± 0.2 | 1.6 ± 0.3 | 2.0 ± 0.4 |
| GLO1 activity heart* | 1.9 ± 0.6 | 3.2 ± 0.6 | 1.5 ± 0.1 | 2.6 ± 0.3 |
| GLO1 activity kidney* | 1.4 ± 0.1 | 1.6 ± 0.1 | 1.3 ± 0.1 | 1.8 ± 0.1 |
| GSH (ng/μL) heart* | 9.0 ± 0.6 | 8.2 ± 0.5 | 9.0 ± 1.2 | 9.2 ± 0.3 |
| GSH (ng/μL) kidney* | 8.9 ± 0.5 | 12.8 ± 4.0 | 10.7 ± 2.3 | 9.1 ± 0.4 |
Mean ± standard error.
S‐D‐lactoylglutathione formation (mmol/min/mg cellular protein).
P < 0.0001 STZ‐treated versus vehicle‐treated (two‐way analysis of variance, ANOVA).
P < 0.04 STZ‐treated versus vehicle‐treated (two‐way ANOVA).
P < 0.0001 GLO1TG mice versus nontransgenic littermates (two‐way ANOVA).
Normalized to cytosolic protein. See Research Design and Methods.
P < 0.001 STZ‐treated versus vehicle‐treated (two‐way ANOVA).
P < 0.02 GLO1TG mice versus nontransgenic littermates (two‐way ANOVA).
P < 0.003 GLO1TG mice versus nontransgenic littermates (two‐way ANOVA).
Figure 2.
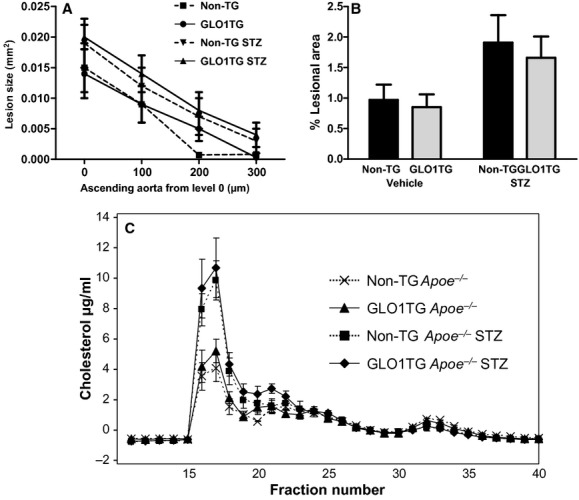
Early atherosclerosis in the aortic root (A) and aortic arch (B) of diabetic and nondiabetic non‐TGApoe−/− mice (non‐TG) and GLO1TGApoe−/− (GLO1TG) mice. Ten‐week‐old non‐TGApoe−/− or GLO1TGApoe−/− mice were injected with either streptozotocin (STZ) or vehicle as described in Research Design and Methods and were sacrificed 6 weeks later. Atherosclerosis was quantified in the ascending aorta at four levels separated by 100 μm and, by en face analysis, in the aortic arch. Atherosclerosis in the aortic root was not significantly affected by either STZ treatment or genotype. Diabetes significantly increased lesion area in the aortic arch (P = 0.02) and this was independent of the GLO1 transgene. (C) Cholesterol distribution in serum lipoprotein subfractions of mice 6 weeks after administration of STZ or vehicle. Serum from individual mice (n = 5) was subjected to Superose 6 gel exclusion chromatography. Cholesterol levels were determined in the column fractions.
At 6 weeks following induction of diabetes, we observed little atherosclerosis in the aortic root and aortic arch of the mice and the lesions that were present in the aortic root consisted predominantly of fatty streaks (not shown) and complex lesions were very rare. To test if increased GLO1 activity can prevent the further progression of diabetic atherosclerosis and the development of complex lesions, male GLO1TGApoe−/− and non‐TGApoe−/− litter mates were injected with STZ or vehicle and were maintained on a chow diet for 20 weeks before sacrifice. As was the case at 6 weeks after STZ administration, cholesterol and triglyceride levels were higher in the diabetic mice regardless of genotype (Table 1) with the cholesterol being primarily in the VLDL/IDL fractions (not shown). Quantification of lesions in the aortic root (Fig. 3A) showed that diabetes increases atherosclerosis in the mice and this is not mitigated by the GLO1 transgene. GLO1TGApoe−/− diabetic mice also did not differ from diabetic non‐TGApoe−/− mice in the numbers of complex lesions in the aortic root (Fig. 3B). Lesions were larger in GLO1TGApoe−/− (Fig. 4G) and nontransgenic litter mates (Fig. 4E) that had been administered STZ compared to the respective vehicle‐injected controls (Fig. 4A and C) and showed extensive macrophage infiltration (Fig. 4F and H). Likewise, the GLO1 transgene did not prevent the STZ‐induced increase in atherosclerosis in either the aortic arch (Fig. 3C) or the descending thoracic aorta between the origins of intercostal arteries 1 and 5 (Fig. 3D). Although the GLO1 transgene did not protect Apoe−/− mice from accelerated atherosclerosis after STZ treatment, it appeared to reduce MG‐H1 immunoreactivity in aortic extracts from diabetic animals (Fig. 3E).
Figure 3.

Late aortic atherosclerosis and MG‐H1 immunoreactivity in diabetic and nondiabetic GLO1TGApoe−/− (GLO1TG) mice and nontransgenic Apoe−/− littermates (non‐TG). Ten‐week‐old non‐TGApoe−/− or GLO1TGApoe−/− mice were injected with either streptozotocin (STZ) or vehicle and were sacrificed 20 weeks later. Atherosclerotic lesion area (A) and lesion complexity (B) were quantified in the ascending aorta at four levels separated by 100 μm. Atherosclerotic lesion area was quantified in the aortic arch (C) and descending thoracic aorta (between the origins of intercostal arteries 1 and 5) (D) by en face analysis. Diabetes significantly increased lesion area in the ascending aorta (P < 0.0001), the aortic arch (P < 0.0003), and the descending thoracic aorta (P < 0.0001) and this was independent of the GLO1 transgene. (E) MG‐H1 immunoreactivity in aortic extracts determined by immunoprecipitation/western blotting.
Figure 4.

Lipid and macrophage accumulation in lesions of the aortic root. Sequential sections of the aortic root (situated between level 0 and 1) stained for lipid with Sudan IV (A, C, E, and G) or for CD68‐positive macrophages (B, D, F, and H) from GLO1TGApoe−/− mice (C, D, G, and H) or nontransgenic Apoe−/− litter mates (A, B, E, and F) that had been administered streptozotocin (E–H) or vehicle (A–D).
To gain further insight on the effect of the GLO1 transgene on glycation of aortal extracellular matrix (ECM), we analyzed protein glycation markers in aortal collagen of Apoe−/− mice after 6 weeks and 20 weeks with and without STZ‐induced diabetes (Table 2). At 6 weeks the only changes in proteins glycation were an approximately 2‐fold increase of FL residue and 3‐fold increase in 3DG‐H residue content in STZ diabetic non‐TGApoe−/− with respect to nondiabetic controls which was not changed significantly by the GLO1 transgene. At 20 weeks, there was a further increase in FL residue content to 14.7 mmol/mol lys, 3‐fold higher than nondiabetic controls. 3DG‐H residue content of STZ diabetic Apoe−/− mice remained increased by approximately 3‐fold and CML and MG‐H1 residue contents were also increased, 54% and 38%, respectively, in STZ diabetic Apoe−/− mice. The GLO1 transgene did not prevent this increase.
Table 2.
Protein damage of aortal collagen in Apoe−/− mice – effect of the GLO1 transgene and streptozotocin‐induced diabetes
| Analyte | Non‐TGApoe−/− | GLO1TGApoe−/− | STZ‐non‐TGApoe−/− | STZ‐GLO1TGApoe−/− |
|---|---|---|---|---|
| 6 weeks | ||||
| FL (mmol/mol lys) | 3.44 ± 0.76 | 3.42 ± 0.45 | 7.92 ± 1.45* | 7.75 ± 1.70*† |
| CML (mmol/mol lys) | 0.236 ± 0.026 | 0.216 ± 0.025 | 0.216 ± 0.020 | 0.206 ± 0.014 |
| 3DG‐H (mmol/mol arg) | 0.074 ± 0.028 | 0.047 ± 0.013 | 0.216 ± 0.020* | 0.206 ± 0.014*‡ |
| MG‐H1 (mmol/mol arg) | 0.358 ± 0.022 | 0.331 ± 0.025 | 0.327 ± 0.013 | 0.395 ± 0.037 |
| CEL (mmol/mol lys) | 0.066 ± 0.011 | 0.071 ± 0.009 | 0.045 ± 0.007 | 0.056 ± 0.012 |
| CMA (mmol/mol arg) | 0.124 ± 0.011 | 0.134 ± 0.017 | 0.154 ± 0.020 | 0.103 ± 0.023 |
| Pentosidine (mmol/mol lys) | 0.013 ± 0.009 | 0.007 ± 0.003 | 0.017 ± 0.001 | 0.017 ± 0.002 |
| 3‐NT (mmol/mol tyr) | 0.054 ± 0.012 | 0.046 ± 0.007 | 0.042 ± 0.008 | 0.051 ± 0.012 |
| 20 weeks | ||||
| FL (mmol/mol lys) | 4.92 ± 0.67 | 5.22 ± 0.62 | 14.70 ± 1.65*** | 14.70 ± 1.65***‡ |
| CML (mmol/mol lys) | 0.246 ± 0.037 | 0.237 ± 0.015 | 0.378 ± 0.046* | 0.408 ± 0.042*‡ |
| 3DG‐H (mmol/mol arg) | 0.076 ± 0.016 | 0.061 ± 0.011 | 0.190 ± 0.028** | 0.171 ± 0.022** |
| MG‐H1 (mmol/mol arg) | 0.407 ± 0.028 | 0.354 ± 0.010 | 0.560 ± 0.061* | 0.486 ± 0.025‡ |
| CEL (mmol/mol lys) | 0.090 ± 0.007 | 0.102 ± 0.011 | 0.061 ± 0.012 | 0.088 ± 0.011 |
| CMA (mmol/mol arg) | 0.131 ± 0.008 | 0.127 ± 0.005 | 0.118 ± 0.013 | 0.130 ± 0.013 |
| Pentosidine (mmol/mol lys) | 0.025 ± 0.005 | 0.030 ± 0.003 | 0.024 ± 0.004 | 0.027 ± 0.006 |
| 3‐NT (mmol/mol tyr) | 0.010 ± 0.002 | 0.012 ± 0.003 | 0.013 ± 0.004 | 0.012 ± 0.002 |
Data are mean ± SEM, n = 8.
Significance: *, ** and ***P < 0.05, P < 0.01 and P < 0.001 with respect to Apoe−/− control; †P < 0.05 compared to GLO1TGApoe−/− and ‡P < 0.01 compared to GLO1TGApoe−/−.
Effect of the hGlo1 transgene on renal function in diabetic Apoe−/− mice
Renal pathology and albuminuria were also evaluated 20 weeks after the GLO1TGApoe−/−and non‐TGApoe−/− litter mates had been injected with STZ or vehicle. Mesangial sclerosis was apparent in diabetic non‐TGApoe−/− mice and this was significantly reduced in STZ‐treated GLO1TGApoe−/− mice (Fig. 5A–E). Urinary albumin excretion over 24 h in diabetic non‐TGApoe−/− mice was approximately 4‐fold that of nondiabetic, non‐TGApoe−/−mice (Fig. 5F). Albumin excretion in the STZ‐treated GLO1TGApoe−/− mice did not exceed that of nondiabetic non‐TGApoe−/− mice. Nondiabetic GLO1TGApoe−/− mice also showed a significant decrease in albuminuria compared to that of nondiabetic, non‐TGApoe−/− mice. Measurement of methylglyoxal and markers of protein damage in renal tissue by LC‐MS/MS showed that diabetes increases MG, Nε‐carboxyethyllysine (CEL) and 3‐nitrotyrosine (3‐NT) levels in kidney homogenates of non‐TGApoe−/− mice with the diabetes‐induced increases being reduced or absent in kidney extracts from diabetic GLO1TGApoe−/− mice (Table 3). Fructosyllysine levels were significantly higher in STZ‐treated mice and this was independent of the GLO1 transgene. Based on the LC‐MS/MS results neither MG‐H1 nor CML levels were higher in diabetic mice and were not modulated by the higher GLO1 activity of the GLO1TGApoe−/− mice. However, by immunohistochemistry using an anti‐MG‐H1 monoclonal antibody, the renal cortex of STZ‐treated non‐transgenic mice (Fig. 5J) showed higher immunoreactivity than that of nondiabetic mice (Fig. 5G and H) or STZ‐treated GLO1TGApoe−/− mice (Fig. 5I). For all of the mice, the MG‐H1 immunoreactivity was especially evident in the glomeruli.
Figure 5.

Mesangial sclerosis, albuminuria, and MG‐H1 immunoreactivity in diabetic and nondiabetic GLO1TGApoe−/− (GLO1TG) and in nontransgenic Apoe−/− litter mates (non‐TG). Ten‐week‐old GLO1TGApoe−/− or non‐TGApoe−/− mice were injected with either streptozotocin (STZ) or vehicle and 20 weeks later mice were placed in metabolic cages, urine was collected over 24 h before the mice were sacrificed. Paraffin sections of renal cortex from GLO1TGApoe−/− (B, D, H, and J) and nontransgenic Apoe−/− littermates (A, C, G, and I) treated with STZ (C, D, I, and J) or vehicle (A, B, G, and H) and were stained with periodic acid‐Schiff (A–D) or for MG‐H1 immunoreactivity with the 1H7C6 anti‐MG‐H1 monoclonal antibody (G–J). The severity of mesangial sclerosis was scored on a scale of 1–3 as described in the Research Design and Methods section (E) and showed that, in STZ‐treated mice, the GLO1 transgene significantly reduced the mesangial area occupied by matrix (P < 0.01). The GLO1 transgene also protected Apoe−/− mice from the STZ‐induced increase in albuminuria (P < 0.001) (F).
Table 3.
Methylglyoxal and protein glycation in kidneys of GLO1TGApoe−/− and nontransgenic littermates, 20 weeks following completion of treatment with streptozotocin (STZ) or vehicle
| Non‐TGApoe−/− | GLO1TGApoe−/− | STZ‐non‐TGApoe−/− | STZ‐GLO1TGApoe−/− | |
|---|---|---|---|---|
| MG (pmol/mg tissue wet weight) | 3.24 ± 0.23* | 3.45 ± 0.26 | 4.41 ± 0.38* | 3.36 ± 0.18* |
| MG‐H1 (mmol/mol arg) | 0.162 ± 0.011 | 0.173 ± 0.013 | 0.149 ± 0.013 | 0.155 ± 0.012 |
| CEL (mmol/mol lys) | 0.022 ± 0.004 | 0.015 ± 0.004 | 0.051 ± 0.011* | 0.029 ± 0.004* |
| CML (mmol/mol lys) | 0.141 ± 0.017 | 0.128 ± 0.020 | 0.160 ± 0.019 | 0.164 ± 0.020 |
| FL (mmol/mol lys) | 1.36 ± 0.14 | 1.82 ± 0.53 | 5.19 ± 0.69* | 5.82 ± 0.36* |
| 3‐NT (μmol/mol tyr) | 1.55 ± 0.54 | 0.92 ± 0.29 | 5.75 ± 1.52* | 3.81 ± 0.48* |
Mean ± SEM.
P < 0.03 non‐TGApoe−/−STZ treated versus non‐TGApoe−/− vehicle treated.
P < 0.04 GLO1TGApoe−/− STZ treated versus non‐TGApoe−/−STZ treated.
P < 0.003 non‐TGApoe−/−STZ treated versus non‐TGApoe−/− vehicle treated.
P < 0.05 GLO1TGApoe−/−STZ treated versus non‐TGApoe−/−STZ treated.
P < 0.0001 non‐TGApoe−/−STZ treated versus non‐TGApoe−/− vehicle treated.
P < 0.02 h GLO1TGApoe−/−STZ treated versus non‐TGApoe−/−STZ treated.
Effect of reduced GLO1 activity on atherosclerosis in nondiabetic Apoe−/− mice
It is possible that the STZ‐induced increase in serum cholesterol in the GLO1TGApoe−/− may have masked any anti‐atherogenic effects of reduced dicarbonyl stress. To further explore if increased reactive dicarbonyl levels alone can exacerbate atherosclerosis in Apoe−/− mice, we have bred Glo1KD mice that have a 45–65% reduction in GLO1 activity (El‐Osta et al. 2008) onto an Apoe−/− background (Glo1KDApoe−/−mice). The mice were maintained on a chow diet and, at 22 weeks of age, the Glo1KDApoe−/−and age‐matched Apoe−/− mice were sacrificed for quantification of atherosclerosis. At 22 weeks of age, Glo1KD mice show structural changes in the kidney similar to diabetic mice and increased albumin excretion compared to age‐matched wild‐type mice (Giacco et al. 2014). At the time of sacrifice Glo1KDApoe−/− and Apoe−/− controls did not differ in terms of fasting serum glucose, cholesterol, or triglyceride levels and, in spite of GLO1 activities in tissues of Glo1KDApoe−/− mice that were approximately 25% of those in tissues of Apoe−/− mice (Table 4). No differences were observed between Glo1KDApoe−/− mice and Apoe−/− mice in the distribution of cholesterol among the serum lipoprotein subfractions (not shown). Reduced GLO1 activity in the Glo1KDApoe−/− mice increased MG‐H1 immunoreactivity in extracts of aorta (Fig. 6A and B) and kidney (not shown); however, the Glo1KDApoe−/−mice did not develop more atherosclerosis at 22 weeks of age in either the aortic root (Fig. 6C, E and F) or the aortic arch (Fig. 6D) and actually showed a trend toward decreased lesion area in the aortic root (mean average lesion area calculated from the four transverse sections, Glo1KDApoe−/−: 0.038 ± 0.008, Apoe−/−: 0.071 ± 0.013, P = 0.06). Measurement of aortal collagen glycation at 22 weeks revealed no significant differences between the Glo1KDApoe−/− and Apoe−/− mice (Table 5).
Table 4.
Physical and biochemical characteristics of mice at time of sacrifice
| 20‐week Apoe−/− | 20‐week Glo1KDApoe−/− | |
|---|---|---|
| Body weight (g) | 31.1 ± 0.5 | 30.9 ± 0.4* |
| Glucose (mmol/L) | 10.5 ± 0.9 | 10.3 ± 0.9 |
| Cholesterol (mmol/L) | 15.3 ± 0.9 | 15.6 ± 1.1 |
| Triglyceride (mmol/L) | 1.1 ± 0.1 | 1.3 ± 0.2 |
| GLO‐1 activity heart* | 1.18 ± 0.05 | 0.24 ± 0.04* |
| GLO‐1 activity kidney* | 0.92 ± 0.04 | 0.24 ± 0.05* |
Mean ± standard error.
S‐D‐lactoylglutathione formation (mmol/min/mg cellular protein).
P < 0.0001 unpaired Student's t‐test.
Figure 6.

Immunoreactive MG‐H1‐modified proteins and atherosclerosis in the aortas of 22‐week‐old Glo1KDApoe−/− mice and nontransgenic Apoe−/− littermates. MG‐H1 immunoreactive proteins were detected in aortic extracts with an MG‐H1‐specific monoclonal antibody (A) and were quantified and normalized to the light chain of the mouse IgG (IgG LC) used for immunoprecipitation (B). Atherosclerosis was quantified in the ascending aorta at four levels separated by 100 μm (C) and, by en face analysis, in the aortic arch (D). Sections of the aortic root (situated between level 0 and 1) from nontransgenic Apoe−/− (E) or Glo1KDApoe−/− (F) mice stained for CD68‐positive macrophages. *P < 0.04.
Table 5.
Glycation of aortal collagen in Apoe−/− mice – effect of reduced GLO1 activity
| Age | Analyte | Apoe −/− | Glo1KDApoe−/− |
|---|---|---|---|
| 22 weeks | FL (mmol/mol lys) | 5.24 ± 1.01 | 6.42 ± 0.86 |
| CML (mmol/mol lys) | 0.430 ± 0.042 | 0.385 ± 0.048 | |
| 3DG‐H (mmol/mol arg) | 0.060 ± 0.011 | 0.066 ± 0.019 | |
| MG‐H1 (mmol/mol arg) | 0.344 ± 0.034 | 0.375 ± 0.052 | |
| CEL (mmol/mol lys) | 0.155 ± 0.011 | 0.191 ± 0.019 | |
| CMA (mmol/mol arg) | 0.120 ± 0.008 | 0.129 ± 0.005 | |
| Pentosidine (mmol/mol lys) | 0.016 ± 0.003 | 0.020 ± 0.002 |
Data are mean ± SEM; at 20 weeks, n = 6 for both groups.
Discussion
Given the potential ability of MG and MG‐derived AGEs to increase inflammation and reactive oxygen species and to modify intracellular and extracellular proteins, we had anticipated that the overexpression of GLO1 in endothelial cells, vascular smooth muscle cells, and macrophages would retard the development of atherosclerosis in diabetic Apoe−/− mice in parallel with a reduction in kidney pathology. Likewise, we believed that knockdown of GLO1 would lead not only to kidney disease as we have previously shown (Giacco et al. 2014) but also increase atherosclerosis in nondiabetic Apoe−/− mice. We observed, however, that elevated GLO1 activity in diabetic GLO1TGApoe−/− fails to impede diabetes‐induced accelerated aortic atherosclerosis in spite of reducing MG‐H1 immunoreactive proteins in aortic extracts. These same STZ‐treated GLO1TGApoe−/− mice are, nevertheless, protected against renal pathology and albuminuria. Furthermore, the reduced GLO1 activity in Glo1KDApoe−/− mice results in increased MG‐H1 immunoreactive proteins in the aorta but this does not exacerbate atherogenesis in nondiabetic mice at an age when Glo1KD mice manifest renal pathology and albuminuria similar to that seen in diabetic mice (Giacco et al. 2014). We have previously proposed that, in mice, MG levels determine the glycemic set‐point for the onset of diabetic nephropathy (Giacco et al. 2014) and this proposal is supported by the results of this study. In contrast to nephropathy, however, we now show that manipulation of GLO1 activity and as a consequence, dicarbonyl stress, does not alter the course of aortic atherogenesis in chow‐fed Apoe−/− mice.
It is notable that while the GLO1 transgene reduced immunoreactive MG‐H1 in aortal extracts of STZ‐treated Apoe−/− mice, it did not prevent increased dicarbonyl glycation (MG‐H1 at 20 weeks) of aortal extracellular matrix. The dichotomy between aortic immunoreactive MG‐H1 measured by immunoprecipitation/western blotting and collagen MG‐H1 levels measured by LC‐MS/MS may result from differences in the site of MG modification of the proteins and the origin of the MG. As collagen and other extracellular matrix proteins are likely poorly soluble in the extraction buffer used for analysis of immunoreactive MG‐H1, the MG‐H1‐modified proteins detected by this methodology may be primarily cellular proteins whose modification would be a function of intracellular MG levels and GLO1 activity. The MG‐H1 residues determined by LC‐MS/MS were selectively measured in the extracellular matrix. As turnover of extracellular matrix is relatively slow, its modification by MG may be largely an extracellular event. MG‐H1 residues have slow dynamic reversibility of approximately 12 days (Ahmed et al. 2002) and so decreased plasma MG is expected to decrease MG‐H1. The findings suggest that in the GLO1TGApoe−/− mice, decreased exposure of extracellular matrix to MG occurs only in the immediate locality of cells expressing the GLO1 transgene. MG has membrane permeability through passive diffusion of the unhydrated form (Rabbani and Thornalley 2012). Therefore, in the diabetic state, increased MG generated within cells likely produces increased release of MG from cells and contributes to AGE modification of extracellular proteins. In the transgenic model, it is expected that the maximum suppression of MG glycation is achieved for MG‐modified cellular proteins of cells where GLO1 activity is increased. Since MG that modifies the extracellular matrix likely originates from both cells that express the transgene and from those that do not, as well as from extracellular sources (Kalapos 2013), MG modification of extracellular proteins would be less susceptible to modulation of GLO1 activity than would MG modification of cellular proteins. The failure of the GLO1 transgene to moderate AGE modification of aortic extracellular matrix may contribute to its inability to impede atherogenesis.
The STZ‐induced increase in MG, CEL, and immunoreactive MG‐H1 in the kidney of Apoe−/− mice was largely prevented by the human GLO1 transgene and this was associated with reduced mesangial sclerosis and albuminuria. Only a modest 36% increase of renal MG was found in STZ diabetic ApoE−/−mice with respect to nondiabetic controls. This may relate to regional changes in GLUT1 expression in the kidney in diabetes and related increased formation of MG by high cytoplasmic glucose concentration and increased anaerobic glycolysis. GLUT1 expression was decreased in the proximal tubular epithelium and increased in the cortical mesangial cells in experimental diabetes (Dominguez et al. 1994; D'Agord Schaan et al. 2001; Schaan et al. 2005). Increased kidney content of MG without concomitant increase in total protein MG‐H1 residues is suggestive of increased degradation of MG‐H1‐modified proteins to maintain proteome integrity. Without a related increase in expression this is likely to disturb the renal proteome. It is also notable that the increased MG‐H1 immunoreactivity in the STZ‐treated Apoe−/− mice was largely confined to the glomeruli (Fig. 4G–J) as we had previously observed (Giacco et al. 2014). The increase in renal levels of 3‐NT, a marker of oxidative and nitrosative stress, following STZ adminstration that was seen in non‐TGApoe−/− mice was also moderated in the STZ‐treated GLO1TGApoe−/− mice. Levels of 3‐NT were not increased in the aortas of either STZ‐treated mice or in Glo1KD mice compared to their respective controls.
Our failure to observe an effect of increased GLO‐1 activity on atherogenesis could, in part, reflect the mouse model of diabetic atherosclerosis. As has been observed by others (Park et al. 1998; Forbes et al. 2004; Lassila et al. 2004), we found that induction of diabetes in Apoe−/− mice with STZ resulted in an approximately two‐fold increase in apolipoprotein B‐associated plasma cholesterol. In human type 1 diabetic subjects, poor glycemic control is also associated with increased total and LDL cholesterol levels (The DCCT Research Group 1992; Petitti et al. 2007; Guy et al. 2009) although this is not as exaggerated as that which is seen in the diabetic Apoe−/− mice. The hypercholesterolemia that occurs in the Apoe−/− mice following STZ administration has been considered a shortcoming in this mouse model of human diabetic cardiovascular disease (Renard and Van Obberghen 2006; Hsueh et al. 2007; Kanter et al. 2007; Ramasamy and Goldberg 2010) and, in our case, may mask any macrovascular protective effects that are due to reducing dicarbonyl stress through overexpression of GLO1. Apoe−/− mice also differ from humans in the distribution of cholesterol within the plasma lipoprotein subfractions. We have previously shown that an arginine residue near the amino terminus of apolipoprotein B is a preferred target of MG modification when LDL is exposed to concentrations of MG that are commonly observed in diabetic subjects. This apoB modification was shown to increase the affinity of LDL for proteoglycans and to favor LDL retention in the artery wall and thus potentially increase LDL atherogenicity (Rabbani et al. 2011). Our inability to demonstrate atheroprotection with GLO1 overexpression or increased atherosclerosis in Glo1KD mice may, in part, reflect that, in Apoe−/− mice, cholesterol is primarily associated with remnant particles and not with LDL as is the case in humans.
Our finding that GLO1 overexpression can prevent diabetic albuminuria in STZ‐treated Apoe−/− mice but not aortic atherosclerosis resembles, at least superficially, the situation in human type 1 diabetic patients where it has been shown that intensive glycemic control is very effective in reducing and in moderating the progression of diabetic nephropathy, retinopathy, and neuropathy (The Diabetes Control and Complications Trial Research Group 1993), whereas alleviation of cardiovascular disease through aggressive lowering of blood glucose levels requires longer follow‐up periods to become evident (The Diabetes Control and Complications Trial Research Group 1995; Nathan et al. 2005). This likely reflects the multifactorial etiology of atherosclerosis. While there is a general consensus that hyperglycemia has a direct, primary role in the development of diabetic microvascular disease, the importance of elevated glucose levels in the initiation and progression of diabetic atherosclerosis remains a subject of debate (Chait and Bornfeldt 2009; Orasanu and Plutzky 2009; Bornfeldt and Tabas 2011). Renard et al. (2006) showed that when low‐density lipoprotein receptor‐deficient (Ldlr−/−) mice were subjected to viral‐induced, autoimmune, pancreatic β‐cell destruction and maintained on a cholesterol‐free diet, they became hyperglycemic without significant changes in plasma lipid levels. The diabetic mice had more fatty‐streak lesions in the brachiocephalic artery with increased lesion‐associated AGE immunoreactivity compared to that in nondiabetic animals. Thus, in this model, hyperglycemia in the absence of changes in serum lipids was sufficient to elicit early atherosclerotic lesions. Renard et al. (2006) also showed that when the Ldlr−/− mice were switched to cholesterol‐containing diets at the time of viral infection, the induction of diabetes resulted in higher serum cholesterol and triglyceride levels and, under these conditions, the altered serum lipids and not the hyperglycemia appeared to be primarily responsible for the increased atherosclerosis in the diabetic mice. This is likely also the case for the STZ‐treated Apoe−/− mice in our study.
Agents that block formation of AGEs or break AGE cross‐links are being developed and tested for their abilities to avert complications in diabetic patients (Monnier 2003; Jandeleit‐Dahm and Cooper 2008). Forbes et al. (2004) showed no effect of aminoguanidine, an inhibitor of AGE formation and the thiazolium derivative, ALT‐711, a putative AGE crosslink breaker, on lesion size in the aortic arch of STZ‐treated Apoe−/− mice maintained on a chow diet when analyzed 20 weeks after induction of diabetes, whereas in a separate study, both agents lessened renal pathology in diabetic Apoe−/− mice (Lassila et al. 2004). Alt‐711 and aminoguanidine did, however, significantly reduce atherosclerosis in the thoracic aorta distal to the aortic arch and in the abdominal aorta (Forbes et al. 2004). The authors propose that, in these regions of the aorta, AGEs may make a major contribution to atherogenesis. In our study, we did not monitor atherosclerosis in the abdominal aorta, but we did quantify lesions by en face analysis in the descending thoracic aorta distal to the aortic arch and saw no difference in lesion area between STZ‐treated GLO1TGApoe−/− and STZ‐treated non‐TG mice. While both Alt‐711 and aminoguanidine lowered AGE immunoreactivity in tissues (Forbes et al. 2004), one cannot unequivocally attribute their protective effects to the reduction in AGEs as aminoguanidine is a known inhibitor of inducible nitric oxide synthase (Tilton et al. 2009) and ALT‐711 markedly attenuated the STZ‐induced increase in plasma cholesterol levels in the Apoe−/− mice (Forbes et al. 2004). It is also possible that nonglyoxal/methylglyoxal‐derived AGEs such as Nε‐carboxymethyllysine (partly formed from glyoxal but mainly by the oxidative degradation of FL), whose formation is inhibited by AGE inhibitors (Forbes et al. 2004) but possibly not by GLO1 could participate in lesion development. More recently, ALT‐711 and another AGE inhibitor, pyridoxamine, were shown to retard the progression of established atherosclerosis in STZ‐treated Apoe−/− mice, not only in the thoracic and abdominal aorta but also in the aortic arch (Watson et al. 2011).
In summary, by manipulating GLO1 activity in Apoe−/− mice, we have demonstrated distinct differences in the diabetes‐induced metabolic changes that result in diabetic nephropathy and diabetic atherosclerosis, respectively. We confirm our previous findings on the essential role for increased MG levels in development of albuminuria and mesangial sclerosis in STZ‐treated mice, (Giacco et al. 2014) but now show that, in the same Apoe−/− mice, increased GLO1 activity in endothelial cells, smooth muscle cells, and macrophages was insufficient to decrease MG glycation of aortal collagen and prevent the initiation and progression of atherosclerosis. Our findings also underline the decisive role for GLO1 activity in preventing hyperglycemia‐induced kidney damage. In the OVE26 mouse model of type 1 diabetes, it was shown that RAGE deficiency reduced glomerulosclerosis, improved renal function and this was accompanied by decreased MG and increased GLO1 expression (Reiniger et al. 2010). It was proposed that hyperglycemia provokes a positive feedback loop in which increased dicarbonyl stress induces RAGE expression which causes a downregulation of GLO1 expression resulting in impaired detoxification of dicarbonyls. This loop can presumably be broken either by disrupting RAGE signaling (Reiniger et al. 2010) or by increasing GLO1 activity (Giacco et al. 2014; and this study) with favorable effects on diabetic kidney disease. In this regard, it has also been reported that the angiotensin type 1 receptor blocker, candesartan, prevents angiotensin II‐induced downregulation of GLO1 and that this may contribute to its ability to protect against diabetic retinopathy (Miller et al. 2010). Thus, while dicarbonyl scavengers and AGE cross‐link breakers have long been considered as promising agents for prevention of diabetic complications, our results suggest that development of agents capable of increasing the activity of the glyoxalase system could be an attractive, alternative strategy to decrease diabetic kidney disease and, potentially, other microvascular complications. This might be achieved by exploiting the transcriptional regulation of GLO1 by Nrf2 (Xue et al. 2008; Rabbani and Thornalley 2012). Sulforaphane, an Nrf2 activator, has been shown to attenuate nephropathy in a mouse model of type 1 diabetes (Zheng et al. 2011). While GLO1 overexpression in vascular endothelial cells, smooth muscle cells, and macrophages failed to prevent accelerated atherogenesis in STZ‐treated Apoe−/− mice, Nrf2 activators may prove to be more effective as the increase in GLO1 expression would be accompanied by a generalized increase in components of the antioxidant defense system.
Limitations of the study
We have reported that the human GLO1 transgene under the control of the murine preproendothelin promoter is expressed in pure populations of both endothelial cells and smooth muscle cells isolated from aortas of GLO1TG mice (Vulesevic et al. 2014). It is possible, however, that in vivo, the preproendothelin promoter shows endothelial cell‐specific expression of transgenes as has been described previously (Harats et al. 1995; Ohashi et al. 1998; Bauer et al. 2005). Although no differences were detected between diabetic and nondiabetic mice in the level of GSH in heart tissue adjacent to the aortic sinus, we cannot exclude that GSH is, nevertheless limiting for GLO1 activity or that the oxidative stress within atherosclerotic lesions locally reduces GSH, dampening GLO1 activity and thus neutralizing the effects of the GLO1 transgene. Likewise, local oxidative stress could elicit a posttranslational modification of GLO1 resulting in its inactivation (Birkenmeier et al. 2010). While we did not see increased atherosclerosis in the Glo1KDApoe−/− mice which had similar serum lipid levels to wild‐type controls at 20 weeks of age, had we looked at older mice, it is possible that we would have seen that a more prolonged exposure to increased dicarbonyl stress in the aorta does result in more advanced atherosclerosis.
Acknowledgments
We thank M. Hasu, L. Wilcox and C. Fournier for excellent technical assistance and C. Kennedy, (Kidney Research Institute, University of Ottawa) for the use of his metabolic cages.
Conflict of Interest
No conflicts of interest, financial or otherwise, are declared by the author(s).
Footnotes
Funding Information
This work was funded by operating grant T6110 from the Heart and Stroke Foundation of Ontario (R.M., S.O.‐B.) and grant 17‐2010‐519 from the Juvenile Diabetes Research Foundation (R.M.). NR and PJT thank the British Heart Foundation (UK) for research funding.
These authors contributed equally to the study.
References
- Ahmed N., Thornalley P. J. 2007. Advanced glycation endproducts: what is their relevance to diabetic complications. Diabetes Obes. Metab.; 9:233-245. [DOI] [PubMed] [Google Scholar]
- Ahmed N., Argirov O. K., Minhas H. S., Cordeiro C. A. A., Thornalley P. J. 2002. Assay of advanced glycation endproducts (AGEs): surveying AGEs by chromatographic assay with derivatization by 6‐aminoquinolyl‐N‐hydroxysuccinimidyl‐carbamate and application to Nε‐carboxymethyl‐lysine‐ and Nε‐(1‐carboxyethyl)lysine‐modified albumin. Biochem. J.; 364:1-14. [DOI] [PMC free article] [PubMed] [Google Scholar]
- Bauer P. M., Yu J., Chen Y., Hickey R., Bernatchez P. N., Looft‐Wilson R. 2005. Endothelial‐specific expression of caveolin‐1 impairs microvascular permeability and angiogenesis. Proc. Natl Acad. Sci. USA; 102:204-209. [DOI] [PMC free article] [PubMed] [Google Scholar]
- Beltramo E., Pomero F., Allione A., D'Alu F., Ponte E., Porta M. 2002. Pericyte adhesion is impaired on extracellular matrix produced by endothelial cells in high hexose concentrations. Diabetologia; 45:416-419. [DOI] [PubMed] [Google Scholar]
- Berner A. K., Brouwers O., Pringle R., Klassen I., Colhoun L., McVicar C. 2012. Protection against methylglyoxal‐derived AGEs by regulation of glyoxalase 1 prevents retinal neuroglial and vasodegenerative pathology. Diabetologia; 55:845-854. [DOI] [PubMed] [Google Scholar]
- Bhatwadekar A. D., Glenn J. V., Li G., Curtis T. M., Gardiner T. A., Stitt A. W. 2008. Advanced glyation of fibronectin impairs vascular repair by endothelial progenitor cells: implications for vasodegeneration in diabetic retinopathy. Invest. Ophthalmol. Vis. Sci.; 49:1232-1241. [DOI] [PubMed] [Google Scholar]
- Bierhaus A., Fleming T., Stoyanov S., Leffler A., Babes A., Neacsu C. 2012. Methylglyoxal modification of Na(v) 1.8 facilitates nociceptive neuron firing and causes hyperalgesia in diabetic neuropathy. Nat. Med.; 18:926-933. [DOI] [PubMed] [Google Scholar]
- Birkenmeier G., Stegemann C., Hoffmann R., Günther R., Huse K., Birkemeyer C. 2010. Posttranslational modification of human glyoxalase 1 indicates redox‐dependent regulation. PLoS ONE; 5:e10399. [DOI] [PMC free article] [PubMed] [Google Scholar]
- Bornfeldt K. E., Tabas I. 2011. Insulin resistance, hyperglycemia, and atherosclerosis. Cell Metab.; 14:575-585. [DOI] [PMC free article] [PubMed] [Google Scholar]
- Brouwers O., Niessen P. M., Haenen G., Miyata T., Brownlee M., Stehouwer C. D. 2010. Hyperglycaemia‐induced impairment of endothelium‐dependent vasorelaxation in rat mesenteric arteries is mediated by intracellular methylglyoxal levels in a pathway dependent on oxidative stress. Diabetologia; 53:989-1000. [DOI] [PMC free article] [PubMed] [Google Scholar]
- Brouwers O., Niessen P. M., Ferreira I., Miyata T., Scheffer P. G., Teerlink T. 2011. Overexpression of glyoxalase‐I reduces hyperglycemia‐induced levels of advanced glycation end products and oxidative stress in diabetic rats. J. Biol. Chem.; 286:1374-1380. [DOI] [PMC free article] [PubMed] [Google Scholar]
- Brownlee M. 2001. Biochemistry and molecular cell biology of diabetic complications. Nature; 414:813-820. [DOI] [PubMed] [Google Scholar]
- Ceradini D. J., Yao D., Grogan R. H., Callaghan M., Edelstein D., Brownlee M. 2008. Decreasing intracellular superoxide corrects defective ischemia‐induced new vessel formation in diabetic mice. J. Biol. Chem.; 283:10930-10938. [DOI] [PMC free article] [PubMed] [Google Scholar]
- Chait A., Bornfeldt K. E. 2009. Diabetes and atherosclerosis: is there a role for hyperglycemia? J. Lipid Res.; 50:S335-S339. [DOI] [PMC free article] [PubMed] [Google Scholar]
- D'Agord Schaan B., Lacchini S., Bertoluci M. C., Irigoyen M. C., Machado U. F., Schmid H. 2001. Increased renal GLUT1 abundance and urinary TGF‐â1 in streptozotocin‐induced diabetic rats: implications for the development of nephropathy complicating diabetes. Horm. Metab. Res.; 33:669. [DOI] [PubMed] [Google Scholar]
- Daugherty A., Whitman S. C. 2003. Quantification of atherosclerosis in mice. Methods Mol. Biol.; 209:203-309. [DOI] [PubMed] [Google Scholar]
- Deng Y. L., Yu P. H. 2004. Assessment of the deamination of aminoacetone, an endogenous substrate for semicarbazide‐sensitive amine oxidase. Anal. Biochem.; 270:97-102. [DOI] [PubMed] [Google Scholar]
- Dobler D., Ahmed N., Song L., Eboigbodin K. E., Thornalley P. J. 2006. Increased dicarbonyl metabolism in endothelial cells in hyperglycemia induces anoikis and impairs angiogenesis by RGD and GFOGER motif modification. Diabetes; 55:1961-1969. [DOI] [PubMed] [Google Scholar]
- Dominguez J. H., Camp K., Maianu L., Feister H., Garvey W. T. 1994. Molecular adaptations of GLUT1 and GLUT2 in renal proximal tubules of diabetic rats. Am. J. Physiol.; 266:F290. [DOI] [PubMed] [Google Scholar]
- El‐Osta A., Brasacchio D., Yao D., Pocai A., Jones P. L., Roeder R. G. 2008. Transient high glucose causes persistent epigenetic changes and altered gene expression during subsequent normoglycemia. J. Exp. Med.; 205:2409-2417. [DOI] [PMC free article] [PubMed] [Google Scholar]
- Forbes J. M., Thallas V., Thomas M. C., Founds H. W., Burns W. C., Jerums G. 2003. The breakdown of pre‐existing advanced glycation end products is associated with reduced renal fibrosis in experimental diabetes. FASEB J.; 17:NIL272-NIL295. [DOI] [PubMed] [Google Scholar]
- Forbes J. M., Yee L. T., Thallas V., Lassila M., Candido R., Jandeleit‐Dahm K. A. 2004. Advanced glycation end product interventions reduce diabetes‐accelerated atherosclerosis. Diabetes; 53:1813-1823. [DOI] [PubMed] [Google Scholar]
- Fu M. X., Requena J. R., Jenkins A. J., Lyons T. J., Baynes J. W., Thorpe S. R. 1996. The advanced glycation end product, Nε‐(carboxymethyl)lysine, is a product of both lipid peroxidation and glycoxidation reactions. J. Biol. Chem.; 271:9982-9986. [DOI] [PubMed] [Google Scholar]
- Genuth S., Sun W., Cleary P., Sell D. R., Dahms W., Malone J. 2005. Glycation and carboxymethyllysine levels in skin collagen predict the risk of future 10‐year progression of diabetic retinopathy and nephropathy in the diabetes control and complications trial and epidemiology of diabetes interventions and complications participants with type 1 diabetes. Diabetes; 54:3103-3111. [DOI] [PMC free article] [PubMed] [Google Scholar]
- Giacco F., Du X., D'Agati V. D., Milne R., Sui G., Geoffrion M. 2014. Knockdown of Glo1 mimics diabetic nephropathy in non‐diabetic mice. Diabetes; 63:291-299. [DOI] [PMC free article] [PubMed] [Google Scholar]
- Goldin A., Beckman J. A., Schmidt A. M., Creager M. A. 2006. Advanced glycation end products: sparking the development of diabetic vascular injury. Circulation; 114:597-605. [DOI] [PubMed] [Google Scholar]
- Guy J., Ogden L., Wadwa R. P., Hamman R. F., Mayer‐Davis E. J., Liese A. D. 2009. Lipid and lipoprotein profiles in youth with and without type 1 diabetes. Diabetes Care; 32:416-420. [DOI] [PMC free article] [PubMed] [Google Scholar]
- Hammes H. P., Alt A., Niwa T., Clausen J. T., Bretzel R. G., Brownlee M. 1999. Differential accumulation of advanced glycation end products in the course of diabetic retinopathy. Diabetologia; 42:728-736. [DOI] [PubMed] [Google Scholar]
- Hanssen N. M., Wouters K., Huijberts M. S., Gijbels M. J., Sluimer J. C., Scheijen L. J. M. 2014. Higher levels of advanced glycation endproducts in human carotid atherosclerotic plaques are associated with a rupture‐prone phenotype. Eur. Heart J.; 35:1137-1146. [DOI] [PubMed] [Google Scholar]
- Harats D., Kurihara H., Belloni P., Oakley H., Ziober A., Ackley D. 1995. Targeting gene expression to the vascular wall in transgenic mice using the murine preproendothelin‐1 promoter. J. Clin. Invest.; 95:1335-1344. [DOI] [PMC free article] [PubMed] [Google Scholar]
- Heizmann C. W. 2007. The mechanism by which dietary AGEs are a risk to human health is via their interaction with RAGE: arguing against the motion. Mol. Nutr. Food Res.; 51:1116-1119. [DOI] [PubMed] [Google Scholar]
- Hsueh W., Abel E. D., Breslow J. L., Maeda N., Davis R. C., Fisher E. A. 2007. Recipes for creating animal models of diabetic cardiovascular disease. Circ. Res.; 100:1415-1427. [DOI] [PubMed] [Google Scholar]
- Ikeda Y., Inagi R., Miyata T., Nagai R., Arai M., Miyashita M. 2012. Glyoxalase 1 retards renal senescence. Am. J. Pathol.; 179:2810-2821. [DOI] [PMC free article] [PubMed] [Google Scholar]
- Jandeleit‐Dahm K., Cooper M. E. 2008. The role of AGEs in cardiovascular disease. Curr. Pharm. Des.; 14:979-986. [DOI] [PubMed] [Google Scholar]
- Januszewski A. S., Alderson N. L., Thorpe S. R., Baynes J. W. 2003. Role of lipids in chemical modification of proteins and development of complications in diabetes. Biochem. Soc. Trans.; 31:1413-1416. [DOI] [PubMed] [Google Scholar]
- Kalapos M. P. 2013. Where does plasma methylglyoxal originate from? Diabetes Res. Clin. Pract.; 99:260-271. [DOI] [PubMed] [Google Scholar]
- Kanter J. E., Johansson F., LeBoeuf R. C., Bornfeldt K. E. 2007. Do glucose and lipids exert independent effects on atherosclerotic lesion initiation or progression to advanced plaques? Circ. Res.; 100:769-781. [DOI] [PubMed] [Google Scholar]
- Karachalias N., Babaei‐Jadidi R., Rabbani N., Thornalley P. J. 2010. Increased protein damage in renal glomeruli, retina, nerve, plasma and urine and its prevention by thiamine and benfotiamine therapy in a rat model of diabetes. Diabetologia; 53:1506-1516. [DOI] [PubMed] [Google Scholar]
- Kilhovd B. K., Giardino I., Torjesen P. A., Birkeland K. I., Berg T. J., Thornalley P. J. 2003. Increased serum levels of the specific AGE‐compound methylglyoxal‐derived hydroimidazolone in patients with type 2 diabetes. Metabolism; 52:163-167. [DOI] [PubMed] [Google Scholar]
- Kurz A., Rabbani N., Walter M., Bonin M., Thornalley P., Auburger G. 2011. Alpha‐synuclein deficiency leads to increased glyoxalase I expression and glycation stress. Cell. Mol. Life Sci.; 68:721-733. [DOI] [PMC free article] [PubMed] [Google Scholar]
- Lassila M., Seah K. K., Allen T. J., Thallas V., Thomas M. C., Candido R. 2004. Accelerated nephropathy in diabetic apolipoprotein E‐knockout mouse: role of advanced glycation end products. J. Am. Soc. Nephrol.; 15:2125-2138. [DOI] [PubMed] [Google Scholar]
- Meerwaldt R., Lutgers H. L., Links T. P., Graaff R., Baynes J. W., Gans R. O. B. 2007. Skin autofluorescence is a strong predictor of cardiac mortality in diabetes. Diabetes Care; 30:107-112. [DOI] [PubMed] [Google Scholar]
- Miller A. G., Tan G., Binger K. J., Pickering R. J., Thomas M. C., Nagaraj R. H. 2010. Candesartan attenuates diabetic retinal vascular pathology by restoring glyoxalase‐I function. Diabetes; 59:3208-3215. [DOI] [PMC free article] [PubMed] [Google Scholar]
- Monnier V. M. 2003. Intervention against the Maillard reaction in vivo. Arch. Biochem. Biophys.; 419:1-15. [DOI] [PubMed] [Google Scholar]
- Myint K. M., Yamamoto Y., Doi T., Kato I., Harashima A., Yonekura H. 2006. RAGE control of diabetic nephropathy in a mouse model: effects of RAGE gene disruption and administration of low‐molecular weight heparin. Diabetes; 55:2510-2522. [DOI] [PubMed] [Google Scholar]
- Nathan D. M., Cleary P. A., Backlund J. Y., Genuth S., Lachin J. M., Orchard T. J. 2005. Intensive diabetes treatment and cardiovascular disease in patients with type 1 diabetes. N. Engl. J. Med.; 353:2643-2653. [DOI] [PMC free article] [PubMed] [Google Scholar]
- Ohashi Y., Kawashima S., Hirata K., Yamashita T., Ishida T., Inoue N. 1998. Hypotension and reduced nitric oxide‐elicited vasorelaxation in transgenic mice overexpressing endothelial nitric oxide synthase. J. Clin. Invest.; 102:2061-2071. [DOI] [PMC free article] [PubMed] [Google Scholar]
- Orasanu G., Plutzky J. 2009. The pathological continuum of diabetic vascular disease. J. Am. Coll. Cardiol.; 53:S35-S42. [DOI] [PMC free article] [PubMed] [Google Scholar]
- Oray B., Norton S. J. 1982. Glyoxalase I from mouse liver. Methods Enzymol.; 90:542-546. [DOI] [PubMed] [Google Scholar]
- Paget C., Lecomte M., Ruggiero D., Wiernsperger N., Lagarde M. 1998. Modification of enzymatic antioxidants in retinal microvascular cells by glucose or advanced glycation end products. Free Radic. Biol. Med.; 25:121-129. [DOI] [PubMed] [Google Scholar]
- Park L., Raman K. G., Lee K. J., Ferran L. J., Chow W. S., Stern D. 1998. Suppression of accelerated diabetic atherosclerosis by the soluble receptor for advanced glycation endproducts. Nat. Med.; 4:1025-1031. [DOI] [PubMed] [Google Scholar]
- Petitti D. B., Imperatore G., Palla S. L., Daniels S. R., Dolan L. M., Kershnar A. K. 2007. Serum lipids and glucose control. The SEARCH for Diabetes in Youth Study. Arch. Pediatr. Adolesc. Med.; 161:159-165. [DOI] [PubMed] [Google Scholar]
- Queisser M. A., Yao D., Geisler S., Hammes H. P., Lochnit G., Schleicher E. D. 2010. Hyperglycemia impairs proteasome function by methylglyoxal. Diabetes; 59:670-678. [DOI] [PMC free article] [PubMed] [Google Scholar]
- Rabbani N., Thornalley P. 2008. Dicarbonyls linked to damage in the powerhouse: glycation of mitochondrial proteins and oxidative stress. Biochem. Soc. Trans.; 36:1045-1050. [DOI] [PMC free article] [PubMed] [Google Scholar]
- Rabbani N., and Thornalley P. J.. 2012. Dicarbonyls (Glyoxal, methylglyoxal, and 3‐deoxyglucosone). Pp. 177–192 in Niwa T., ed. Uremic toxins. Wiley‐Blackwell, Hoboken, NJ. [Google Scholar]
- Rabbani N., Godfrey L., Xue M., Shaheen F., Geoffrion M., Milne R. 2011. Glycation of LDL by methylglyoxal increases arterial atherogenicity. A possible contributor to increased risk of cardiovascular diabetes. Diabetes; 60:1973-1980. [DOI] [PMC free article] [PubMed] [Google Scholar]
- Ramasamy R., Goldberg I. J. 2010. Aldose reductase and cardiovascular diseases, creating human‐like diabetic complications in an experimental model. Circ. Res.; 106:1149-1158. [DOI] [PMC free article] [PubMed] [Google Scholar]
- Ramasamy R., Yan S. F., Schmidt A. M. 2007. Arguing for the motion: yes, RAGE is a receptor for advanced glycation endproducts. Mol. Nutr. Food Res.; 51:1111-1115. [DOI] [PubMed] [Google Scholar]
- Reiniger N., Lau K., McCalla D., Eby B., Cheng B., Lu Y. 2010. Deletion of the receptor for advanced glycation end products reduces glomerulosclerosis and preserves renal function in the diabetic OVE26 mouse. Diabetes; 59:2043-2054. [DOI] [PMC free article] [PubMed] [Google Scholar]
- Renard C., Van Obberghen E. 2006. Role of diabetes in atherosclerotic pathogenesis. What have we learned from animal models? Diabetes Metab.; 32:15-29. [DOI] [PubMed] [Google Scholar]
- Renard C. B., Kramer F., Johansson F., Lamharzi N., Tannock L. R., von Herrath M. G. 2006. Diabetes and diabetes‐associated lipid abnormalities have distinct effects on initiation and progression of atherosclerotic lesions. J. Clin. Invest.; 114:659-668. [DOI] [PMC free article] [PubMed] [Google Scholar]
- Schaan B. D., Irigoyen M. C., Bertoluci M. C., Lima N. G., Passaglia J., Hermes E. 2005. Increased urinary TGF‐â1 and cortical renal GLUT1 and GLUT2 levels: additive effects of hypertension and diabetes. Nephron Physiol.; 100:50. [DOI] [PubMed] [Google Scholar]
- Singh R., Barden A., Mori T., Beilin L. 2001. Advanced glycation end‐products: a review. Diabetologia; 44:129-146. [DOI] [PubMed] [Google Scholar]
- Soro‐Paavonen A., Watson A. M. D., Li J., Paavonen K., Koitka A., Calkin A. C. 2008. RAGE deficiency attenuates the development of atherosclerosis in diabetes. Diabetes; 57:2461-2469. [DOI] [PMC free article] [PubMed] [Google Scholar]
- Sugimoto K., Nishizawa Y., Horiuchi S., Yagihashi S. 1997. Localization in human diabetic peripheral nerve of Nε‐carboxylmethyllysine‐protein adducts, an advanced glycation endproduct. Diabetologia; 40:1380-1387. [DOI] [PubMed] [Google Scholar]
- Takahashi M., Lu Y., Myint T., Fujii J., Wada Y., Taniguchi N. 1995. In vivo glycation of aldehyde reductase, a major 3‐deoxyglucosone reducing enzyme: identification of glycation sites. Biochemistry; 34:1433-1438. [DOI] [PubMed] [Google Scholar]
- Thangarajah H., Yao D., Chang E., Shi Y., Jazayeri L., Vial I. N. 2009. The molecular basis for impaired hypoxia‐induced VEGF expression in diabetic tissues. Proc. Natl Acad. Sci. USA; 106:13505-13510. [DOI] [PMC free article] [PubMed] [Google Scholar]
- The DCCT Research Group. 1992. Lipid and lipoprotein levels in patients with IDDM. Diabetes Control and Complication trial experience. Diabetes Care; 15:886-894. [DOI] [PubMed] [Google Scholar]
- The Diabetes Control and Complications Trial Research Group. 1993. The effect of intensive treatment of diabetes on the development and progression of long‐term complications in insulin‐dependent diabetes mellitus. N. Engl. J. Med.; 329:977-986. [DOI] [PubMed] [Google Scholar]
- The Diabetes Control and Complications Trial Research Group. 1995. Effect of intensive diabetes management on macrovascular events and risk factors in the Diabetes Control and Complications Trial. Am. J. Cardiol.; 75:894-903. [DOI] [PubMed] [Google Scholar]
- Thornalley P. J. 1993. The glyoxalase system in health and disease. Mol. Aspects Med.; 14:287-371. [DOI] [PubMed] [Google Scholar]
- Thornalley P. J. 1998. Glutathione‐dependent detoxification of α‐oxoaldehydes by the glyoxalase system: involvement in disease mechanisms and antiproliferative activity of glyoxalase I inhibitors. Chem. Biol. Interact.; 111–112:137-151. [DOI] [PubMed] [Google Scholar]
- Thornalley P. J. 2003. Glyoxalase I – structure, function and a critical role in the enzymatic defence against glycation. Biochem. Soc. Trans.; 31:1343-1348. [DOI] [PubMed] [Google Scholar]
- Thornalley P. J., Battah S., Ahmed N., Karachalias N., Agalou S., Babaei‐Jadidi R. 2003. Quantitative screening of advanced glycation endproducts in cellular and extracellular proteins by tandem mass spectrometry. Biochem. J.; 375:581-592. [DOI] [PMC free article] [PubMed] [Google Scholar]
- Tilton R. G., Chang K., Hasan K. S., Smith S. R., Petrash J. M., Misko T. P. 2009. Prevention of diabetic vascular dysfunction by guanidines. Inhibition of nitric oxide synthase versus advanced glycation end‐product formation. Diabetes; 42:221-232. [DOI] [PubMed] [Google Scholar]
- Toth C., Rong L. L., Yang C., Martinez J., Song F., Ramji N. 2008. RAGE and experimental diabetic neuropathy. Diabetes; 57:1002-1017. [DOI] [PubMed] [Google Scholar]
- Turk Z. 2010. Glycotoxins, carbonyl stress and relevance to diabetes and its complications. Physiol. Res.; 59:147-156. [DOI] [PubMed] [Google Scholar]
- Ulrich P., Cerami A. 2001. Protein glycation, diabetes and aging. Recent Prog. Horm. Res.; 56:1-21. [DOI] [PubMed] [Google Scholar]
- Vasan S., Foiles P., Founds H. 2003. Therapeutic potential of breakers of advanced glycation end product‐protein crosslinks. Arch. Biochem. Biophys.; 419:89-96. [DOI] [PubMed] [Google Scholar]
- Vlassara H., Palace M. R. 2002. Diabetes and advanced glycation endproducts. J. Inter. Med.; 251:87-101. [DOI] [PubMed] [Google Scholar]
- Vulesevic B., McNeill B., Geoffrion M., Kuraitis D., McBain J. E., Lochhead M. 2014. Glyoxalase‐1 over‐expression in bone marrow cells reverses defective neovascularization in STZ‐induced diabetic mice. Cardiovasc. Res.; 101:306-316. [DOI] [PubMed] [Google Scholar]
- Wang H., Liu J., Wu L. 2009. Methylglyoxal‐induced mitochondrial dysfunction in vascular smooth muscle cells. Biochem. Pharmacol.; 77:1709-1716. [DOI] [PubMed] [Google Scholar]
- Watson A. M. D., Soro‐Paavonen A., Sheehy K., Li J., Calkin A. C., Koitka A. 2011. Delayed intervention with AGE inhibitors attenuates the progression of diabetes‐accelerated atherosclerosis in diabetic apolipoprotein E knockout mice. Diabetologia; 54:681-689. [DOI] [PubMed] [Google Scholar]
- Wolffenbuttel B. H., Boulanger C. M., Crijns F. R., Huijberts M. S., Poitevin P., Swennen G. N. 1998. Breakers of advanced glycation end products restore large artery properties in experimental diabetes. Proc. Natl Acad. Sci. USA; 95:4630-4634. [DOI] [PMC free article] [PubMed] [Google Scholar]
- Wu L., Juurlink B. H. J. 2002. Increased methylglyoxal and oxidative stress in hypertensive rat vascular smooth muscle cells. Hypertension; 39:809-814. [DOI] [PubMed] [Google Scholar]
- Xue M., Quan Q., Adaikalakoteswari A., Rabbani N., Roya B. J., Thornalley P. 2008. Activation of NF‐E2‐related factor‐2 reverses biochemical dysfunction of endothelial cells induced by hyperglycemia linked to vascular disease. Diabetes; 57:2809-2817. [DOI] [PMC free article] [PubMed] [Google Scholar]
- Yan S. F., Ramasamy R., Naka Y., Schmidt A. M. 2003. Glycation, inflammation, and RAGE. A scaffold for the macrovascular complications of diabetes and beyond. Circ. Res.; 93:1159-1169. [DOI] [PubMed] [Google Scholar]
- Yao D., Brownlee M. 2009. Hyperglycemia‐induced reactive oxygen species increase expression of RAGE and RAGE ligands. Diabetes; 59:249-255. [DOI] [PMC free article] [PubMed] [Google Scholar]
- Yao D., Taguchi T., Matsumura T., Pestell R., Edelstein D., Giardino I. 2007. High glucose increases angiopoietin‐2 transcription in microvascular endothelial cells through methylglyoxal modification of mSin3A. J. Biol. Chem.; 282:31038-31045. [DOI] [PubMed] [Google Scholar]
- Zheng H., Whitman S. A., Wu W., Wondrak G. T., Wong P. K., Fang D. 2011. Therapeutic potential of Nrf2 activators in streptozotocin‐induced diabetic nephropathy. Diabetes; 60:3055-3066. [DOI] [PMC free article] [PubMed] [Google Scholar]