

Abstract
Background
Previous research has associated abnormalities in frontal lobe functioning with alcohol relapse. In this study, we used diffusion tensor imaging to investigate whether frontal white matter integrity measured at the start of treatment differs between persons with alcohol use disorders (AUD) who sustain treatment gains and those who return to heavy use after treatment.
Methods
Forty-five treatment-seeking AUD inpatients and 30 healthy control subjects were included in the study. Six months after completing treatment, 16 of the AUD participants had resumed heavy use (RHU) and 29 others remained abstinent or drank minimally (treatment sustainers [TS]). Voxel-wise group comparisons (TS vs. RHU) were performed on fractional anisotropy (FA), radial diffusivity (RD), and axial diffusivity maps generated from each subject’s diffusion tensor imaging scan at the start of treatment.
Results
We found significantly lower FA and significantly higher RD in the frontal lobes of the RHU group, relative to the TS group. The RHU group data are consistent with previous reports of abnormal frontal white matter tract abnormalities in persons with AUD.
Conclusions
It is possible that the lower FA and higher RD in the RHU group reflect microstructural injury to frontal circuitries, and these may underlie the reduced cognitive control amid heightened reward sensitivity associated with resumption of heavy drinking.
Keywords: Alcohol, diffusion tensor imaging, frontal lobe, relapse, TBSS, white matter
Alcohol use disorder (AUD) is characterized by continued use despite significant health and/or social consequences (1). This feature is emphasized by the high rates of posttreatment relapse such that over 50% of individuals treated for AUD resume drinking at harmful levels within 1 year (2,3). With such high rates of resumption of use and in an effort to develop more targeted treatments, it is important to investigate the constellation of factors that contribute toward relapse. Psychosocial factors, such as stressful life events, personal coping strategies, degree of craving, mood state, and cognitive appraisals of alcohol expectancies, are understood to affect treatment outcomes (4–6). Additionally, neurocognitive factors, such as inhibition, working memory, decision making, and overall cognitive impairment, have been associated with posttreatment outcomes (7–12).
The degree to which neural system factors relate to AUD treatment gains has also been investigated and has helped to implicate certain biomarkers that relate to better or worse treatment outcomes. Identification of biomarkers that are associated with treatment gains is vital toward developing targeted treatment agents, whether psychopharmacologic or psychosocial, and toward matching individuals to the treatment that may best assist them in recovery (13). Within this context, an intriguing picture is beginning to evolve that closely follows current neurobiological models of addiction. Such models are characterized by modifications in reward circuitry such that an increase in reward saliency of substance-related cues and behaviors is often coupled with a decrease in cognitive control governed by the prefrontal lobes (13–18). Indeed, abnormal frontal lobe structures and frontal-related neuropsychological dysfunction are well documented in persons with long-term AUD (19–27). Moreover, these control and reward networks are thought to be the primary targets for current AUD treatments (13).
Consistent with this framework, neurobiological evidence from imaging and electroencephalogram studies suggests a disruption of the frontal circuitry of persons with AUDs who resume heavy drinking relative to those who maintain abstinence. For instance, reduced baseline frontal cerebral blood flow (11) and abnormal electroencephalogram signals from the frontal lobes (28,29) have been associated with relapse. In addition, lower baseline metabolite levels have been reported in the frontal and temporal lobe regions involved in reward circuitry in treatment-seeking persons with AUD (30,31). Brain volumetric measures of the amygdala and frontal cortex have also been shown to be predictive of relapse and craving (32–35). Additionally, greater activation of the striatum, anterior cingulate gyrus, and medial prefrontal cortex in response to visual alcohol cues (36) and thalamic and striatal activation in response to affectively positive stimuli (37) were found to be related to subsequent alcohol relapse.
This study seeks to increase our understanding of the neurobiological factors associated with the resumption of heavy drinking by examining microstructural integrity of cerebral white matter, a consequential neural system component not fully investigated in previous studies predicting alcohol relapse using diffusion tensor imaging (DTI), a neuroimaging method used to investigate white matter structural integrity (38). Diffusion tensor imaging is sensitive to the random motion of water molecules within white matter and yields measures such as fractional anisotropy (FA) that describe intravoxel directional coherence of water molecules and provides an index of white matter structural integrity (39,40). Within substance abuse research, reductions in FA have been associated with the diagnosis of AUD, duration of alcohol abuse, and cognitive performance (41–48).
In addition to FA, measures such as axial diffusivity (AD) and radial diffusivity (RD) can also be used to describe white matter integrity. Axial diffusivity refers to the amount of diffusion along the primary direction of diffusion and has been interpreted as describing axonal integrity (49,50). Radial diffusivity refers to the average diffusion along the two axes orthogonal to the primary diffusion direction and has been interpreted as a measure of myelin integrity (49,50). Both AD and RD have been shown to differ between persons with AUD and healthy control subjects (46,48).
The primary aim of this study was to determine whether frontal white matter integrity measured at baseline differed between those who resumed heavy drinking after treatment and those who maintained treatment gains. It was hypothesized that the baseline frontal FA of persons with AUD who go on to resume heavy drinking would be significantly lower than the baseline FA of those who maintained treatment gains at 6 months. A voxelwise analysis using Tract-Based Spatial Statistics (TBSS) was chosen since this method allowed for accurate white matter integrity comparison across subjects (51). In addition, within regions of significantly reduced FA, we anticipated finding higher RD and lower AD in the heavy use group, suggesting myelin and neuronal compromise, respectively. Finally, we investigated whether pretreatment alcohol use characteristics are related to DTI metrics with the expectation that greater drinking severity would be related to lower FA, higher RD, and lower AD.
Methods and Materials
Participants
Institutional Review Board approval for this study was obtained from the University of California, San Diego and Veterans Affairs San Diego Healthcare System (VASDHS). Participants in this study included 45 recently detoxified persons with AUD undergoing inpatient treatment for AUD at the VASDHS Alcohol and Drug Treatment Program and 30 non-AUD control subjects. The treatment program is based on a cognitive-behavioral/relapse prevention approach through both group and individual therapy and consists of 4 weeks of inpatient treatment followed by 8 weeks of outpatient treatment. AUD participants met DSM-IV (1) criteria for alcohol dependence based on a Structured Clinical Interview for the DSM-IV administered by trained research psychiatrists at the VAS-DHS Alcohol Research Center. Furthermore, to be included in this study, AUD participants must have consumed at least the equivalent of 560 g of pure ethanol each week for the most recent 5 years (52). Alcohol use disorder participants were approached after their treatment intake and were provided details regarding the purpose of the study and compensation amount. The control participants were recruited from advertisements in the local community and based on structured interview had never met DSM-IV criteria for AUD or any other DSM-IV Axis I disorder.
Exclusionary criteria included a DSM-IV diagnosis of (nonalcohol) substance abuse disorder in the preceding 5 years; a history of a diagnosed neurologic disorder unrelated to AUD, lifetime history of head injury with loss of consciousness exceeding 15 minutes, and current or past diagnosis of a major medical disorder that may interfere with cognitive functioning, including cirrhosis of the liver, cerebrovascular disease, chronic obstructive pulmonary disease, insulin dependent diabetes mellitus, and collagen-vascular disease; and hospitalization for a psychiatric condition that preceded the onset of the AUD.
All subjects who met study inclusion criteria underwent a structured interview to gather information on participants’ drug use history, history of mild head trauma, smoking status, family history of AUD, and estimated lifetime history of alcohol consumption via timeline followback (53,54). An alcoholic beverage was considered to have approximately 12.5 g of pure ethanol and was equivalent to 1) one 12-ounce can of beer, 2) 4 ounces of wine, or 3) 1.5 ounces of distilled spirits. During the standard course of inpatient treatment, regular monitoring of blood and urine for the presence of alcohol was performed to assure sobriety before the magnetic resonance imaging (MRI). Participants were also administered the Beck Depression Inventory (55). Family density of AUD was calculated by assigning loadings (.5 for parents and .25 for grandparents) to those relatives with AUD, as reported by the participant, resulting in a range of values from 0 to 2 for each participant, indicating low to high density (56). Alcohol use disorder participants received MRI scanning while in inpatient treatment and were scanned after a minimum of 2 weeks sobriety to minimize the effects of acute detoxification.
Classification of Return to Heavy Use
Participants or collaterals (e.g., spouses or other family members) were contacted by telephone 6 months after the initial scan to determine current drinking status as part of a larger longitudinal study. The focus was to identify those subjects that resumed heavy drinking at or near pretreatment levels and not a temporary slip. Thus, participants or collaterals were asked if the participant drank more than three drinks per day for 1 month within the past 6 months. Sixteen of the AUD participants reported resuming drinking at or near pretreatment levels consistent with the above definition and were classified as returned to heavy use (RHU). Twenty-one AUD participants reported no alcohol intake during this time. Eight other AUD participants reportedly had consumed some alcohol within 6 months but for brief and isolated periods, much less than the >3 drinks per day for at least 1 month threshold. These 8 plus the 21 total abstainers constituted the group of treatment sustainers (TS). Ten of the initially enrolled participants were unable to be contacted at this or other follow-up time points and these subjects were removed from the subsequent analyses.
As presented in Table 1, all groups were similar in age (range: 31–64), education, race and ethnicity, gender, and family density of AUD (56). At the time of the scan, the RHU and TS groups did not significantly differ in most estimated alcohol use characteristics, except for drinking quantities over the past 30 days, where the RHU group had higher levels of average number of drinks per drinking day. Days abstinent before the scan, number of times seeking treatment for AUD, Beck Depression Inventory scores, frequency of past drug abuse, and current smoking status did not significantly differ between AUD groups.
Table 1.
Characteristics of AUD Participants and Control Subjects
| Characteristic | Treatment Sustainers (n = 29) | Return to Heavy Use (n = 16) | Control Subjects (n = 30) | Test Value | p Value |
|---|---|---|---|---|---|
| Sociodemographics | |||||
| Age | 48 ± 6.9 | 48 ± 9.8 | 48.5 ± 10.0 | F = .04 | .96 |
| Education, years | 12.9 ± 2.4 | 12.7 ± 1.7 | 14 ± 2.3 | F = 2.71 | .07 |
| Race/ethnicity, number of participants | |||||
| White | 27 (93%) | 14 (88%) | 26 (87%) | χ2 = 8.00 | .24 |
| African American | 2 (7%) | 0 | 0 | ||
| Hispanic | 0 | 2 (12%) | 3 (10%) | ||
| Other | 0 | 0 | 1 (3%) | ||
| Gender, number of male subjects | 28 (97%) | 16 (100%) | 29 (97%) | χ2 = .56 | .76 |
| Alcohol Use History | |||||
| Number years of AUD | 24.3 ± 8.5 | 22.0 ± 11.9 | — | t = .75 | .46 |
| Number drinks lifetime | 102252 ± 43961 | 107268 ± 57632 | 8505 ± 12577 | F = 54.6 | <.001 |
| 30 days before treatment: | |||||
| Number of drinking days | 30 (0) | 30 (1.0) | 7 (12) | F = 85.6 | <.001 |
| Average number drinks/drinking daya | 16 ± 5 | 21 ± 10 | 1.3 ± 1.3 | F = 86.3 | <.001 |
| Past year before treatment: | |||||
| Number of drinking days | 357 (35) | 361 (17) | 87 (141) | F = 85.5 | <.001 |
| Average number drinks/drinking day | 8 (6) | 10 (7) | 1 (1) | F = 17.8 | <.001 |
| Days since last drink | 24.3 ± 9.8 | 23.2 ± 6.0 | 37 ± 42 | F = 1.9 | .16 |
| Number with Past Drug Abuse | 8 (28%) | 2 (13%) | — | χ2 = 1.4 | .29 |
| Number Times in Alcohol Treatment | 2.24 ± 1.7 | 2.25 ± 1.9 | — | t = .02 | .99 |
| BDI Score | 8.28 ± 7.1 | 11.13 ± 7.7 | 3.27 ± 1.9 | F = 9.68 | <.001 |
| Number Current Smokers | 21 (69%) | 15 (88%) | 3 (6.7%) | χ2 = 35.6 | <.002 |
| Family Density of AUD | .31 ± .34 | .36 ± .38 | .23 ± .30 | F = .92 | .40 |
Values indicate mean ± standard deviation or percentage of group as indicated. AUD, alcohol use disorder; BDI, Beck Depression Inventory.
AUD groups differ, p < .05.
Diffusion Tensor Imaging Protocol
Diffusion tensor imaging data were obtained via a General Electric (Fairfield, Connecticut) Echospeed LX 1.5T scanner located at the VASDHS using a single-shot, stimulated-echo sequence with spiral acquisition (echo time = 100 msec, repetition time = 6000 msec, slice thickness = 3.8 mm, field of view = 240 mm, and in-plane resolution of 3.75 × 3.75mm). Diffusion data were acquired in 42 directions, with a b-value of 1745 sec/mm2. A single nondiffusion weighted (b = 0) image was also acquired. For each direction and b-value, four identical acquisitions were performed and averaged to produce the images.
Image Processing
Image processing was conducted using tools from the Functional Magnetic Resonance Imaging of the Brain Software Library (FSL; Oxford, United Kingdom) (57) (http://www.fmrib.ox.ac.uk/fsl). Each volume was inspected for quality during each image processing stage and five subjects were excluded due to poor image quality owing to motion or other artifact. These five subjects were identified and removed before the determination of relapse status and are not included in Table 1. For each remaining subject, minor motion and eddy current artifacts were corrected using FSL EDDY_CORRECT. A brain mask of the nondiffusion weighted image was created using FSL’s Brain Extraction Tool (58), which served to restrict tensor calculation to the parenchyma. Data were fitted to the diffusion tensor model (40), and the eigenvectors, associated eigenvalues (λ1 > λ2 > λ3), and FA were computed using FSL DTIFIT. Axial diffusivity was defined as the amount of diffusion corresponding to the principal diffusion direction (AD = λ1). Radial diffusivity was defined as the average of the two eigenvalues orthogonal to the principal diffusion direction [RD = (λ2 + λ3)/2].
DTI Data Analyses
Tract-Based Spatial Statistics version 1.2 (51) was used to perform the between-group FA comparison. First, each subject’s FA data were aligned to a template using a nonlinear registration algorithm (FSL FNIRT) and then affine-transformed to the Montreal Neurological Institute 152 template and upsampled to 1 × 1 × 1 mm3. Next, a mean FA image was generated from the transformed images. The mean FA image was then thinned to create a mean FA skeleton that characterizes the centers of all fiber tracts common to all subjects. An FA threshold of .2 was applied to the mean skeleton to maintain strong tract correspondence across subjects by omitting voxels that are primarily gray matter or cerebrospinal fluid. To account for imperfect between-subject registration, the thresholded skeleton was superimposed onto each subject’s FA image, and a spatial search algorithm was used to map local maximum FA value onto each skeleton voxel. The transformations and search criteria derived from each FA map were then applied to both the AD and RD maps for each subject. This method produced 75 aligned FA, AD, and RD skeletons with voxel values unique to each participant.
Voxelwise between-subject statistics for the entire white matter skeleton were calculated using FSL’s Randomise program version 2.1 (http://www.fmrib.ox.ac.uk/fsl/randomise/index.html), a non-parametric, permutation-based statistical program appropriate for the nonnormal distribution of FA data (51,59). Threshold-free cluster enhancement (60) was used to correct for multiple comparisons.
Voxels comprising any significant clusters were then deprojected from their position on the skeleton back to each subject’s native diffusion space by reversing the skeletonization process via the TBSS_DEPROJECT command. This step was done to verify voxel-tract coherence in native space. Finally, FA, AD, and RD values were extracted from these cluster voxels within each subject to be used for further analysis.
Results
TBSS Analyses
The results of voxelwise analysis of FA between RHU and TS groups are presented in Figure 1. This comparison revealed that the RHU group had significantly lower FA than the TS group throughout the frontal lobes bilaterally (mean t = 2.08, mean p = .046) and nowhere else within the cerebral white matter. Identification of tracts included in the significant cluster was guided by two atlases available in FSL (ICBM-DTI-81 white matter labels atlas and the JHU white-matter tractography atlas). The cluster included voxels corresponding to the bilateral forceps minor, the genu and anterior body of the corpus callosum, the bilateral uncinate fasciculi, the right superior corona radiata, and the left anterior internal capsule. There were no regions where FA was greater in the RHU group relative to the TS group. Additionally, using the methods described above, a voxelwise analysis of RD and AD failed to reveal significant group differences. When participants were grouped as any drinking versus alcohol abstinence, no significant group differences were found (p > .05).
Figure 1.
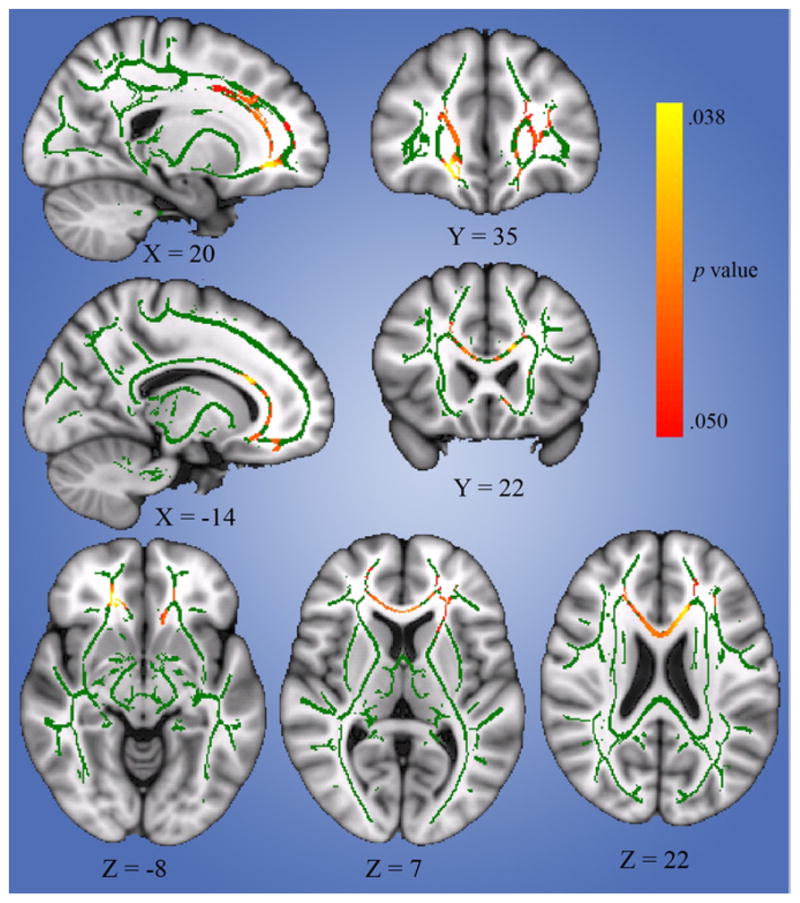
Results of Tract-Based Spatial Statistics analysis (overlaid on Montreal Neurological Institute 152 image) depicting tract regions that differ significantly between those with alcohol use disorder who resumed heavy use within 6 months of treatment and those who maintained treatment gains. Note that affected regions include bilateral forceps minor, the genu and anterior body of the corpus callosum, the bilateral uncinate fasciculi, the right superior corona radiata, and the left anterior internal capsule.
Within-Cluster Analysis
Figure 2 summarizes the results of the within-cluster comparisons of the extracted FA, RD, and AD values between RHU, TS, and non-AUD control subjects. This analysis was performed to investigate the relative contributions of RD and AD toward the observed FA difference. Control subjects were included in this analysis to demonstrate the direction of the differences relative to normative expectations. Consistent with the voxelwise results, there were significant omnibus group differences in FA, F (2,72) = 6.38, p = .003, η2 =.15. Post hoc pairwise comparisons with Bonferroni correction (corrected α = .0167) found that the RHU group significantly differed from control subjects, t (72) = 3.09, p = .003, Cohen’s d = .89, while the TS group did not, t (72) =.36, p =.718, d =.09. The finding of lower FA in the RHU group compared with the TS group was corroborated, t (72) =3.37, p =.001, d =.98, and remained after controlling for average number of drinks per drinking day in the past 30 days (analysis of covariance), t (71) =2.92, p =.005, d (adjusted means) =.86.
Figure 2.
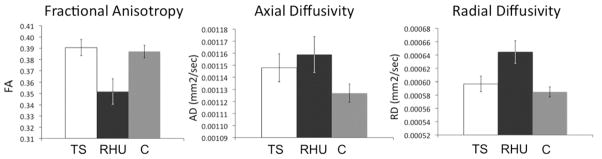
Within-cluster analysis results. Comparison of baseline mean fractional anisotropy, axial diffusivity, and radial diffusivity among the treatment sustainer, return to heavy use, and healthy control groups (note: error bars represent SEM). AD, axial diffusivity; C, healthy control; FA, fractional anisotropy; RD, radial diffusivity; RHU, return to heavy use; TS, treatment sustainer.
Radial diffusivity values differed significantly between groups, F (2,72) =6.09, p =.004, η2 =.14. Bonferroni corrected pairwise comparisons found that the RHU group had significantly higher RD than and control subjects, t (72) = 3.43, p = .001, d = .99, while RD did not differ significantly between TS and control subjects, t (72) = .86, p = .40, d = .20. The RHU group had higher RD than the TS group, t (72) = 2.73, p = .008, d = .80, a finding that was somewhat attenuated after controlling for average drinks per drinking day in the past 30 days, t (71) = 2.21, p = .03, d (adjusted means) = .64. Axial diffusivity values did not differ significantly between groups, F (2,72) = 2.05, p = .14, η2 = .05.
Correlations with Alcohol Use Variables
Correlation analyses of the mean FA, RD, and AD values extracted from the significant cluster and alcohol use variables were conducted within and across AUD subgroups. Lifetime number of drinks and years of AUD did not correlate with DTI metrics in partial correlation controlling for age (p > .05). In addition, drinking histories in the past 30 days before treatment and in the past year did not significantly correlate with DTI values (p > .05). Interestingly, days since last drink correlated with both FA (r = .397, p = .036) and RD (r = −.388, p = .041) in the TS group, whereas such relationships were not found in the RHU group (FA: r = −.077, p = .793; RD: r = −.109, p = .710). However, these correlations account for 2 of 15 correlations tested and are thus subject to inflated type I error.
Discussion
To our knowledge, this is the first study to explore baseline white matter integrity in drug or alcohol addiction resumption of heavy use using DTI. The results support our hypothesis of lower frontal white matter integrity in those who resume heavy drinking relative to those who maintain treatment gains. Importantly, this group difference persisted even after accounting for the baseline differences in recent drinking severity. The observation of higher radial diffusivity in the RHU group relative to the TS group may suggest demyelination (50), though this interpretation remains controversial (61). The results comport with other findings that suggest a disruption of frontal circuitry in those treatment-seeking persons with AUD who resume heavy drinking (11,28–34).
Frontal lobe damage can result in disinhibition wherein behavior may be overly influenced by immediate reward saliency and prepotent response tendencies (62,63). Indeed, prefrontal cortical deficits during cognitive control tasks have been demonstrated in patients with AUD (64) and reductions in rostral callosal white matter integrity have been associated with heightened impulsivity and reduced cognitive control in persons with stimulant addiction (65,66). Moreover, the cluster includes white matter tracts that abut the right ventromedial frontal cortex (yellow-range voxels in Figure 1), a region associated with decision-making impairments (67,68). Thus, the affected white matter structures interconnect brain regions integral to inhibitory control and decision making, both critical deficits associated with addiction that may have a profound effect on one’s ability to discontinue use (13,16,17).
Addiction is thought to involve modifications of reward circuitry in consequence to the reinforcing attributes of the substance of abuse. Thus, there is a potentiation of conditioned rewards (e.g., alcohol-associated cues) mediated by limbic connections among the ventral tegmental area, the nucleus accumbens, and the amygdala, with simultaneous dysregulation of frontal circuits involved in outcome appraisal, response inhibition, and cognitive control, which contribute to continued substance use despite unfavorable health and social outcomes (13–18). The observed difference in frontal white matter integrity may be a consequence of the described neuroadaptive modifications in reward circuitry. More intriguing, the relative reduction in white matter integrity in the relapse group may indicate alcohol-related damage to the frontal white matter, as has been described in numerous reports, both in vivo using MRI methods and postmortem (23,27,69). The potentially compromised cognitive control induced by the degraded frontal white matter integrity, coupled with the increased reward saliency of alcohol-associated cues and behaviors, may make maintaining treatment gains all the more difficult for those treatment-seeking persons with AUD with compromised frontal white matter.
The correlations between the white matter integrity and length of sobriety in the TS group should be interpreted with caution due to multiple comparisons. However, they suggest that, within a relatively short time frame (i.e., mean duration of abstinence of 24 days), the frontal white matter within the TS group may experience a recovery with abstinence, or minimal use, while the RHU group may not. Such a correlation between white matter integrity and duration of alcohol abstinence in adults with AUD has been previously reported (43), though this does not fully explain the lack of this association in the RHU group.
Our finding that cluster DTI values differed between the RHU group and control subjects but not between treatment sustainers and control subjects, despite similar lifetime and recent drinking histories, corresponds with other findings of normal baseline brain measures in AUD patients who go on to maintain abstinence (31,32). Thus, as most alcohol use variables in the current study do not appear to be related to the white matter measures, it is possible that factors beyond alcohol use may contribute to the observed white matter integrity difference between AUD groups. Genetic predispositions that have been associated with both AUD recovery (70) and pre-AUD brain structure of persons at high risk of AUD (71) may have contributed to the findings. The AUD subgroups do not differ with respect to their family history of AUD, though other genetic factors were not investigated and may help to explain this disparity. Nonetheless, findings such as these reaffirm the multifactorial nature of the development and maintenance of AUD.
In terms of treatment implications, our findings suggest that those with compromised frontal white matter integrity may struggle to sustain treatment gains following this particular treatment model, whereas persons with more robust frontal white matter may continue to see treatment gains some 6 months after the start of treatment. Biomarkers of this kind, as well as other relevant information, may be used to identify the treatment options most appropriate for each patient in the ongoing effort toward individualized care (13).
Several limitations of the present study should be noted. The classification of relapse remains controversial, and there are several criteria by which one may designate relapse, which is, in part, why the phrase “resumers of heavy use” was chosen. The method used in this study was designed to identify those subjects who resumed drinking at substantial levels, defined as more than three drinks per day for at least 1 month during the 6-month follow-up. However, since our criteria were specific to this study, comparison with other studies of resumption of use at hazardous levels is made more difficult. In the future, it would be desirable to employ standardized criteria, such as those of Project Matching Alcoholism Treatments to Client Heterogeneity (MATCH) (72). In practical terms, however, our criteria probably are not too dissimilar from those such as from Project MATCH. For example, MATCH defines relapse as daily consumption for 3 or more days exceeding six drinks (men) or four or more drinks (women). Conceptually, both criterion sets identify those that resume drinking at a substantial level.
We did not account fully for some factors known to affect alcohol relapse, such as environmental context and degree of craving (4–6). While factors such as the severity of the AUD and the number of prior times in treatment may be related to treatment outcome, these factors did not differ between AUD subgroups in the current study. Due to the limited recruitment of female subjects, possible gender differences in relapse susceptibility were not explored, and the current findings may not generalize beyond male subjects. In addition, this study would have been strengthened by including alcohol use data from other time points, including a more detailed account of use at the follow-up interview, as opposed to the binary designation of heavy use versus limited use. Future studies of this kind may collect alcohol use data across multiple time points, including at treatment intake, at the termination of treatment, and at the follow-up periods specific to the study. The interpretation that RD may correspond to myelin integrity in cerebral white matter has been questioned (61), as this interpretation was initially based on extra-cerebral white matter (50). Further research in this area is needed to determine to what extent RD relates to such neurostructural properties. Diffusion tensor imaging also carries limitations, such as failure of the tensor model to account for crossing fibers (73,74).
In summary, the results indicate that AUD participants who resume heavy drinking after achieving abstinence in the course of treatment had significantly lower frontal white matter integrity than the treatment-sustaining group in regions associated with decision making, impulse control, and executive functioning. Such a pattern of suboptimal microstructural frontal integrity coincides with current neurobiological models of addiction processes that emphasize reduced frontal lobe mediated cognitive control and heightened reward sensitivity in addiction and it may represent a biomarker that indicates the need for a particular treatment.
Acknowledgments
This project was made possible by a grant from the Veterans Affairs Medical Research Service awarded to Dr. Igor Grant, M.D., and was further supported by grants awarded to Dr. Lawrence Frank, Ph.D., from the National Institutes of Health (5 R01 MH64729 – 05 and 5 R01 MH075870 – 02).
We gratefully acknowledge June Allen and Lindsay M. Squeglia for their invaluable assistance throughout the course of this project.
Footnotes
All authors reported no biomedical financial interests or potential conflicts of interest.
References
- 1.American Psychiatric Association. Diagnostic and Statistical Manual of Mental Disorders. 4. Washington, DC: American Psychiatric Association; 2000. (Text Revision) [Google Scholar]
- 2.Miller WR, Walters ST, Bennett ME. ; How effective is alcoholism treatment in the United States? J Stud Alcohol. 2001;62:211–220. doi: 10.15288/jsa.2001.62.211. [DOI] [PubMed] [Google Scholar]
- 3.Monahan SC, Finney JW. ; Explaining abstinence rates following treatment for alcohol abuse: A quantitative synthesis of patient, research design and treatment effects. Addiction. 1996;91:787–805. doi: 10.1046/j.1360-0443.1996.9167876.x. [DOI] [PubMed] [Google Scholar]
- 4.Brown SA, Vik PW, Patterson TL, Grant I, Schuckit MA. ; Stress, vulnerability and adult alcohol relapse. J Stud Alcohol. 1995;56:538–545. doi: 10.15288/jsa.1995.56.538. [DOI] [PubMed] [Google Scholar]
- 5.Donovan DM. ; Assessment issues and domains in the prediction of relapse. Addiction. 1996;91(suppl):S29–S36. [PubMed] [Google Scholar]
- 6.Miller WR, Westerberg VS, Harris RJ, Tonigan JS. ; What predicts relapse? Prospective testing of antecedent models. Addiction. 1996;91(suppl):S155–S172. [PubMed] [Google Scholar]
- 7.Allsop S, Saunders B, Phillips M. ; The process of relapse in severely dependent male problem drinkers. Addiction. 2000;95:95–106. doi: 10.1046/j.1360-0443.2000.9519510.x. [DOI] [PubMed] [Google Scholar]
- 8.Bowden-Jones H, McPhillips M, Rogers R, Hutton S, Joyce E. ; Risk-taking on tests sensitive to ventromedial prefrontal cortex dysfunction predicts early relapse in alcohol dependency: A pilot study. J Neuropsychiatry Clin Neurosci. 2005;17:417–420. doi: 10.1176/jnp.17.3.417. [DOI] [PubMed] [Google Scholar]
- 9.Donovan DM, Kivlahan DR, Walker RD. ; Clinical limitations of neuropsychological testing in predicting treatment outcome among alcoholics. Alcohol Clin Exp Res. 1984;8:470–475. doi: 10.1111/j.1530-0277.1984.tb05704.x. [DOI] [PubMed] [Google Scholar]
- 10.Glenn SW, Parsons OA. ; Prediction of resumption of drinking in posttreatment alcoholics. Int J Addict. 1991;26:237–254. doi: 10.3109/10826089109053186. [DOI] [PubMed] [Google Scholar]
- 11.Noel X, Sferrazza R, Van Der Linden M, Paternot J, Verhas M, Hanak C, et al. ; Contribution of frontal cerebral blood flow measured by (99m)tc-bicisate spect and executive function deficits to predicting treatment outcome in alcohol-dependent patients. Alcohol Alcohol. 2002;37:347–354. doi: 10.1093/alcalc/37.4.347. [DOI] [PubMed] [Google Scholar]
- 12.Parsons OA, Schaeffer KW, Glenn SW. ; Does neuropsychological test performance predict resumption of drinking in posttreatment alcoholics? Addict Behav. 1990;15:297–307. doi: 10.1016/0306-4603(90)90073-7. [DOI] [PubMed] [Google Scholar]
- 13.Hutchison KE. ; Substance use disorders: Realizing the promise of pharmacogenomics and personalized medicine. Annu Rev Clin Psychol. 2010;6:577–589. doi: 10.1146/annurev.clinpsy.121208.131441. [DOI] [PubMed] [Google Scholar]
- 14.Baler RD, Volkow ND. ; Drug addiction: The neurobiology of disrupted self-control. Trends Mol Med. 2006;12:559–566. doi: 10.1016/j.molmed.2006.10.005. [DOI] [PubMed] [Google Scholar]
- 15.Goldstein RZ, Volkow ND. ; Drug addiction and its underlying neurobiological basis: Neuroimaging evidence for the involvement of the frontal cortex. Am J Psychiatry. 2002;159:1642–1652. doi: 10.1176/appi.ajp.159.10.1642. [DOI] [PMC free article] [PubMed] [Google Scholar]
- 16.Jentsch JD, Taylor JR. ; Impulsivity resulting from frontostriatal dysfunction in drug abuse: Implications for the control of behavior by reward-related stimuli. Psychopharmacology (Berl) 1999;146:373–390. doi: 10.1007/pl00005483. [DOI] [PubMed] [Google Scholar]
- 17.Koob GF, Volkow ND. ; Neurocircuitry of addiction. Neuropsychopharmacology. 2009;35:217–238. doi: 10.1038/npp.2009.110. [DOI] [PMC free article] [PubMed] [Google Scholar]
- 18.Volkow ND, Fowler JS, Wang GJ, Goldstein RZ. ; Role of dopamine, the frontal cortex and memory circuits in drug addiction: Insight from imaging studies. Neurobiol Learn Mem. 2002;78:610–624. doi: 10.1006/nlme.2002.4099. [DOI] [PubMed] [Google Scholar]
- 19.Alhassoon OM, Schweinsburg BC, Taylor MJ, Patterson TL, Brown GG, Gongvatana A, Grant I. ; Frontal lobe neurochemical and neuro-psychological differences between alcoholic subtypes identified through MMPI scale-4: A magnetic resonance spectroscopy study. Alcohol Clin Exp Res. 2004;28:22. [Google Scholar]
- 20.Fein G, Di Sclafani V, Cardenas VA, Goldmann H, Tolou-Shams M, Meyerhoff DJ. ; Cortical gray matter loss in treatment-naive alcohol dependent individuals. Alcohol Clin Exp Res. 2002;26:558–564. [PMC free article] [PubMed] [Google Scholar]
- 21.Miller WR, Walters ST, Bennett ME. ; How effective is alcoholism treatment in the United States? J Stud Alcohol. 2001;62:211–220. doi: 10.15288/jsa.2001.62.211. [DOI] [PubMed] [Google Scholar]
- 22.Jernigan TL, Butters N, DiTraglia G, Schafer K, Smith T, Irwin M, et al. ; Reduced cerebral grey matter observed in alcoholics using magnetic resonance imaging. Alcohol Clin Exp Res. 1991;15:418–427. doi: 10.1111/j.1530-0277.1991.tb00540.x. [DOI] [PubMed] [Google Scholar]
- 23.Kubota M, Nakazaki S, Hirai S, Saeki N, Yamaura A, Kusaka T. ; Alcohol consumption and frontal lobe shrinkage: Study of 1432 non-alcoholic subjects. J Neurol Neurosurg Psychiatry. 2001;71:104–106. doi: 10.1136/jnnp.71.1.104. [DOI] [PMC free article] [PubMed] [Google Scholar]
- 24.Oscar-Berman M, Marinkovic K. ; Alcohol: Effects on neurobehavioral functions and the brain. Neuropsychol Rev. 2007;17:239–257. doi: 10.1007/s11065-007-9038-6. [DOI] [PMC free article] [PubMed] [Google Scholar]
- 25.Pfefferbaum A, Lim KO, Zipursky RB, Mathalon DH, Rosenbloom MJ, Lane B, et al. ; Brain gray and white matter volume loss accelerates with aging in chronic alcoholics: A quantitative MRI study. Alcohol Clin Exp Res. 1992;16:1078–1089. doi: 10.1111/j.1530-0277.1992.tb00702.x. [DOI] [PubMed] [Google Scholar]
- 26.Schweinsburg BC, Taylor MJ, Alhassoon OM, Videen JS, Brown GG, Patterson TL, et al. ; Chemical pathology in brain white matter of recently detoxified alcoholics: A 1H magnetic resonance spectroscopy investigation of alcohol-associated frontal lobe injury. Alcohol Clin Exp Res. 2001;25:924–934. [PubMed] [Google Scholar]
- 27.Sullivan EV, Pfefferbaum A. ; Neurocircuitry in alcoholism: A substrate of disruption and repair. Psychopharmacology (Berl) 2005;180:583–594. doi: 10.1007/s00213-005-2267-6. [DOI] [PubMed] [Google Scholar]
- 28.Saletu-Zyhlarz GM, Arnold O, Anderer P, Oberndorfer S, Walter H, Lesch OM, et al. ; Differences in brain function between relapsing and abstaining alcohol-dependent patients, evaluated by EEG mapping. Alcohol Alcohol. 2004;39:233–240. doi: 10.1093/alcalc/agh041. [DOI] [PubMed] [Google Scholar]
- 29.Winterer G, Kloppel B, Heinz A, Ziller M, Dufeu P, Schmidt LG, Herrmann WM. ; Quantitative EEG (QEEG) predicts relapse in patients with chronic alcoholism and points to a frontally pronounced cerebral disturbance. Psychiatry Res. 1998;78:101–113. doi: 10.1016/s0165-1781(97)00148-0. [DOI] [PubMed] [Google Scholar]
- 30.Durazzo TC, Gazdzinski S, Yeh PH, Meyerhoff DJ. ; Combined neuroimaging, neurocognitive and psychiatric factors to predict alcohol consumption following treatment for alcohol dependence. Alcohol Alcohol. 2008;43:683–691. doi: 10.1093/alcalc/agn078. [DOI] [PMC free article] [PubMed] [Google Scholar]
- 31.Durazzo TC, Pathak V, Gazdzinski S, Mon A, Meyerhoff DJ. ; Metabolite levels in the brain reward pathway discriminate those who remain abstinent from those who resume hazardous alcohol consumption after treatment for alcohol dependence. J Stud Alcohol Drugs. 2010;71:278–289. doi: 10.15288/jsad.2010.71.278. [DOI] [PMC free article] [PubMed] [Google Scholar]
- 32.Wrase J, Makris N, Braus DF, Mann K, Smolka MN, Kennedy DN, et al. ; Amygdala volume associated with alcohol abuse relapse and craving. Am J Psychiatry. 2008;165:1179–1184. doi: 10.1176/appi.ajp.2008.07121877. [DOI] [PubMed] [Google Scholar]
- 33.Rando K, Hong KI, Bhagwagar Z, Li CS, Bergquist K, Guarnaccia J, Sinha R. ; Association of frontal and posterior cortical gray matter volume with time to alcohol relapse: A prospective study. Am J Psychiatry. 2011;168:183–192. doi: 10.1176/appi.ajp.2010.10020233. [DOI] [PMC free article] [PubMed] [Google Scholar]
- 34.Durazzo TC, Tosun D, Buckley S, Gazdzinski S, Mon A, Fryer SL, Meyerhoff DJ. ; Cortical thickness, surface area, and volume of the brain reward system in alcohol dependence: Relationships to relapse and extended abstinence. Alcohol Clin Exp Res. 2011;35:1187–1200. doi: 10.1111/j.1530-0277.2011.01452.x. [DOI] [PMC free article] [PubMed] [Google Scholar]
- 35.Schneider F, Habel U, Wagner M, Franke P, Salloum JB, Shah NJ, et al. ; Subcortical correlates of craving in recently abstinent alcoholic patients. Am J Psychiatry. 2001;158:1075–1083. doi: 10.1176/appi.ajp.158.7.1075. [DOI] [PubMed] [Google Scholar]
- 36.Grusser SM, Wrase J, Klein S, Hermann D, Smolka MN, Ruf M, et al. ; Cue-induced activation of the striatum and medial prefrontal cortex is associated with subsequent relapse in abstinent alcoholics. Psychopharmacology (Berl) 2004;175:296–302. doi: 10.1007/s00213-004-1828-4. [DOI] [PubMed] [Google Scholar]
- 37.Heinz A, Wrase J, Kahnt T, Beck A, Bromand Z, Grusser SM, et al. ; Brain activation elicited by affectively positive stimuli is associated with a lower risk of relapse in detoxified alcoholic subjects. Alcohol Clin Exp Res. 2007;31:1138–147. doi: 10.1111/j.1530-0277.2007.00406.x. [DOI] [PubMed] [Google Scholar]
- 38.Basser PJ, Jones DK. ; Diffusion-tensor MRI: Theory, experimental design and data analysis—a technical review. NMR Biomed. 2002;15:456–467. doi: 10.1002/nbm.783. [DOI] [PubMed] [Google Scholar]
- 39.Le Bihan D, Mangin JF, Poupon C, Clark CA, Pappata S, Molko N, Chabriat H. ; Diffusion tensor imaging: Concepts and applications. J Magn Reson Imaging. 2001;13:534–546. doi: 10.1002/jmri.1076. [DOI] [PubMed] [Google Scholar]
- 40.Pierpaoli C, Basser PJ. ; Toward a quantitative assessment of diffusion anisotropy. Magn Reson Med. 1996;36:893–906. doi: 10.1002/mrm.1910360612. [DOI] [PubMed] [Google Scholar]
- 41.Harris GJ, Jaffin SK, Hodge SM, Kennedy D, Caviness VS, Marinkovic K, et al. ; Frontal white matter and cingulum diffusion tensor imaging deficits in alcoholism. Alcohol Clin Exp Res. 2008;32:1001–1013. doi: 10.1111/j.1530-0277.2008.00661.x. [DOI] [PMC free article] [PubMed] [Google Scholar]
- 42.Muller-Oehring EM, Schulte T, Fama R, Pfefferbaum A, Sullivan EV. ; Global-local interference is related to callosal compromise in alcoholism: A behavior-DTI association study. Alcohol Clin Exp Res. 2009;33:477–489. doi: 10.1111/j.1530-0277.2008.00858.x. [DOI] [PMC free article] [PubMed] [Google Scholar]
- 43.Pfefferbaum A, Sullivan EV, Hedehus M, Adalsteinsson E, Lim KO, Moseley M. ; In vivo detection and functional correlates of white matter microstructural disruption in chronic alcoholism. Alcohol Clin Exp Res. 2000;24:1214–1221. [PubMed] [Google Scholar]
- 44.Pfefferbaum A, Sullivan EV. ; Disruption of brain white matter microstructure by excessive intracellular and extracellular fluid in alcoholism: Evidence from diffusion tensor imaging. Neuropsychopharmacology. 2005;30:423–432. doi: 10.1038/sj.npp.1300623. [DOI] [PubMed] [Google Scholar]
- 45.Pfefferbaum A, Adalsteinsson E, Sullivan EV. ; Dysmorphology and microstructural degradation of the corpus callosum: Interaction of age and alcoholism. Neurobiol Aging. 2006;27:994–1009. doi: 10.1016/j.neurobiolaging.2005.05.007. [DOI] [PubMed] [Google Scholar]
- 46.Pfefferbaum A, Rosenbloom M, Rohlfing T, Sullivan EV. ; Degradation of association and projection white matter systems in alcoholism detected with quantitative fiber tracking. Biol Psychiatry. 2009;65:680–690. doi: 10.1016/j.biopsych.2008.10.039. [DOI] [PMC free article] [PubMed] [Google Scholar]
- 47.Schulte T, Sullivan EV, Muller-Oehring EM, Adalsteinsson E, Pfefferbaum A. ; Corpus callosal microstructural integrity influences interhemispheric processing: A diffusion tensor imaging study. Cereb Cortex. 2005;15:1384–1392. doi: 10.1093/cercor/bhi020. [DOI] [PubMed] [Google Scholar]
- 48.Yeh PH, Simpson K, Durazzo TC, Gazdzinski S, Meyerhoff DJ. ; Tract-based spatial statistics (TBSS) of diffusion tensor imaging data in alcohol dependence: Abnormalities of the motivational neurocircuitry. Psychiatry Res. 2009;173:22–30. doi: 10.1016/j.pscychresns.2008.07.012. [DOI] [PMC free article] [PubMed] [Google Scholar]
- 49.Harsan LA, Poulet P, Guignard B, Steibel J, Parizel N, de Sousa PL, et al. ; Brain dysmyelination and recovery assessment by noninvasive in vivo diffusion tensor magnetic resonance imaging. J Neurosci Res. 2006;83:392–402. doi: 10.1002/jnr.20742. [DOI] [PubMed] [Google Scholar]
- 50.Song SK, Sun SW, Ju WK, Lin SJ, Cross AH, Neufeld AH. ; Diffusion tensor imaging detects and differentiates axon and myelin degeneration in mouse optic nerve after retinal ischemia. Neuroimage. 2003;20:1714–1722. doi: 10.1016/j.neuroimage.2003.07.005. [DOI] [PubMed] [Google Scholar]
- 51.Smith SM, Jenkinson M, Johansen-Berg H, Rueckert D, Nichols TE, Mackay CE, et al. ; Tract-based spatial statistics: Voxelwise analysis of multi-subject diffusion data. Neuroimage. 2006;31:1487–1505. doi: 10.1016/j.neuroimage.2006.02.024. [DOI] [PubMed] [Google Scholar]
- 52.Grant I, Adams K, Reed R. ; Normal neuropsychological abilities of alcoholic men in their late thirties. Am J Psychiatry. 1979;136:1263–1269. doi: 10.1176/ajp.136.10.1263. [DOI] [PubMed] [Google Scholar]
- 53.Adams KM, Grant I, Carlin AS, Reed R. ; Cross-study comparisons of self-reported alcohol consumption in four clinical groups. Am J Psychiatry. 1981;138:445–449. doi: 10.1176/ajp.138.4.445. [DOI] [PubMed] [Google Scholar]
- 54.Sobell LC, Sobell MB, Leo GI, Cancilla A. ; Reliability of a timeline method: Assessing normal drinkers’ reports of recent drinking and a comparative evaluation across several populations. Br J Addict. 1988;83:393–402. doi: 10.1111/j.1360-0443.1988.tb00485.x. [DOI] [PubMed] [Google Scholar]
- 55.Beck AT. Depression Inventory. Philadelphia: Center for Cognitive Therapy; 1978. [Google Scholar]
- 56.Zucker RA, Ellis DA, Fitzgerald HE. Developmental evidence for at least two alcoholisms. I. Biopsychosocial variation among pathways into symptomatic difficulty. Ann N Y Acad Sci. 1994;708:134–146. doi: 10.1111/j.1749-6632.1994.tb24706.x. [DOI] [PubMed] [Google Scholar]
- 57.Smith SM, Jenkinson M, Woolrich MW, Beckmann CF, Behrens TE, Johansen-Berg H, et al. ; Advances in functional and structural MR image analysis and implementation as FSL. Neuroimage. 2004;23(suppl 1):S208–S219. doi: 10.1016/j.neuroimage.2004.07.051. [DOI] [PubMed] [Google Scholar]
- 58.Smith SM. ; Fast robust automated brain extraction. Hum Brain Mapp. 2002;17:143–155. doi: 10.1002/hbm.10062. [DOI] [PMC free article] [PubMed] [Google Scholar]
- 59.Nichols TE, Holmes AP. ; Nonparametric permutation tests for functional neuroimaging: A primer with examples. Hum Brain Mapp. 2002;15:1–25. doi: 10.1002/hbm.1058. [DOI] [PMC free article] [PubMed] [Google Scholar]
- 60.Smith SM, Nichols TE. ; Threshold-free cluster enhancement: Addressing problems of smoothing, threshold dependence and localisation in cluster inference. Neuroimage. 2009;44:83–98. doi: 10.1016/j.neuroimage.2008.03.061. [DOI] [PubMed] [Google Scholar]
- 61.Wheeler-Kingshott CA, Cercignani M. ; About “axial” and “radial” diffusivities. Magn Reson Med. 2009;61:1255–1260. doi: 10.1002/mrm.21965. [DOI] [PubMed] [Google Scholar]
- 62.Damasio AR. ; The somatic marker hypothesis and the possible functions of the prefrontal cortex. Philos Trans R Soc Lond B Biol Sci. 1996;351:1413–1420. doi: 10.1098/rstb.1996.0125. [DOI] [PubMed] [Google Scholar]
- 63.Robbins TW. ; Dissociating executive functions of the prefrontal cortex. Philos Trans R Soc Lond B Biol Sci. 1996;351:1463–1470. doi: 10.1098/rstb.1996.0131. discussion 1470–1471. [DOI] [PubMed] [Google Scholar]
- 64.Li CS, Luo X, Yan P, Bergquist K, Sinha R. ; Altered impulse control in alcohol dependence: Neural measures of stop signal performance. Alcohol Clin Exp Res. 2009;33:740–750. doi: 10.1111/j.1530-0277.2008.00891.x. [DOI] [PMC free article] [PubMed] [Google Scholar]
- 65.Moeller FG, Hasan KM, Steinberg JL, Kramer LA, Dougherty DM, Santos RM, et al. ; Reduced anterior corpus callosum white matter integrity is related to increased impulsivity and reduced discriminability in cocaine-dependent subjects: Diffusion tensor imaging. Neuropsychopharmacology. 2005;30:610–617. doi: 10.1038/sj.npp.1300617. [DOI] [PubMed] [Google Scholar]
- 66.Salo R, Nordahl TE, Buonocore MH, Natsuaki Y, Waters C, Moore CD, et al. ; Cognitive control and white matter callosal microstructure in methamphetamine-dependent subjects: A diffusion tensor imaging study. Biol Psychiatry. 2009;65:122–128. doi: 10.1016/j.biopsych.2008.08.004. [DOI] [PMC free article] [PubMed] [Google Scholar]
- 67.Bechara A. ; The role of emotion in decision-making: Evidence from neurological patients with orbitofrontal damage. Brain Cogn. 2004;55:30–40. doi: 10.1016/j.bandc.2003.04.001. [DOI] [PubMed] [Google Scholar]
- 68.Tranel D, Bechara A, Denburg NL. ; Asymmetric functional roles of right and left ventromedial prefrontal cortices in social conduct, decision-making, and emotional processing. Cortex. 2002;38:589–612. doi: 10.1016/s0010-9452(08)70024-8. [DOI] [PubMed] [Google Scholar]
- 69.Kril JJ, Halliday GM, Svoboda MD, Cartwright H. ; The cerebral cortex is damaged in chronic alcoholics. Neuroscience. 1997;79:983–998. doi: 10.1016/s0306-4522(97)00083-3. [DOI] [PubMed] [Google Scholar]
- 70.Wojnar M, Brower KJ, Strobbe S, Ilgen M, Matsumoto H, Nowosad I, et al. ; Association between Val66Met brain-derived neurotrophic factor (BDNF) gene polymorphism and post-treatment relapse in alcohol dependence. Alcohol Clin Exp Res. 2009;33:693–702. doi: 10.1111/j.1530-0277.2008.00886.x. [DOI] [PMC free article] [PubMed] [Google Scholar]
- 71.Tessner KD, Hill SY. ; Neural circuitry associated with risk for alcohol use disorders. Neuropsychol Rev. 2010;20:1–20. doi: 10.1007/s11065-009-9111-4. [DOI] [PMC free article] [PubMed] [Google Scholar]
- 72.Project MATCH Research Group. Matching Alcoholism Treatments to Client Heterogeneity: Project MATCH posttreatment drinking outcomes. J Stud Alcohol. 1997;58:7–29. [PubMed] [Google Scholar]
- 73.Frank LR. ; Characterization of anisotropy in high angular resolution diffusion-weighted MRI. Magn Reson Med. 2002;47:1083–1099. doi: 10.1002/mrm.10156. [DOI] [PubMed] [Google Scholar]
- 74.Pierpaoli C, Jezzard P, Basser PJ, Barnett A, Di Chiro G. ; Diffusion tensor MR imaging of the human brain. Radiology. 1996;201:637–648. doi: 10.1148/radiology.201.3.8939209. [DOI] [PubMed] [Google Scholar]