Abstract
Objective
Postnatal calorie and growth restriction (PNGR) in the first generation (F1) rat female offspring causes a lean and glucose tolerant phenotype associated with hypoinsulinemia and reduced glucose-stimulated insulin secretion (GSIS). Despite the absence of gestational hyperglycemia in the F1 PNGR female, naturally born second generation (F2) PNGR female adult offspring reportedly exhibit obesity, hyperglycemia with insulin resistance. The objective of this study was to determine the role of the intrauterine environment on the heritability of the trans-generational phenotypic expression in the F2 PNGR female adult offspring.
Materials/Methods
We performed embryo transfer (ET) of the F2 embryos from the procreating F1 pregnant PNGR or control (CON) females to gestate in control recipient rat mothers. Employing stable isotopes glucose metabolic kinetics was determined.
Results
Birth weight, postnatal growth pattern and white adipose tissue in female F2 ET-PNGR were similar to ET-CON. Similarly, no differences in basal glucose and insulin concentrations, GSIS, glucose futile cycling and glucose clearance were seen. When compared to F2 ET-CON, F2 ET-PNGR showed no overall difference in glucose or hepatic glucose production (HGP) AUCs with minimal hyperglycemia (p<0.04) as a result of unsuppressed endogenous HGP (p<0.02) observed only during the first phase of IVGTT.
Conclusions
We conclude that the lean, glucose tolerant and hypoinsulinemic phenotype with reduced GSIS in the F1 generation is near normalized when the embryo-transferred F2 offspring gestates in a normal metabolic environment. This observation supports a role for the intra-uterine environment in modifying the heritability of the trans-generational PNGR phenotype.
Keywords: Postnatal growth, Embryo Transfer, Glucose stimulated insulin release, Glucose tolerance
Introduction
There is accumulating evidence about the epidemiological link between low birth weight and adult onset chronic diseases including diabetes mellitus (1, 2). More recently the focus has shifted to the postnatal period of development. Particularly postnatal growth rate and its impact on the adult phenotype have been examined (3–5). When an infant born with a low birth weight exhibits a slow postnatal growth rate between 0–2 years of age, and an exponential growth rate thereafter, an increased propensity towards developing diabetes mellitus and cardiovascular disease was evident in both men and women of the first generation (5–7). The effect of postnatal slow growth rate on the phenotype of the next generation in the human has not yet been systematically studied.
Studies emerging from the outcome of the second generation offspring born to the in-utero survivors of the Dutch Famine show no effect on birth weight and development of cardiovascular disease or metabolic outcome. However a reduction in birth length along with acquisition of neonatal adiposity and poorer subsequent health suggestive of the emergence of chronic diseases was observed (8). In keeping with this epidemiological report, many animal studies creating intra-uterine growth restriction (IUGR) suggest a role for both heritability and the intra-uterine environment in shaping the phenotype of the next generation (9–13). In contrast, very few investigations exist that describe the transgenerational effect of postnatal growth restriction. Pinheiro et al engaged a nutrient restricted rat model of postnatal growth restriction and demonstrated hyperglycemia and insulin resistance in six month old F2 females born naturally to small but glucose tolerant postnatally growth restricted (PNGR) F1 rat mothers (14).
Unlike IUGR, postnatal growth restriction accomplished by nutrient restriction, whether protein or calories, imposed only during the suckling phase of the F1 offspring is metabolically protective. Our previous investigation employing caloric restriction during the suckling phase in rats has revealed an F1 pre-gestational female offspring that is lean, and glucose tolerant while being hypoinsulinemic with a reduced ability to produce insulin in response to a glucose challenge (15). Most notably, these F1 females were observed to be insulin sensitive with no major advantage when subjected to either insulin sensitizers or exercise (16, 17). In fact when superimposed on the IUGR F1 offspring, the PNGR metabolic state is protective against obesity and hepatic insulin resistance (15).
During gestation, the F1 PNGR offspring is glucose tolerant and does not exhibit any overt metabolic aberrations (15). Hence the mechanism behind the F2 offspring naturally born to a mother exposed to postnatal growth restriction becoming hyperglycemic and insulin resistant remains unclear (14). Instead one would expect the transgenerational persistence of a lean, hypoinsulinemic and insulin sensitive phenotype in the F2 offspring if purely related to heritability. In contrast, since the naturally born F2 offspring of a PNGR female showed a hyperglycemic and insulin resistant phenotype (14), it appears that the intra-uterine environment created by the F1 mother for the F2 progeny must modify heritability.
Thus despite exhibition of glucose tolerance by the F1 PNGR rat mother during pre-gestation and gestation, intermittent episodes of postprandial hyperglycemia that escape detection with a single glucose measurement or a glucose tolerance test is feasible in the presence of hypoinsulinemia (11, 18, 19). This cryptic presence of episodic postprandial hyperglycemia in the pregnant F1 PNGR female may be responsible for this previously reported F2 metabolic phenotype (14).
Based on this information, we hypothesized that normalizing this cryptically abnormal intra-uterine environment offered by the hypoinsulinemic F1 PNGR female to the F2 progeny should ameliorate hyperglycemia and insulin resistance in the F2 offspring of the PNGR female adult. We tested this hypothesis by undertaking embryo transfer (ET) experiments and determined a role for the intra-uterine environment in shaping the heritability of the metabolic phenotype of the F2 offspring procreated by the hypoinsulinemic PNGR biological mother.
Research Design and Methods
Animals
Sprague-Dawley rats (7–8 weeks old; 200–250g) (Charles River Laboratories, Hollister, CA) were housed in individual cages, exposed to 12h light/dark cycles at 21–23°C, and allowed ad lib access to standard rat chow (composition carbohydrate 63.9%, fat 4.5%, protein 14.5%, balance fiber and ash). The National Institutes of Health guidelines were followed as approved by the Animal Research Committee of the University of California, Los Angeles.
Post-natal nutrient restriction (PNGR)
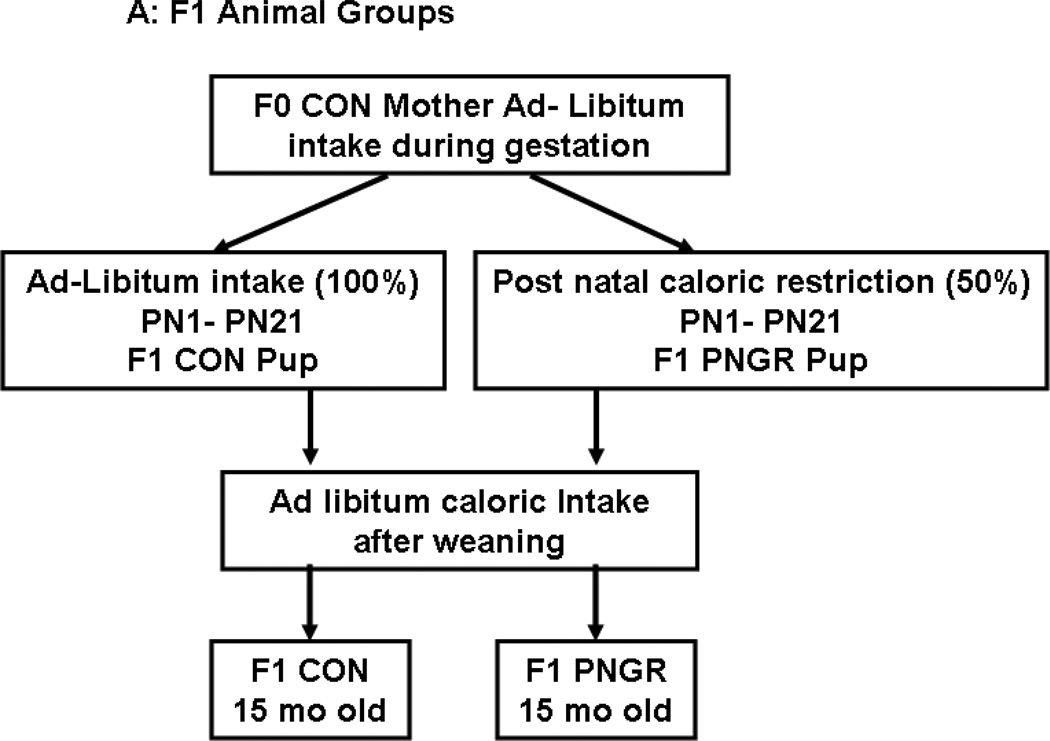
Pregnant rats (F0) received ad lib food and water during gestation. At birth, the litter size was culled to six. The F1 newborn rats were reared by calorie restricted mothers that received 50% of daily food intake through lactation alone (PN1 to PN21; 20 g/day) (15). The F1 control pups born to control mothers were reared by control mothers with ad lib access to rat chow during lactation (Fig. 1A and B).
Figure 1.
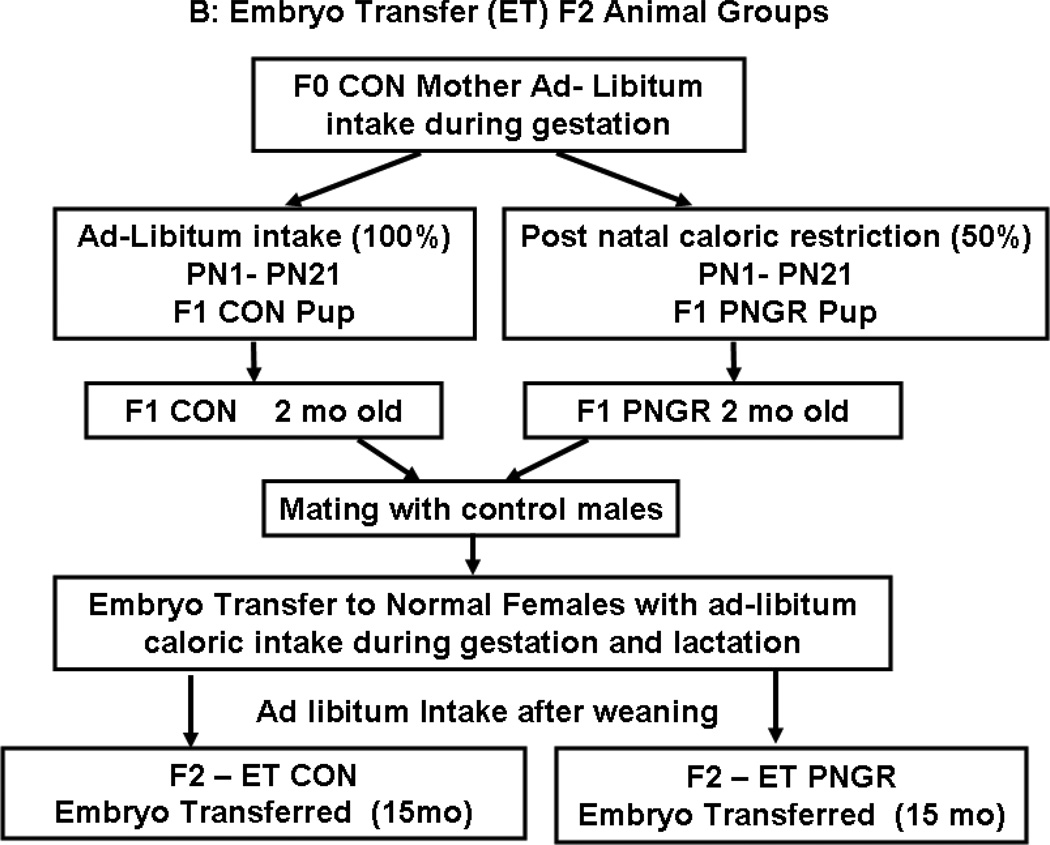
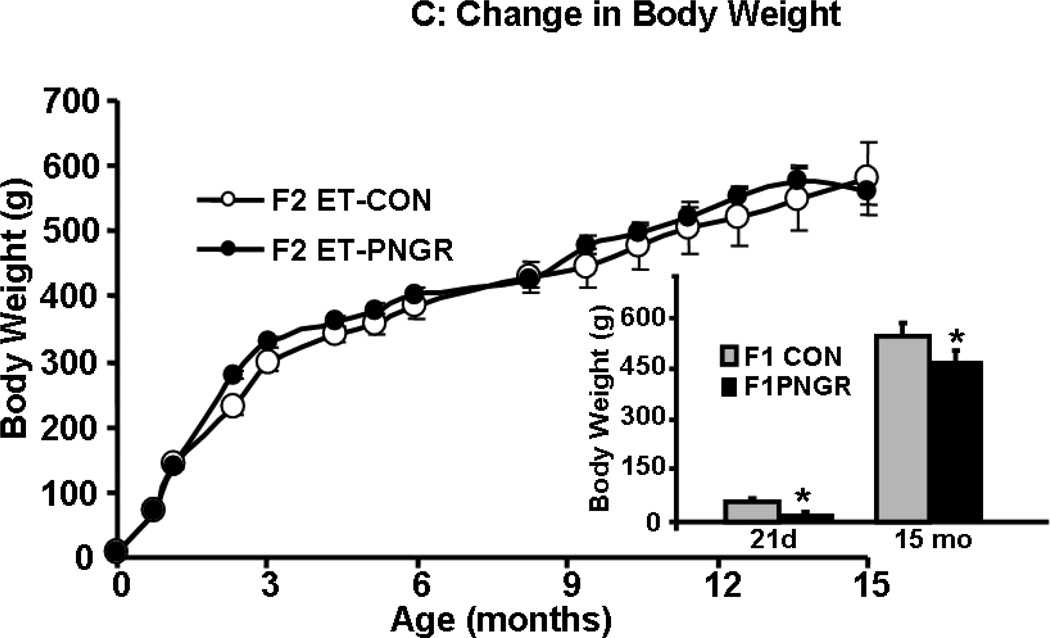
A: Flow chart demonstrating the F1 animal groups reared under control (CON) and postnatal calorie restriction (PNGR) conditions. 1B: Flow chart demonstrating F2 embryo transfer (ET)-CON and F2 ET-PNGR that were reared under ad-libitum conditions during gestation, lactation and post weaning. 1C: The increase in body weight (g) from birth to 15 months of age in F2 ET-CON (n=6) was similar to the growth pattern of F2 ET-PNGR (n=6). Inset: Body weight in age matched F1 CON and F1 PNGR at 21d and 15 months (n=6 at each age in each group). Data shown as Mean±SEM. *p<0.03 compared to F1 CON.
Experimental Groups
Two groups of F1 donor animals were created: 1) control pups (six/litter) born to control mothers that were postnatally reared by control mothers (CON) and 2) control pups (six/litter) born to control mothers that were reared by calorie restricted mothers (PNGR) (Figure 1A). On day 21, female pups from these two groups were weaned from their respective mothers and maintained as two animals per cage with ad libitum access to a standard rat chow diet until either 2 months (mo) of age to serve as the F1 donor animals (Fig. 1B) or 15 mo of age (Fig. 1A) for comparative characterization of glucose metabolism/kinetics in the F1 female generation belonging to either the PNGR or CON groups.
Ovulation
The 2 mo old F1 CON and F1 PNGR female donor animals received intra-peritoneal (IP) 40 µg GnRH (Sigma L4513) and were mated with control males on the fourth evening. Simultaneously matings were performed between another set of recipient control females and vasectomized males and both pregnancy and pseudo-pregnancy was confirmed by the presence of a vaginal plug the following morning (11).
Collection of eggs
Under inhalational 2.5% isoflurane anesthesia, the abdominal area of donor females from two experimental groups was cleaned and prepped taking sterile precautions to remove and transfer oviducts and the uterus into a 35 mm Petri dish containing M2 medium (M2-MR-051-F:M2 w/Hyaluronidase, specialty media, Chemicon International, Temecula, CA) at room temperature. The oviduct was cut open and eggs surrounded by cumulus cells were flushed out into M2 medium with hyaluronidase (M2 w/Hyaluronidase, specialty media, Chemicon International, Temecula, CA). Fertilized oocytes were collected and maintained in M16 (5.55 mM glucose, specialty media, Chemicon International, Temecula, CA) micro drop cultures at 37°C for less than two hours (range 1–2 h) until embryo transfer was performed (11).
Embryo transfer procedure
The recipient pseudo-pregnant control rats were anesthetized by receiving intraperitoneal ketamine HCl (50 mg/kg), acepromazine maleate (1 mg/kg) and xylazine (4.8 mg/kg). Providing standard eye care, aseptic and isothermal conditions, the oviduct was exposed and 12h old pooled embryos (30–40) were transferred into the oviduct by inserting the transfer pipette into the ampular opening (11). The abdominal muscle and subcutaneous tissues were approximated with absorbable sutures and the incision closed with wound clips that were removed after 7–10 days. Animals were monitored closely until full recovery from anesthesia and surgery (11).
Postnatal care of embryo-transferred animals
Pregnant recipient females were allowed to deliver. Each litter size was culled to six pups to mimic that of F1 donor mothers. These pups were reared by a non-manipulated CON mother to maintain consistent postnatal nutrition. Post-weaning the offspring had ad lib access to the standard laboratory rat chow and water and the F2 females were examined at 15 mo of age (Fig. 1B) to match the F1 female counterpart (Fig. 1A).
Intravenous glucose tolerance test (IVGTT)
Fifteen mo old awake adult female animals received 1 g/kg body weight of a 1:1 mixture of [2-2H] and [6, 6-2H2] glucose (Cambridge Isotope Laboratories, Andover, MA, >98% pure) via surgically placed jugular venous catheters (15). Serial blood samples (500 µL) were obtained for assessment of hormones, glucose concentrations, and isotopomer enrichment.
Insulin tolerance test (ITT)
Fifteen month old awake adult female rats received 0.75 U/kg of human insulin via the jugular venous catheter and blood was obtained at 0, 15, 30 and 60 min subsequently to measure glucose concentrations (11).
Body and organ weights
After measuring body weight, the animals were anesthetized by inhalation of isoflurane and organs/tissues (brain, heart, liver, kidneys, white adipose tissue and brown adipose tissue) were removed and weighed individually.
Plasma assays
Plasma glucose was measured by the glucose oxidase method (Sigma Diagnostics, St. Louis, Mo.; sensitivity = 0.1 mM). Insulin and leptin were quantified by enzyme linked immuno-absorbent assays (ELISA) using rat standards and anti-rat insulin or leptin antibodies (Linco Research Inc., St. Charles, Mo; sensitivity: insulin = 0.2 ng/ml, leptin = 0.04 ng/ml). Corticosterone was quantified using a radio-immunoassay and an anti-rat corticosterone antibody (Coat-A-count, Diagnostic Products Corporation, Los Angeles, CA; sensitivity ∼5.7 ng/ml with apparent concentration at 95% B/Bo). To convert corticosterone ng/ml to System International (SI) units (nmol/L) all values were multiplied by 2.886. Glucose concentrations were converted to SI by multiplying with 0.055, insulin values were divided by 5.825 and leptin values multiplied by 1.0. The inter-and intra-assay coefficient of variation for insulin and leptin concentrations was 6.48±0.84%. HOMA-IR (homeostasis model of assessment) was used as a measure of insulin resistance and was calculated using the formula: [fasting glucose (mmol/l) x fasting insulin (µU/ml)]/22.5.
Gas chromatography/mass spectrometry (GC/MS) analysis
Glucose was analyzed by GC/MS as previously described (15, 20, 21). All isotopomeric determinations were performed using a Hewlett-Packard gas chromatograph (model 6890) connected to a Mass Selective Detector (model 5973A, Hewlett-Packard, Palo Alto, CA). Electron impact ionization was used to characterize glucose positional isotopomers of [6,6-2H2] glucose at m/z 187 for C3–C6 and of [2-2H] glucose at m/z 242 for C1–C4 fragments (22, 23).
Analysis and interpretation of IVGTT
Mass isotopomer distribution was determined using the method of Lee et al (22). The disappearance of the two isotopes, [2-2H]- and [6,6-2H2]-glucose was determined for the M1 label of [2-2H]-glucose and the M2 label of [6,6-2H2]-glucose (15, 22, 23). Results of the mass isotopomers in glucose (enrichment of glucose isotopomers) are reported as molar fractions of M0, M1, M2, etc. according to the number of labeled carbons or hydrogen in the molecule (15, 16). The sum of all isotopomers of the glucose molecules, ∑Mi for i = 0 to n (n = 6 for glucose) and is equal to 1 or 100%. Timed plasma M1 or M2 ([2-2H]- or [6,6-2H2]-glucose) enrichment was plotted on semilog plots. The rate of tracer disappearance was analyzed by a one-exponential model to determine the fractional clearance of glucose (KM1 and KM2).
M2 represents the rate of disappearance or total glucose clearance or glucose disposal. The difference between the disappearance rates of M1 and M2 was used as a measure of futile cycling or recycling (i.e. glucose to glucose-6-phosphate and back) (15, 16, 23, 24).
M0 glucose is unlabeled glucose that is generated by the liver via glycogenolysis from unlabeled glycogen or gluconeogenesis from unlabeled substrates. During IVGTT, unsuppressed endogenous hepatic glucose production was derived from the increase in unlabeled glucose concentration “M0” which was assessed by subtracting the labeled glucose fraction from total glucose concentration (15).
Statistical analysis
All data are expressed as mean ± SE. The data were tested and passed the test for normal distribution. Two-way analysis of variance was used to compare the effect of embryo transfer (ET) between groups from F1 and F2 generations. Once significance was observed, inter-group differences were determined by the all pair wise multiple comparisons by Holm-Sidak method. When only two groups were compared, Student’s t-test was employed. Significance was assigned when p values were <0.05.
Results
Phenotype - Body, organ weights and baseline glucose and hormonal profile
The F2 embryo transfer PNGR body weight, nose tail length or organ weights were not different from that of the F2 embryo transfer CON 15 mo old female rats (Table 1). This is in contrast to the F1 PNGR that was significantly lighter (p<0.03) with decreased white adipose tissue (p<0.05) (WAT) when compared to sex- and age-matched F1 CON. Thus, the lower WAT mass of the age matched F1 PNGR was normalized in the F2 embryo transfer PNGR group. However, both F2 embryo transfer CON (sham) and F2 embryo transfer PNGR displayed similar body weight, liver, heart and brain weights when compared to the F1 CON group but body weight, WAT and heart weight were higher than the F1 PNGR group (Table 1).
Table 1.
Body weight at birth and 15 months, nose-tail (N–T) length (cm), and organ weights (g) in F2 embryo transfer (ET)-CON and F2 ET-PNGR groups at 15 months.
| Birth Weight (g) |
Body weight at 15 m (g) |
N-T Length (cm) |
Liver Wt (g) |
White adipose tissue (g) |
Brown adipose tissue (g) |
Heart (g) |
Brain (g) |
|
|---|---|---|---|---|---|---|---|---|
| F2 ET-CON (5 to 6) | 6.2±0.2 | 580.4±85.3 | 45.6±0.3 | 14.57±1.89 | 44.74±11.8 | 1.42±0.3 | 1.48±0.12 | 2.04±0.04 |
| F2 ET-PNGR (11) | 6.2±0.3 | 562±22.6A | 45.3±0.5 | 14.9±0.9 | 41.2±3.2B | 1.3±0.1 | 1.53±0.07A | 2.1±0.04 |
| F1 CON (5 to 6) | 6.1±0.05 | 507.3±27.6 | 45.3±0.2 | 14.6±0.6 | 37.8±6.6 | 1.3±0.04 | 1.4±0.002 | 2.1±0.06 |
| F1 PNGR (6) | 5.1±0.05 | 461±66.2# | 45.7±0.1 | 12.7±0.8 | 18.1±3.6## | 0.9±0.2 | 1.25±0.04 | 2.1±0.3 |
Data shown as Mean±SEM, number of animals (n) shown in parenthesis.
p<0.05 F2 ET PNGR versus F1 PNGR
p<0.03 F2 ETPNGR versus F1 PNGR
p<0.03 F1 CON versus F1 PNGR
p<0.05 F1 CON versus F1 PNGR
The weight gain from birth to 15 mo of age and body weight at 15 months (Figure 1C) in the F2 embryo transfer PNGR females was similar to F2 embryo transfer CON females. In contrast, the age matched F1 PNGR weighed significantly less (p<0.03) than the F1 CON at 21 days and 15 months of age as shown in the inset of figure 1C. There was no difference in fasting plasma glucose, leptin and corticosterone concentrations between the previously reported F2 embryo transfer CON (11) and F2 embryo transfer PNGR groups (Table 2). HOMA-IR trended on the lower side in F2 embryo transfer PNGR versus the F2 embryo transfer CON (11) ; however was not statistically significant (Table 2). This observation is in contrast to significantly, hypoinsulinemic and hypoglycemic age-matched F1 PNGR with lower HOMA-IR compared to F1 CON and a trend towards a lower plasma leptin concentration that did not achieve statistical significance. Thus the circulating plasma insulin and glucose concentration in 15 mo old F2 embryo transfer PNGR normalized whereas, the age matched F1 PNGR was significantly, hypoinsulinemic (p<0.05) and hypoglycemic (p<0.05) versus their respective sex-matched CON counterparts as reported previously (11,15).
Table 2.
Basal plasma glucose, insulin, leptin and corticosterone concentrations in F2 embryo transfer (ET)-CON and F2 ET-PNGR groups at 15 months.
| Group | Glucose (mmol/L) |
Insulin (nmol/L) |
Leptin (nmol/L) |
Corticosterone (nmol/L) |
HOMA-IR |
|---|---|---|---|---|---|
| F2 ET-CON (6) | 4.2±0.3 | 16.04±5.1 | 37.9±7.8 | 101.4±8.9 | 223.1±6.6 |
| F2 ET-PNGR(6) | 4.4±0.4 | 10.6±1.8 | 34.3±4.1 | 82.6±5.9 | 16.1±2.6 |
| F1 CON (6) | 5.6±0.3 | 17.3±5.2 | 37.3±5.1 | 120.8±9 | 33.1±4.8 |
| F1 PNGR (6) | 4.5±0.3# | 9.3±3.6# | 28.5±5.6 | 132.4±4.4 | 14.1±3.5## |
Data shown as Mean±SEM, number of animals (n) shown in parenthesis.
p<0.05 F1 PNGR versus F1 CON
p<0.02 F1 PNGR versus F1 CON
IVGTT and hormonal adaptations during IVGTT
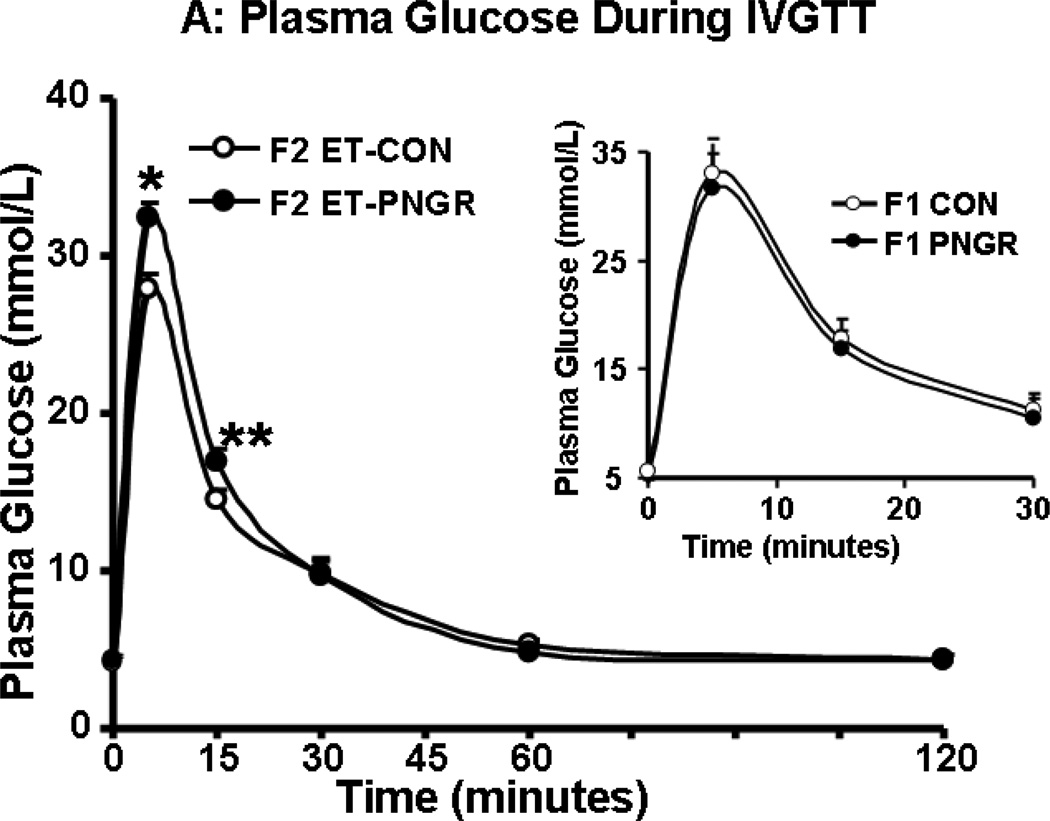
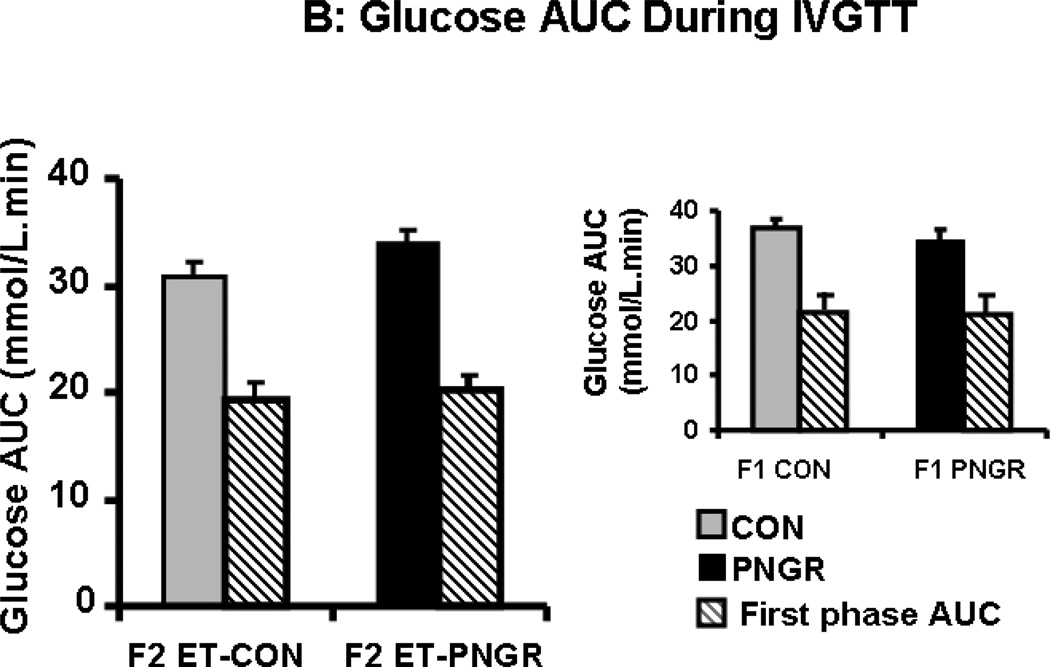
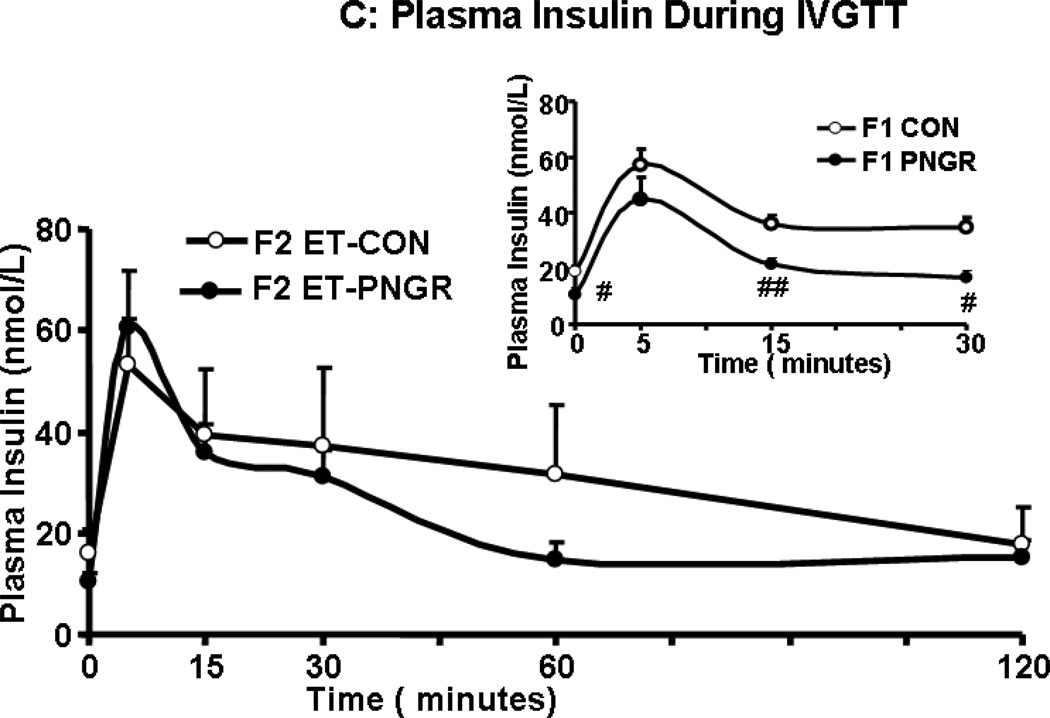
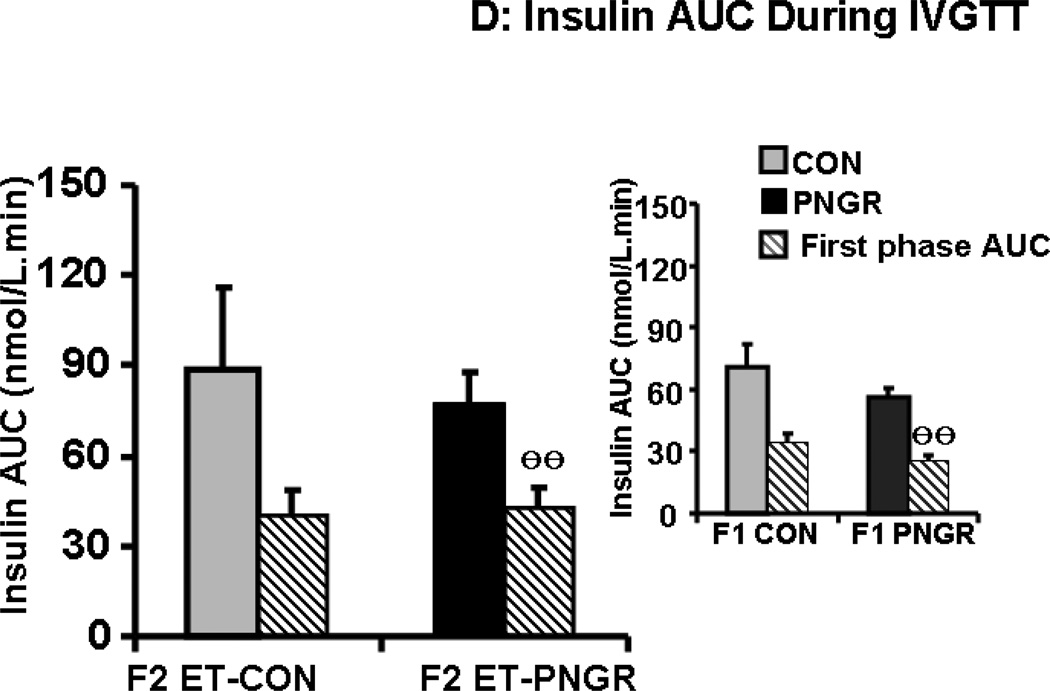
After a rapid intravenous glucose challenge (1 g/kg body weight of 20% glucose solution), unlike the F1 PNGR, the F2 embryo transfer PNGR group was mildly hyperglycemic at 5 and 15 minutes when compared to the F2 embryo transfer CON group (p<0.03 and p<0.05 respectively, Figure 2A). This increase in glucose concentrations was not reflected in the first phase glucose AUC in the F2 embryo transfer PNGR that was not different from the F2 embryo transfer CON (Figure 2B). This was similar to the F1 PNGR first phase glucose AUC which was also not different from that of F1 CON. Additionally, no change in total glucose AUC was noted in either the F2 embryo transfer or F1 PNGR groups versus their respective controls (Figure 2B). The early and late glucose-induced insulin secretion (GSIS) in F2 embryo transfer PNGR assessed by plasma insulin measurements at 5, 15, 30, 60 and 120 minutes after a glucose challenge was similar to that of the F2-CON with no change in the total or first phase GSIS AUC (Figure 2C and 2D). The GSIS in F2 embryo transfer PNGR that was similar to F2 embryo transfer CON contrasted that of the age matched F1 PNGR that exhibited significant hypoinsulinemia at baseline (p<0.02), 15 and 30 minutes (p<0.02 and p<0.03 respectively) following the glucose challenge (Figure 2C inset). This resulted in a significantly lower first phase GSIS AUC compared to that of F2 embryo transfer PNGR (p<0.05) (Figure 2D inset) (11,15).
Figure 2.
A: Serial plasma glucose concentrations during glucose tolerance tests after an IV glucose challenge (1g/kg) are depicted in F2 embryo transfer (ET)-PNGR (n=6), and F2 ET-CON (n=5). Inset: Plasma glucose during first 30 minutes of IVGTT is shown in age matched F1 CON (n=5) and F1 PNGR (n=6) after 1g/kg IV glucose bolus. Data shown as Mean±SEM. 2B: The total and first phase (15 min) glucose concentration area under the curve (AUC) during IVGTT in both ET-F2 groups. Inset: The total and first phase (15 min) plasma glucose AUC during IVGTT in F1 CON (n=5) and F1 PNGR (n=6) groups did not show any difference. Data shown as Mean±SEM. 2C: Glucose stimulated insulin response (GSIS) demonstrates serial plasma insulin concentrations after an IV glucose challenge (1g/kg) for F2 ET-PNGR (n=6) and F2 ET-CON (n=5). Inset: Glucose stimulated insulin secretion (GSIS) demonstrates serial plasma insulin concentrations during the first 30 minutes after an IV glucose challenge (1g/kg) in age matched F1 CON (n=5) and F1 PNGR (n=6). 2D: Total and first phase (15 min) plasma insulin concentration area under the curve (AUC) during IVGTT. Inset: Total and first phase (15 min) insulin AUC during IVGTT is shown for age matched F1 CON (n=5) and F1 PNGR (n=6). Data shown as Mean±SEM.
*p<0.03 F2 ET-PNGR versus F2 ET-CON
**p<0.05 F2 ET-PNGR versus F2 ET-CON
ӨӨp<0.05 F2 PNGR versus F1 PNGR
#p<0.02 F1 CON versus F1 PNGR
##p<0.03 F1 CON versus F1 PNGR.
Glucose metabolic adaptation
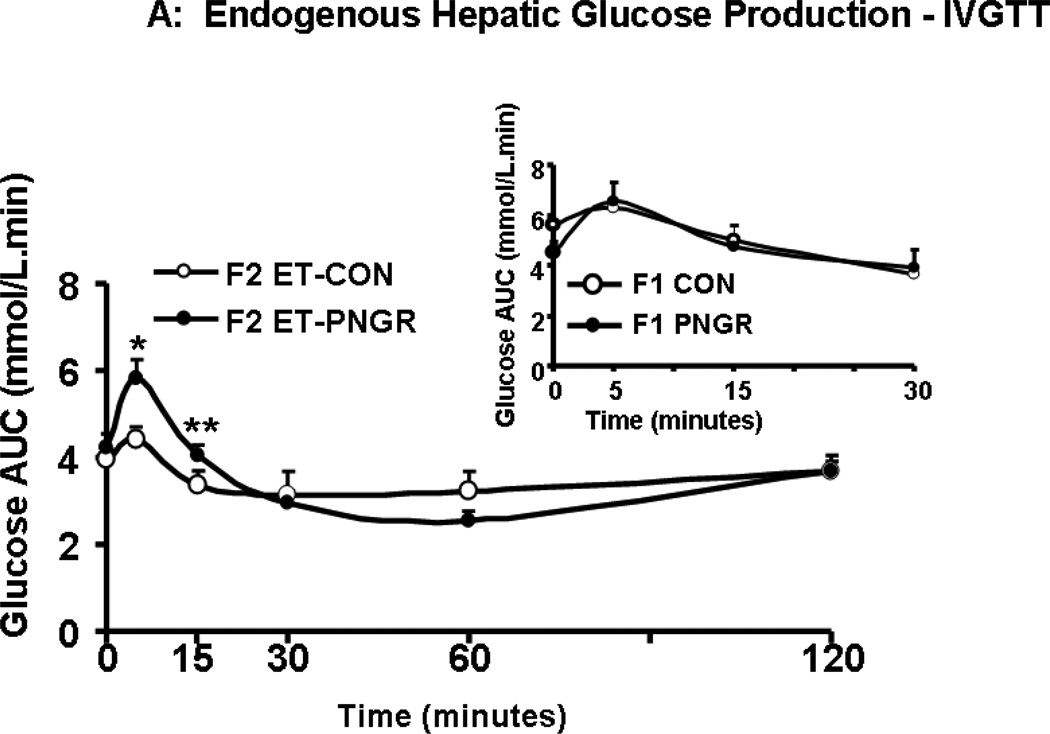
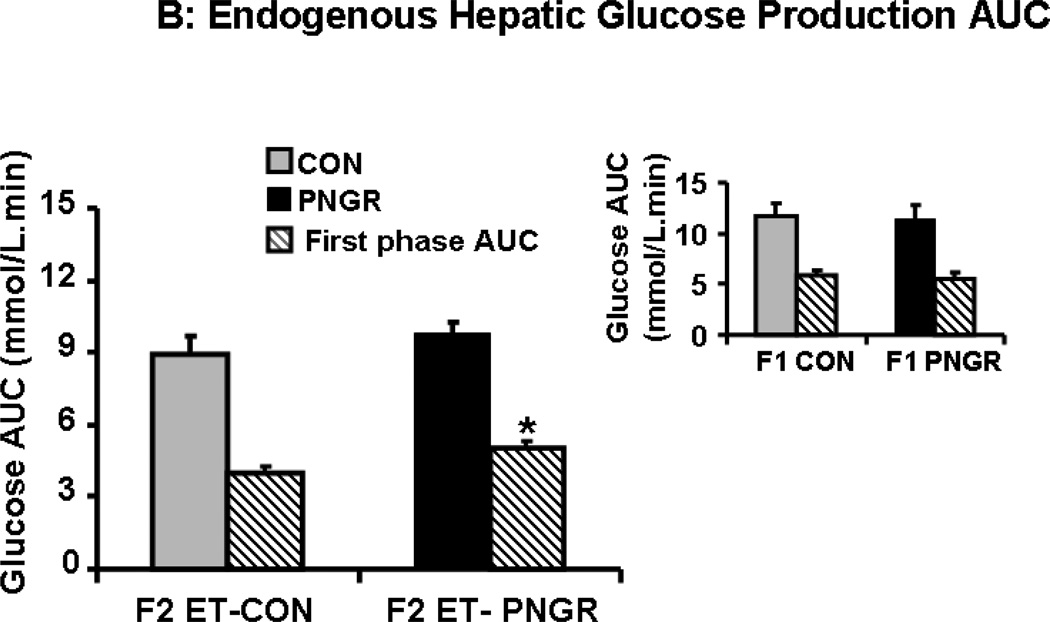
During IVGTT the suppression of endogenous hepatic glucose production (HGP) was measured. The F2 embryo transfer PNGR group showed significant increase in unsuppressed endogenous HGP at 5 (p<0.02) and 15 minutes (p<0.03) reflecting the mild hyperglycemia seen during IVGTT (Figure 2A). In contrast, the endogenous HGP in age matched F1 PNGR was similar to that of F1 CON reflecting the observed glucose tolerance (Fig 2A, inset). This unsuppressed HGP of F2 embryo transfer PNGR noted only during the first phase and not the total IVGTT, translated into an increase in endogenous HGP AUC when compared to F2 embryo transfer CON (p<0.02) (Figure 3B). Similar to the F1 groups, there was no change in glucose clearance, glucose futile cycling or percent recycling between the two F2 embryo transfer groups (Table 3) (11,15).
Figure 3.
A: The endogenous hepatic glucose production after glucose challenge is shown at various time points for F2 embryo transfer (ET)-CON (n=5) and F2 ET-PNGR (n=6). Inset: Endogenous hepatic glucose production during the first 30 minutes after a glucose challenge in age matched F1 CON (n=5) and F1 PNGR (n=6) is depicted. Data shown as Mean±SEM. 3B: Total and first phase (15 min) endogenous hepatic glucose production area under the curve (AUC) during IVGTT is shown in F2 ET-PNGR (n=6) and F2 ET-CON (n=5). Inset: Total and first phase (15 minutes) AUC for endogenous hepatic glucose production in age matched F1 CON (n=5) and F1 PNGR (n=6). Data shown as Mean±SEM.
*p<0.02, F2 ET-PNGR (n=6) versus F2 ET-CON (n=5),
**p<0.03, F2 ET-PNGR (n=6) versus F2 ET-CON (n=5).
Table 3.
Glucose clearance, hepatic glucose futile cycling and percent of total glucose production from glucose recycling during IVGTT in F2 embryo transfer (ET)-CON and F2 ET-PNGR groups at 15 months.
| Group | Total glucose clearance (mmol/kg/min) |
Hepatic glucose futile cycling (GFC) (mmol/kg/min) |
GFC % hepatic glucose production (%) |
|---|---|---|---|
| F2 ET-CON (5) | 0.22±0.01 | 0.09±0.01 | 43.4±5.2 |
| F2 ET-PNGR (6) | 0.23±0.02 | 0.07±0.02 | 32.2±5.8 |
| F1-CON (5) | 0.22±0.01 | 0.11±0.01 | 31.7±1.8 |
| F1-PNGR (6) | 0.23±0.01 | 0.08±0.02 | 33.7±6.9 |
Data shown as mean±SEM, number of animals (n) shown in parenthesis.
Total glucose clearance, glucose futile cycling and GFC % hepatic glucose production were similar in age matched F1 PNGR and F1 CON.
Insulin tolerance test
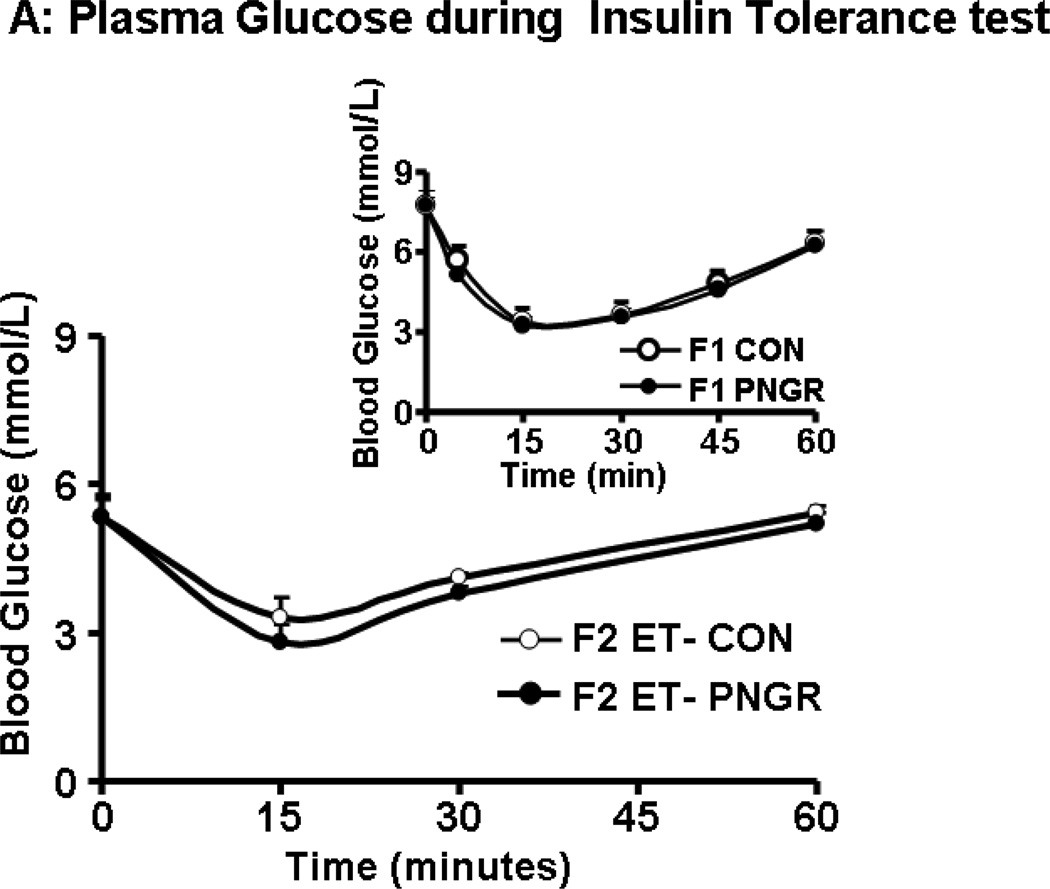
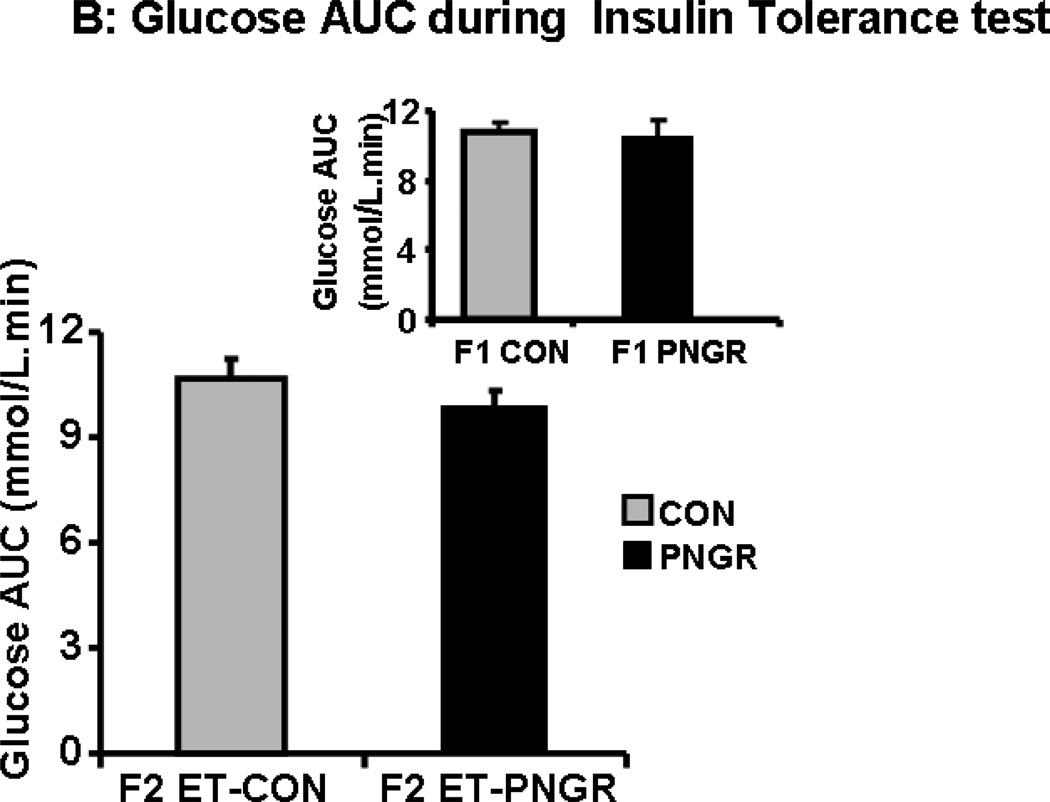
The plasma glucose concentrations measured at 15, 30 and 60 minutes in F2 embryo transfer PNGR group was similar to the F2 embryo transfer CON (Figure 4A and 4B). Both groups returned to the baseline plasma glucose concentration sixty minutes after the insulin challenge (11,15). Similarly, there was no change in response to an insulin challenge in both the F1 groups (15).
Figure 4.
A: The plasma glucose concentrations during Insulin tolerance tests are shown at baseline, 15, 30 and 60 minutes after insulin administration (0.75 U/kg) in F2 embryo 632transfer (ET)-PNGR (n=6) and F2 ET-CON (n=5). Inset showing plasma glucose 633concentrations during insulin tolerance test in age matched F1 CON (n=5) and F1 PNGR 634(n=6). Data shown as Mean±SEM. 4B: shows the plasma glucose concentration AUC for 63560 minutes during insulin tolerance tests in both groups. Inset showing AUC for plasma 636glucose concentrations during insulin tolerance test in age matched F1 CON (n=5) and F1 637PNGR (n=6). Data shown as Mean±SEM.
Discussion
Our present study reveals that the phenotype of a small, lean, hypoglycemic and hypoinsulinemic pregestational female F1 generation is not completely translated into the F2 female offspring when the F2 embryos are exposed to a control intra-uterine environment. Instead the F2 embryo transfer PNGR revealed a near normal phenotype with adequate adipose tissue stores and remnants of unsuppressed first phase hepatic glucose output contributing towards early phase mild hyperglycemia, with no overall change in total hepatic glucose output or glucose tolerance. This mild feature of no clinical consequence may be a result of a tendency towards reduced basal insulin concentrations which was however not evident in glucose stimulated insulin secretion (GSIS).
Unlike our present novel observations, when the F2 embryos are exposed to an F1 protein restricted PNGR intra-uterine environment as occurs in the naturally born rat offspring, the adult outcome of the F2 female offspring projects obesity, hyperglycemia and insulin resistance (14). The litter size was maintained at 6/litter in both the protein restricted PNGR F1 and naturally born F2 generations akin to our present study. Unlike the small but euglycemic, normoinsulinemic and normoleptinemic F1 females, the F2 PNGR females at 6 months of age were no different in body weight and nose to tail length but expressed increased fat mass, circulating glucose, HOMA-IR and leptin with a tendency towards hyperinsulinemia (14). This previous observation supports the premise that the F1 female intra-uterine environment sets the stage for the F2 female embryo to develop adult onset obesity, hyperglycemia and insulin resistance (14).
In addition to the intra-uterine environment, the postnatal suckling phase of development also plays a major role. Thus in a separate study of protein restriction during lactation in F0 rat mothers, when the litter size in both the F1 and naturally born F2 PNGR (CR) rat generations was maintained at 12/litter, while no change in body weight was evident in the F2 female offspring both at 110 and 270 days of life, the insulin sensitive state reflected by lower circulating insulin concentrations was maintained reflecting that of the F1 females (25). However a glucose tolerance test at 110 days of life yielded basal euglycemia, glucose tolerance, normal glucose induced insulin concentrations and insulin:glucose ratio AUC in the female F2 offspring (25). Hence this increased litter size led to additional nutritional stress only during the postnatal suckling period in both the F1 and F2 generations compounding the effects of a protein restricted diet during the suckling phase. Hence this study yielded an insulin sensitive state in the naturally born PNGR F2 female offspring that were themselves also subjected to nutritional restriction during the suckling phase by maintaining 12 pups/litter in this generation as well. In contrast, in our present study we were careful to ensure that the postnatal nutrition of F2 PNGR group was no different from that of the F2 CON group and the average litter size of 6 between the F1 and F2 generations were similar, having no independent effect. This made sure that any phenotypic changes noted in the F2 offspring were related to the change in the F1 intra-uterine environment alone and not related to any postnatal nutritional or litter size changes.
Our previous studies consisting of calorie restriction during the postnatal suckling phase of the F1 generation revealed small, lean, euglycemic, hypoinsulinemic females with no change in GSIS or other glucose kinetic parameters (15). This is in keeping with the observation that the β-cell fractional area and weight-adjusted β-cell mass in PNGR F1 females was approximately 30% higher than in control rats (26). Other previous investigations have demonstrated that any stress placed on this finely balanced metabolic adaptation in the hypoinsulinemic F1 PNGR female precipitates glucose intolerance. Examples include imposition of stress by repeated tail vein punctures (27) or a chronic but moderate exercise regimen (16) on the F1 female PNGR caused glucose intolerance. Therefore, it is possible that intermittent episodes of postprandial hyperglycemia during pregnancy may set the stage for adaptive changes responsible for the adult phenotype in the naturally born F2 PNGR female offspring as previously reported (14). While the effect of calorie restriction during the lactating period of the F0 generation was examined carefully in the F1 females, the impact on the F2 generation was not systematically examined. However, there is no reason to believe that the naturally born F2 PNGR phenotype would be any different from that previously described in the protein restricted naturally born F2 PNGR (CR) female phenotype of obesity, hyperglycemia and insulin resistance (20).
In contrast to the findings of these previous studies that define the phenotype of naturally born F2 generation, in our present study of calorie restriction during lactation with a litter size of 6/litter in both generations, we by-passed the F1 PNGR intra-uterine environment that may be punctuated with intermittent episodic post-prandial hyperglycemia, by transferring the embryos procreated by the F1 PNGR females into a control maternal environment. Upon this manipulation, the F2 embryo transfer PNGR female offspring failed to demonstrate obesity, hyperglycemia, hyperinsulinemia, hyperleptinemia or insulin resistance. In addition our systematic investigation of glucose kinetics using stable isotopes revealed no changes even in GSIS, HOMA-IR, glucose clearance and glucose cycling. While overall the F2 embryo transfer PNGR was glucose tolerant with no change in the hepatic glucose production, a first phase increase in HGP reflecting mild glucose intolerance with a tendency towards reduced GSIS and HOMA-IR compared to the sham F2 embryo transfer CON group, suggests the remnant presence of the hypoinsulinemic F1 PNGR phenotype of the biological procreating mother.
Thus, unlike the effect of calorie or protein restriction during gestation that affects the heritability of metabolic perturbations lending to the phenotype in the F2 generation and beyond (13), calorie or protein restriction during the suckling phase has a different effect. If purely due to heritability, the naturally born F2 PNGR would be expected to be hypoinsulinemic and insulin sensitive reflecting the mothers’ phenotype (F1 females). However, the detected transgenerational effect of postnatal calorie restriction appears to be due to the intra-uterine environmental effect perhaps related to intermittent postprandial hyperglycemic episodes. This is perhaps the reason for the naturally born F2 PNGR becoming obese, glucose intolerant and insulin resistant (14). Abolition of the F1 PNGR intra-uterine metabolic environment by embryo transfer near reversed the F2 phenotype towards normalcy, albeit modifying heritability. Remnants of heritability were evident even in the F2 embryo transfer PNGR perhaps in the form of an inability of insulin to suppress only the first phase hepatic glucose production.
Embryo transfer to a normal intra-uterine environment near erased the trans-generational persistence of glucose metabolic perturbations in the F2 embryo transfer PNGR female adult offspring. While the glucose intolerance of the F2 embryo transfer PNGR is minimal when compared to that observed in previously reported naturally born F2 PNGR female adult offspring (14), embryo transfer into a control environment protected the F2 generation from developing adiposity (fat mass), hyperleptinemia and hyperinsulinemia (14). The combined results of these two studies, namely that by Pinheiro et al (14) in naturally born F2 and our present study involving embryo transfer of the F2 generation, support a modifying role for an aberrant intra-uterine environment in the F1 PNGR generation in propagating the full blown glucose intolerant and visceral adiposity phenotype to the next generation (14). Since the only remnant derangement contributing to mild first phase glucose intolerance in the F2 embryo transfer PNGR is unsuppressed first phase hepatic glucose production, these findings support a reversal towards normalcy in the F2 embryo transfer PNGR female.
While transgenerational investigations are difficult in the human, there is accumulating evidence demonstrating a link between slow growth during infancy when imposed on low birth weight and the associated impaired glucose tolerance during adult life (3, 5). Similarly preterm infants (<1500g birth weight) who are consistently exposed to postnatal growth restriction (28) with subsequent excessive growth (28–31) suffer from glucose intolerance and insulin resistance as young adults. In cases where subsequent excessive growth does not set in, a condition akin to lipodystrophic diabetes mellitus consisting of reduced adipose tissue and circulating leptin concentrations develops related to early life malnutrition (32). Clinical and biochemical features of increased risk of polycystic ovary syndrome are also described in young adult females born with a low birth weight (33). Thus, there is a possibility that postnatal growth restriction in the human that sets the stage for glucose intolerance as an adult could potentially transmit this phenotype to the next generation. This transgenerational persistence of glucose intolerance may contribute to the present worldwide epidemic of type 2 diabetes mellitus. However, our present rat studies reveal that unlike the F2 progeny of F1 IUGR rats where epigenetics and heritability played major roles (11), this persistence into the next generation of metabolic derangements may be heavily influenced by the abnormal intra-uterine metabolic environment of the F1 PNGR mother.
In summary, we have demonstrated that embryo-transfer into a normal intrauterine environment of the F2 generation procreated by the postnatal calorie and growth restricted F1 rat mothers near abolished the transgenerational persistence of the overtly obese, glucose intolerant and insulin resistant phenotype. Unlike IUGR, PNGR contributes transgenerationally to the epidemic of type 2 diabetes mellitus because of an episodic aberrant gestational metabolic environment. Future studies assessing the metabolic phenotype of the naturally born F2 offspring to the calorie restricted F1 PNGR mother along with transfer of control embryos into an F1 PNGR intra-uterine environment is necessary to determine if an aberrant F2 metabolic phenotype can be induced to emerge.
While embryo transfer does take place in women as part of in-vitro fertilization and surrogacy, the clinical implication here is that even small, lean and hypoinsulinemic women who may appear metabolically normal are at high risk of transmitting a perturbed metabolic phenotype to their naturally born progeny. Hence pregnancies and the resultant offspring of women who have experienced postnatal growth restriction or slowing of growth during early infancy, either due to prematurity/neonatal or infantile illness (resourced countries) or malnutrition (under resourced countries), should be monitored for metabolic abnormalities that will perhaps ultimately contribute towards the trans-generational persistence and burden of the world-wide epidemic of diabetes mellitus.
Acknowledgements
We acknowledge the assistance of Frank Sangiorgi, Ph.D. in the embryo transfer experiments and Shanthie Thamotharan, B.V.Sc. in the intravenous placement of catheters in the F1 animals.
Funding: This work was supported by grants from NIH-HD41230 and HD-25024 (PI-Sherin U. Devaskar)
Abbreviations
- ET
Embryo Transfer
- CON
Control group with ad lib access to calories
- PNGR
Postnatal growth restriction
- GSIS
Glucose-stimulated insulin secretion
- HGP
Hepatic glucose production
- AUC
Area under the curve
- IVGTT
Intravenous glucose tolerance test
- WAT
White adipose tissue
- GC/MS
Gas chromatography/mass spectrometry
Footnotes
Publisher's Disclaimer: This is a PDF file of an unedited manuscript that has been accepted for publication. As a service to our customers we are providing this early version of the manuscript. The manuscript will undergo copyediting, typesetting, and review of the resulting proof before it is published in its final citable form. Please note that during the production process errors may be discovered which could affect the content, and all legal disclaimers that apply to the journal pertain.
Disclosure Statement: - The authors of this manuscript have no potential conflicts of interest
Author Contributions
Meena Garg performed and assisted in glucose tolerance tests, Gas chromatography/mass spectrometry (GC/MS) analysis of two isotopes, [2-2H]- and [6,6-2H2]-glucose, insulin, leptin, undertook data analysis and wrote the first draft of the manuscript.
Manikkavasagar Thamotharan performed embryo transfer surgeries, placed catheters for IVGTT, assisted with glucose tolerance tests, insulin tolerance tests, provided assistance with creating the animal model, weight monitoring and dietary interventions.
Yun Dai assisted with glucose tolerance tests and provided assistance with creating the animal model, weight monitoring and dietary interventions.
Paul W.N. Lee provided guidance in performing glucose tolerance tests using stable isotopes and laboratory support for GCMS analysis of glucose isotopes.
Sherin U. Devaskar developed the animal model and the study design for this investigation, provided ongoing guidance with multiple discussions and oversight for the entire study design and methods that were performed in her laboratory. She critically reviewed the analyses and results, re-wrote the introduction, presentation of observations and discussion sections and edited multiple drafts of the manuscript.
References
- 1.Barker DJ. Adult consequences of fetal growth restriction. Clin Obstet Gynecol. 2006;49(2):270–283. doi: 10.1097/00003081-200606000-00009. [DOI] [PubMed] [Google Scholar]
- 2.Hales CN, Desai M, Ozanne SE, Crowther NJ. Fishing in the stream of diabetes: from measuring insulin to the control of fetal organogenesis. 1996;24(2):341–350. doi: 10.1042/bst0240341. [DOI] [PubMed] [Google Scholar]
- 3.Eriksson JG, Osmond C, Kajantie E, Forsen TJ, Barker DJ. Patterns of growth among children who later develop type 2 diabetes or its risk factors. Diabetologia. 2006;49(12):2853–2858. doi: 10.1007/s00125-006-0459-1. [DOI] [PubMed] [Google Scholar]
- 4.Barker DJ, Osmond C, Forsen TJ, Kajantie E, Eriksson JG. Trajectories of growth among children who have coronary events as adults. N Engl J Med. 2005;353(17):1802–1809. doi: 10.1056/NEJMoa044160. [DOI] [PubMed] [Google Scholar]
- 5.Nobili V, Alisi A, Panera N, Agostoni C. Low birth weight and catch-upgrowth associated with metabolic syndrome: a ten year systematic review. Pediatr Endocrinol Rev. 2008;6(2):241–247. [PubMed] [Google Scholar]
- 6.Rotteveel J, van Weissenbruch MM, Twisk JW, Delemarre-Van de Waal HA. Infant and childhood growth patterns, insulin sensitivity, and blood pressure in prematurely born young adults. Pediatrics. 2008;122(2):313–321. doi: 10.1542/peds.2007-2012. [DOI] [PubMed] [Google Scholar]
- 7.Veening MA, Van Weissenbruch MM, Delemarre-Van De Waal HA. Glucose tolerance, insulin sensitivity, and insulin secretion in children born small for gestational age. J Clin Endocrinol Metab. 2002;87(10):4657–4661. doi: 10.1210/jc.2001-011940. [DOI] [PubMed] [Google Scholar]
- 8.Painter RC, Osmond C, Gluckman P, Hanson M, Phillips DI, Roseboom TJ. Transgenerational effects of prenatal exposure to the Dutch famine on neonatal adiposity and health in later life. BJOG. 2008;115(10):1243–1249. doi: 10.1111/j.1471-0528.2008.01822.x. [DOI] [PubMed] [Google Scholar]
- 9.Boloker J, Gertz SJ, Simmons RA. Gestational diabetes leads to the development of diabetes in adulthood in the rat. Diabetes. 2002;51(5):1499–1506. doi: 10.2337/diabetes.51.5.1499. [DOI] [PubMed] [Google Scholar]
- 10.Gill-Randall R, Adams D, Ollerton RL, Lewis M, Alcolado JC. Type 2 diabetes mellitus--genes or intrauterine environment? An embryo transfer paradigm in rats. Diabetologia. 2004;47(8):1354–1359. doi: 10.1007/s00125-004-1464-x. [DOI] [PubMed] [Google Scholar]
- 11.Thamotharan M, Garg M, Oak S, Rogers LM, Pan G, Sangiorgi F, Lee PW, Devaskar SU. Transgenerational inheritance of the insulin-resistant phenotype in embryo-transferred intrauterine growth-restricted adult female rat offspring. Am J Physiol Endocrinol Metab. 2007;292(5):E1270–E1279. doi: 10.1152/ajpendo.00462.2006. [DOI] [PubMed] [Google Scholar]
- 12.Aerts L, Van Assche FA. Islet transplantation in diabetic pregnant rats normalizes glucose homeostasis in their offspring. J Dev Physiol. 1992;17(6):283–287. [PubMed] [Google Scholar]
- 13.Thamotharan M, McKnight RA, Thamotharan S, Kao DJ, Devaskar SU. Aberrant insulin-induced GLUT4 translocation predicts glucose intolerance in the offspring of a diabetic mother. Am J Physiol Endocrinol Metab. 2003;284(5):E901–E914. doi: 10.1152/ajpendo.00516.2002. [DOI] [PubMed] [Google Scholar]
- 14.Pinheiro AR, Salvucci ID, Aguila MB, Mandarim-de-Lacerda CA. Protein restriction during gestation and/or lactation causes adverse transgenerational effects on biometry and glucose metabolism in F1 and F2 progenies of rats. Clin Sci (Lond) 2008;114(5):381–392. doi: 10.1042/CS20070302. [DOI] [PubMed] [Google Scholar]
- 15.Garg M, Thamotharan M, Rogers L, Bassilian S, Lee WN, Devaskar SU. Glucose Metabolic Adaptations in the Intra-Uterine Growth Restricted Adult Female Rat Offspring. Am J Physiol Endocrinol Metab. 2006 doi: 10.1152/ajpendo.00474.2005. [DOI] [PubMed] [Google Scholar]
- 16.Garg M, Thamotharan M, Oak SA, Pan G, Maclaren DC, Lee PW, Devaskar SU. Early exercise regimen improves insulin sensitivity in the intrauterine growth-restricted adult female rat offspring. Am J Physiol Endocrinol Metab. 2009;296(2):E272–E281. doi: 10.1152/ajpendo.90473.2008. [DOI] [PMC free article] [PubMed] [Google Scholar]
- 17.Garg M, Thamotharan M, Pan G, Lee PW, Devaskar SU. Early Exposure of the Pregestational Intrauterine and Postnatal Growth Restricted Female Offspring to a Peroxisome Proliferator-Activated Receptor {gamma} Agonist. Am J Physiol Endocrinol Metab. 2009 doi: 10.1152/ajpendo.00361.2009. [DOI] [PMC free article] [PubMed] [Google Scholar]
- 18.Reece EA, Homko C, Wiznitzer A. Metabolic changes in diabetic and nondiabetic subjects during pregnancy. Obstet Gynecol Surv. 1994;49(1):64–71. doi: 10.1097/00006254-199401000-00027. [DOI] [PubMed] [Google Scholar]
- 19.Yasuhi I, Ishimaru T, Hirai M, Yamabe T. Hourly fetal urine production rate in the fasting and the postprandial state of normal and diabetic pregnant women. Obstet Gynecol. 1994;84(1):64–68. [PubMed] [Google Scholar]
- 20.Szafranek J, Pfaffenberger CD, Horning EC. The mass spectra of some per-O-acetylaldononitriles. Carbohydr Res. 1974;38:97–105. doi: 10.1016/s0008-6215(00)82341-1. [DOI] [PubMed] [Google Scholar]
- 21.Xu J, Chang V, Joseph SB, Trujillo C, Bassilian S, Saad MF, Lee WN, Kurland IJ. Peroxisomal proliferator-activated receptor alpha deficiency diminishes insulin-responsiveness of gluconeogenic/glycolytic/pentose gene expression and substrate cycle flux. Endocrinology. 2004;145(3):1087–1095. doi: 10.1210/en.2003-1173. [DOI] [PubMed] [Google Scholar]
- 22.Lee WN, Byerley LO, Bergner EA, Edmond J. Mass isotopomer analysis: theoretical and practical considerations. Biol Mass Spectrom. 1991;20(8):451–458. doi: 10.1002/bms.1200200804. [DOI] [PubMed] [Google Scholar]
- 23.Katz J, Dunn A, Chenoweth M, Golden S, Determination of synthesis. recycling and body mass of glucose in rats and rabbits in vivo 3H-and 14C-labelled glucose. Biochem J. 1974;142(1):171–183. doi: 10.1042/bj1420171. [DOI] [PMC free article] [PubMed] [Google Scholar]
- 24.Xu J, Lee WN, Xiao G, Trujillo C, Chang V, Blanco L, Hernandez F, Chung B, Makabi S, Ahmed S, Bassilian S, Saad M, Kurland IJ. Determination of a glucose-dependent futile recycling rate constant from an intraperitoneal glucose tolerance test. Anal Biochem. 2003;315(2):238–246. doi: 10.1016/s0003-2697(02)00709-1. [DOI] [PubMed] [Google Scholar]
- 25.Zambrano E, Bautista CJ, Deas M, Martinez-Samayoa PM, Gonzalez-Zamorano M, Ledesma H, Morales J, Larrea F, Nathanielsz PW. A low maternal protein diet during pregnancy and lactation has sex- and window of exposure-specific effects on offspring growth and food intake, glucose metabolism and serum leptin in the rat. J Physiol. 2006;571(Pt 1):221–230. doi: 10.1113/jphysiol.2005.100313. [DOI] [PMC free article] [PubMed] [Google Scholar]
- 26.Matveyenko AV, Singh I, Shin BC, Georgia S, Devaskar SU. Differential effects of prenatal and postnatal nutritional environment on ss-cell mass development and turnover in male and female rats. Endocrinology. 151(12):5647–5656. doi: 10.1210/en.2010-0978. [DOI] [PMC free article] [PubMed] [Google Scholar]
- 27.Thamotharan M, Shin BC, Suddirikku DT, Thamotharan S, Garg M, Devaskar SU. GLUT4 expression and subcellular localization in the intrauterine growth-restricted adult rat female offspring. Am J Physiol Endocrinol Metab. 2005;288(5):E935–E947. doi: 10.1152/ajpendo.00342.2004. [DOI] [PubMed] [Google Scholar]
- 28.Hovi P, Andersson S, Eriksson JG, Jarvenpaa AL, Strang-Karlsson S, Makitie O, Kajantie E. Glucose regulation in young adults with very low birth weight. N Engl J Med. 2007;356(20):2053–2063. doi: 10.1056/NEJMoa067187. [DOI] [PubMed] [Google Scholar]
- 29.Hay WW., Jr Nutrient supplies for optimal health in preterm infants. J Pediatr Gastroenterol Nutr. 2007;45(Suppl 3):S163–S169. doi: 10.1097/01.mpg.0000302965.93546.b8. [DOI] [PubMed] [Google Scholar]
- 30.Regan FM, Cutfield WS, Jefferies C, Robinson E, Hofman PL. The impact of early nutrition in premature infants on later childhood insulin sensitivity and growth. Pediatrics. 2006;118(5):1943–1949. doi: 10.1542/peds.2006-0733. [DOI] [PubMed] [Google Scholar]
- 31.Finken MJ, Keijzer-Veen MG, Dekker FW, Frolich M, Hille ET, Romijn JA, Wit JM. Preterm birth and later insulin resistance: effects of birth weight and postnatal growth in a population based longitudinal study from birth into adult life. Diabetologia. 2006;49(3):478–485. doi: 10.1007/s00125-005-0118-y. [DOI] [PubMed] [Google Scholar]
- 32.Mantzoros CS. Leptin in relation to the lipodystrophy-associated metabolic syndrome. Diabetes Metab J. 36(3):181–189. doi: 10.4093/dmj.2012.36.3.181. [DOI] [PMC free article] [PubMed] [Google Scholar]
- 33.Pandolfi C, Zugaro A, Lattanzio F, Necozione S, Barbonetti A, Colangeli MS, Francavilla S, Francavilla F. Low birth weight and later development of insulin resistance and biochemical/clinical features of polycystic ovary syndrome. Metabolism. 2008;57(7):999–1004. doi: 10.1016/j.metabol.2008.02.018. [DOI] [PubMed] [Google Scholar]


