Abstract
Purpose:
To analyze the spatial distribution and temporal development of liver tissue contraction during high-temperature ablation by using intraprocedural computed tomography (CT) imaging.
Methods:
A total of 46 aluminum fiducial markers were positioned in a 60 × 45 mm grid, in a single plane, around a microwave ablation antenna in each of six ex vivo bovine liver samples. Ablations were performed for 10 min at 100 W. CT data of the liver sample were acquired every 30 s during ablation. Fiducial motion between acquisitions was tracked in postprocessing and used to calculate measures of tissue contraction and contraction rates. The spatial distribution and temporal evolution of contraction were analyzed.
Results:
Fiducial displacement indicated that the zone measured postablation was 8.2 ± 1.8 mm (∼20%) smaller in the radial direction and 7.1 ± 1.0 mm (∼10%) shorter in the longitudinal direction than the preablation tissue dimension. Therefore, the total ablation volume was reduced from its preablation value by approximately 45%. Very little longitudinal contraction was noted in the distal portion of the ablation zone. Central tissues contracted more than 60%, which was near an estimated limit of ∼70% based on initial water content. More peripheral tissues contracted only 15% in any direction. Contraction rates peaked during the first 60 s of heating with a roughly exponential decay over time.
Conclusions:
Ablation zones measured posttreatment are significantly smaller than the pretreatment tissue dimensions. Tissue contraction is spatially dependent, with the greatest effect occurring in the central ablation zone. Contraction rate peaks early and decays over time.
Keywords: thermal ablation, microwave ablation, computed tomography, tissue contraction, tissue shrinking
1. INTRODUCTION
Image-guided interventional therapies have gained substantial attention as nonsurgical means for tumor destruction.1–3 Thermal ablation is one such procedure in which a needlelike device is inserted under image guidance (e.g., ultrasound, computed tomography (CT), or magnetic resonance imaging) and delivers energy directly to the surrounding tissue.4–7 Energy types include radiofrequency, microwave, laser or ultrasound waves, and cryogenic cooling.8–12 Among those ablation techniques, radiofrequency and microwave ablations are the two most widely adopted and studied to date.13–16 Both radiofrequency and microwave ablations have been shown to provide a survival benefit in treating primary liver cancer, hepatic metastases, renal cell carcinoma, and benign lesions.17–24
The volume of ablated tissue is the primary metric used to evaluate the technical success of ablation procedures. Many vendors provide guidelines that predict ablation zone size for various combinations of power, time, and applicator design. Most of those guidelines and independent studies of ablation devices or ablation zone growth to aid treatment planning were produced from experiments in ex vivo tissue models.25–28 However, two recent studies29,30 from separate groups have highlighted the fact that dehydration and collagen shrinking resulting from thermal ablation lead to shrinkage of the treated tissue volume. The appearance of ablation zones measured postablation reflects the shrunken volume, not the original tissue volume. Therefore, postablation dimensional measurements may underestimate the original tissue dimensions by 10%–50% depending on tissue type and thermal exposure.29,30 Contraction has also been positively correlated with local tissue dehydration so contraction is especially relevant in the analysis of microwave ablations.29
While previous studies have begun to characterize the changes in tissue morphology due to thermal ablation, they have been limited in scope. For example, the previous techniques included only a single diametric contraction metric inferred by comparing ablated and unablated samples. They did not evaluate the temporal evolution of contraction nor did they provide spatial analysis of contraction throughout the ablation zone.29,30 Other studies have characterized the shrinking of collagen in response to a thermal insult and developed models of shrinking based on temperature and exposure time, but those studies did not pertain to parenchymal tissue such as liver, lung, and kidney.31–34 More recently, a shrinkage model of liver was proposed based on isothermal and surface contraction measurements but which did not account for the impact of water vaporization during tumor ablation procedures.35 An improved knowledge of the mechanism, history, and practical effects of tissue contraction is required to better understand ablation zone growth, translate ex vivo and in vivo study results into a clinical setting, aid in treatment planning, and more accurately assess treatment outcomes. Therefore, the purpose of our study was to analyze the spatial distribution and temporal development of liver tissue contraction during high-temperature ablation by using intraprocedural CT imaging.
2. MATERIALS AND METHODS
2.A. Experimental setup
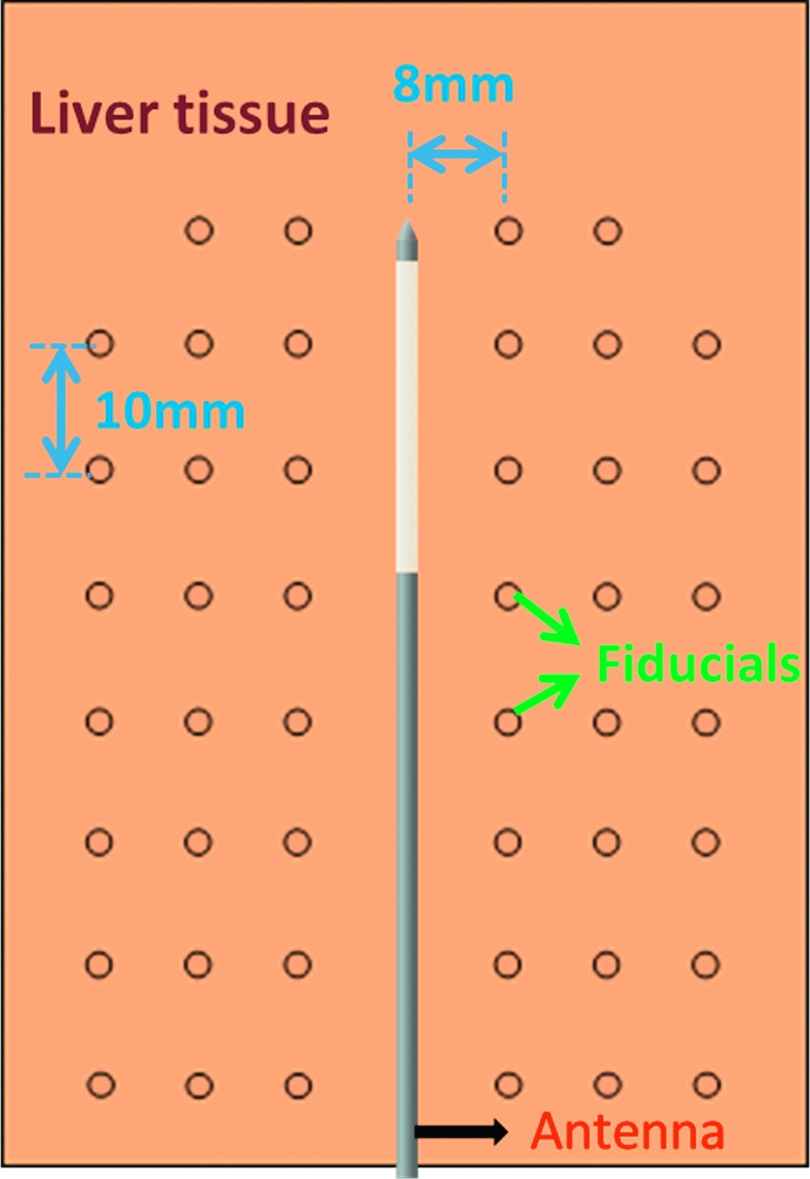
A total of six freshly harvested bovine livers were cut into 10 × 8 × 4 cm blocks, which were tightly bound in plastic and stored for up to 24 h at 4 °C–6 °C. In each sample, 46 Al fiducials of 1 mm diameter were inserted through six biopsy needles fixed 8 mm apart in a single plane. A microwave antenna (LK 15; NeuWave Medical, Inc., Madison, WI) was first inserted into the center of the fiducial grid (Fig. 1). The fiducials were then placed by inserting the needles to the distal aspect of the antenna, dropping a fiducial in each needle, withdrawing the needles 10 mm, and repeating so that the grid covered an approximately 60 × 48 mm area in the tissue coplanar with the antenna. Each sample was placed onto the bed of a 64-slice CT scanner (750 HD; GE Healthcare, Waukesha, WI) with the antenna and fiducial marker plane parallel to the bed. A continuous generator output of 100 W at 2.45 GHz (Certus 140; NeuWave Medical, Madison, WI) was applied for 10 min. After cables losses were considered, the estimated power delivery to the tissue sample was 55–60 W.
FIG. 1.
Experimental setup illustration. Fiducials were inserted into liver tissue around the antenna in a single plane parallel with the scanning bed. Tissue contraction was analyzed by measuring fiducial displacement over time.
2.B. CT image processing
Helical CT data were acquired over the entire sample volume every 30 s during the ablation (512 × 512, 15 cm field of view, 120 KVp, 200 mA, 0.625 mm slice thickness, 0.531:1 pitch). To prevent streak artifacts around the antenna from compromising fiducial detection, all CT volumes were preprocessed using a metal artifact reduction tool similar to that described by Boas and Fleischmann.36 Coronal maximum intensity projection (MIP) images at each time point were then generated with a resolution of 10 pixels/mm for further image processing. Fiducials were segmented from MIP images by basic thresholding and their centroids indexed using matlab (2013a, Mathworks, Natick, MA).
Fiducial displacements were then detected by block matching.37 Briefly, template blocks were formed around the geometric centroid of each fiducial in each image. For each fiducial-centered block, a search was conducted within a constrained window of a practical maximum displacement of 32 pixels (3.2 mm) in the previous frame of image to get a best matching block. The displacement of the two blocks was taken to represent fiducial motion, and finally displacement vector maps were created by interpolating discrete fiducial displacements onto a full 2D grid.
2.C. Postablation analysis
After ablation, each liver sample was bisected along the coronal plane, and each side scanned optically (Epson Perfection v200, Long Beach, CA). The diameter and length of each ablation zone were measured manually with an estimated maximum error of 1 mm. The volume of ablation, V, was estimated by assuming the ablated tissue as an ellipsoid
| (1) |
where D is the diameter (transverse to the antenna) and L is the length (along the antenna) of the ablation zone.
2.D. Spatial contraction analysis
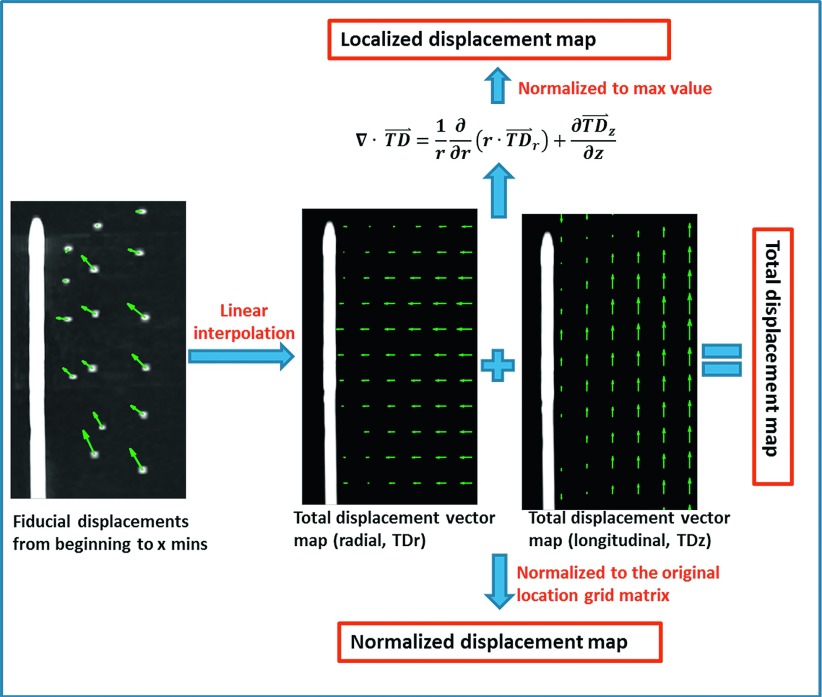
A composite dataset was compiled by averaging interpolated displacement maps over all samples at each time point. Displacement vector maps were separated into the two orthogonal cylindrical components, radial (transverse to the antenna) and longitudinal (along the antenna), and a displacement magnitude map. Analyses were then conducted on these maps separately as described below (Fig. 2).
FIG. 2.
Contraction metrics evaluated in this study included total, normalized, and localized displacements in both radial and longitudinal directions, along with a vector magnitude.
To allow more detailed analysis of the spatial aspects of contraction, three distinct metrics were developed. Total displacement (TD⃑) was defined as the gross mean displacement between the beginning of the ablation and each time point. Since this metric was weighted toward locations farther from the ablation center, we defined two more spatially precise metrics. Normalized displacement (ND⃑) was defined as the ratio of the total displacement (TD) to the original position (OP) grid before moving
| (2) |
where t is the time point index, and r and z are the radial and longitudinal indices, respectively. Localized displacement (LD) was defined as the normalized divergence of the total displacement in terms of percentage
| (3) |
where the divergence form was assumed from an axisymmetric cylindrical coordinate system
| (4) |
Localized displacement was calculated to elucidate the tissue contraction of individual points within the ablation zone.
2.E. Temporal contraction analysis
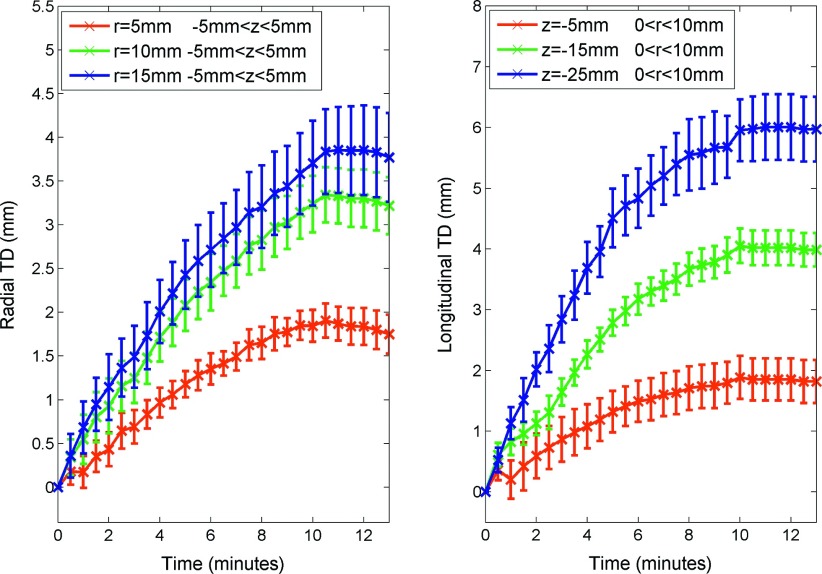
To evaluate the temporal development of tissue contraction, the interpolated total displacement and normalized displacement (ND) of each sample were measured at every 30 s during the ablation. The average displacements over time were compared at the different labeled regions radially (5, 10, and 15 mm away from the antenna) and longitudinally (5, 15, and 25 mm proximally to the radiating segments).
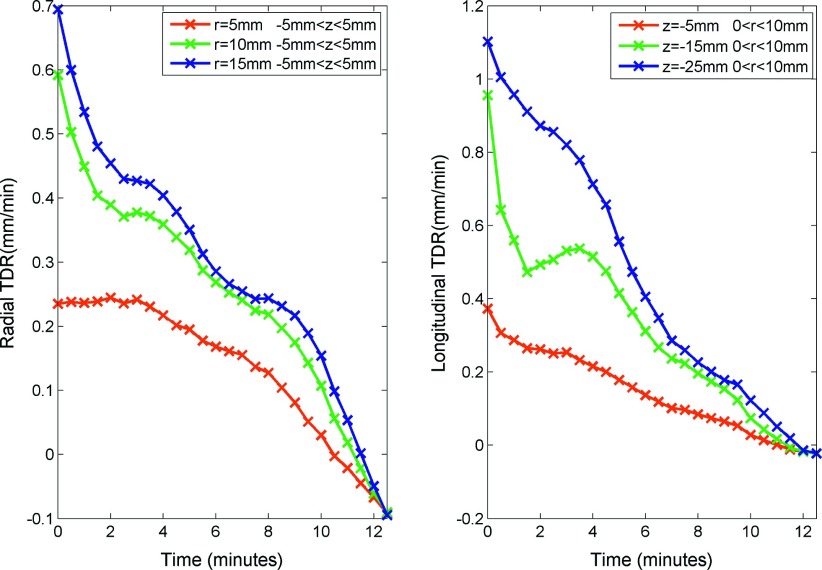
Two new metrics were developed after the curve fitting and the smoothing operations of the displacements over time. Total displacement rate (TDR) was defined as total displacement (mm) per time interval
| (5) |
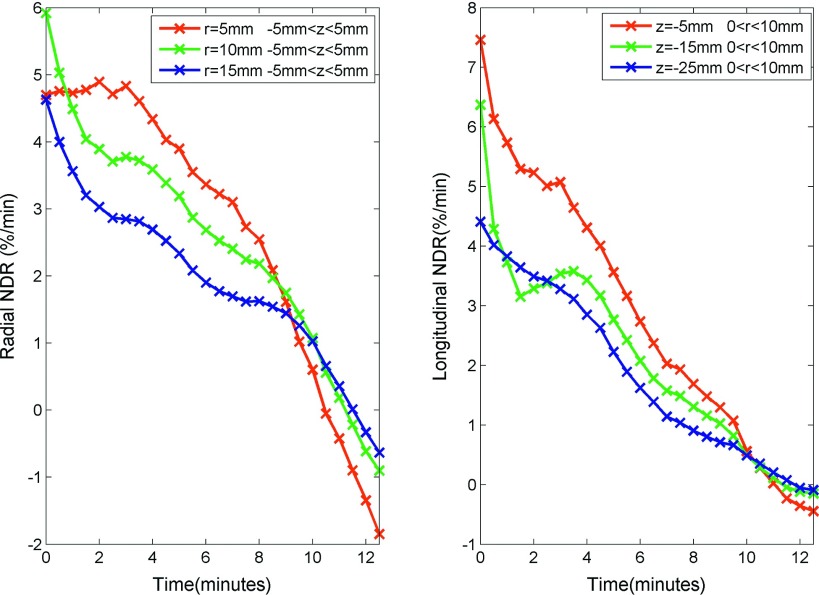
Similarly, normalized displacement rate (NDR) was defined as the normalized displacement (%) per time interval
| (6) |
Both metrics were compared and analyzed at each time point to evaluate temporal evolution of the tissue contraction rate.
3. RESULTS
3.A. Qualitative observations
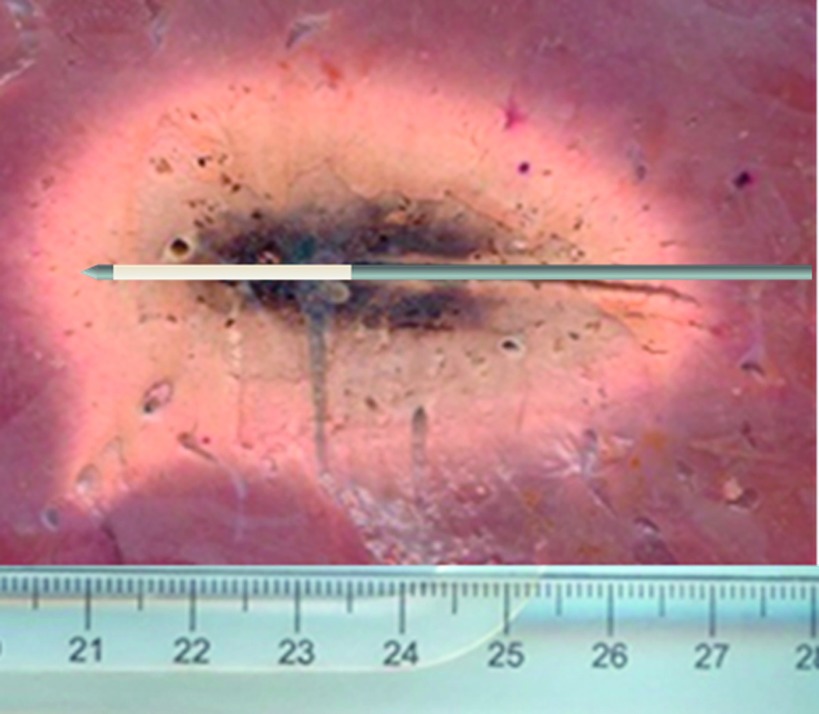
Mean ablation zone size as measured on postablation gross pathology sections was 64.5 ± 3.6 mm in length and 38.8 ± 2.0 mm in diameter (Fig. 3).
FIG. 3.
Representative ablation zone as measured from postablation sectioning. The ablation zone measured 6.5 cm in length and 4 cm in diameter.
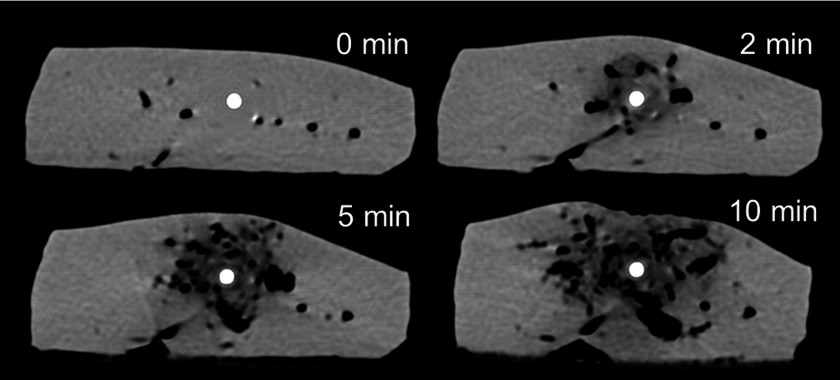
During the ablation, the entire tissue sample was observed to shorten horizontally and extend slightly vertically in the axial imaging plane. Aluminum fiducials had an attenuation of 600–800 HU that was stable over a range of temperatures so were distinguishable from the tissue (∼40–60 HU), ablation zone (<40 HU), and the treatment antenna (>2500 HU) on CT images. Ablation zones appeared hypodense (Fig. 4) with a central zone of very low attenuation (−400∼−100 HU) corresponding to vaporized water and a more peripheral zone of low attenuation (−100∼20 HU) corresponding to small amounts of vapor as well as thermal expansion of the tissue water.38,39 Substantial water vapor was produced even at early time points. The water vapor zone expanded and diffused radially over time (Fig. 4).
FIG. 4.
Axial CT images acquired 0, 2, 5, and 10 min during microwave ablation. Vapor generated around the antenna is notable, with growth and diffusion from central (around the antenna) to peripheral regions (distant from the antenna).
3.B. Spatial analysis
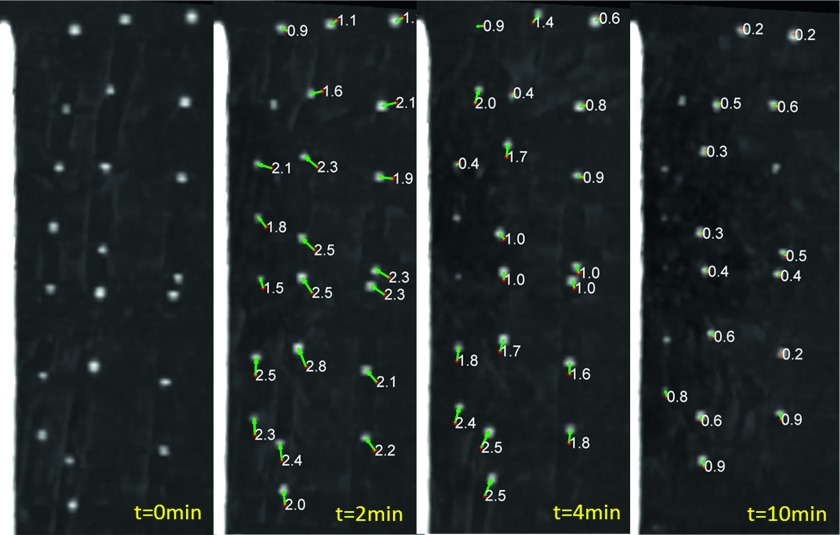
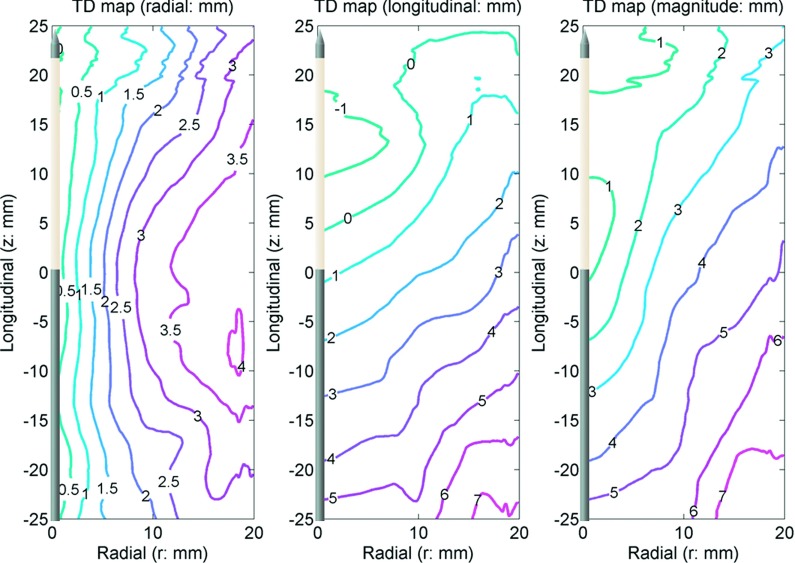
Contraction was observed by fiducial marker displacements between each time point (Fig. 5). The final radial component, longitudinal component, and magnitude of the total displacement are shown in Fig. 6. For the radial component, total displacement increased with increasing radial distance from the antenna. The greatest radial displacement occurred at 18 mm (approximately at the edge of the ablation zone measured on postablation pathology) away from the antenna with a peak value of 4.1 ± 0.9 mm (mean + standard error of the mean). In the longitudinal direction, total displacement was negligible in the region distal to the antenna radiating segment (∼25 mm proximal to the antenna tip). However, total longitudinal displacement followed a trend similar to radial displacement proximal to the radiating segment. The greatest longitudinal contraction occurred 50 mm proximal to the antenna tip (z = − 25 mm) with a peak value of 7.1 ± 1.0 mm. As a result, the total displacement magnitude peaked to 7.6 ± 1.2 mm near r = 18 mm and z = − 25 mm.
FIG. 5.
Coronal MIP images highlighting fiducial displacement during microwave ablation. Fiducials are visible as white points. The arrows show displacement vectors between time frames and are labeled with displacement magnitude in millimeters. Qualitatively, there was an overall trend of greater displacement rate early on, with decreasing effect over time.
FIG. 6.
TD in the radial (left) and longitudinal (center) directions with the vector magnitude (right). The antenna was located along the z axis. The origin (r = 0, z = 0) is approximately at the center of the ablation zone. The numbers in the figures show total displacement in millimeters. Positive numbers represent movement toward the origin.
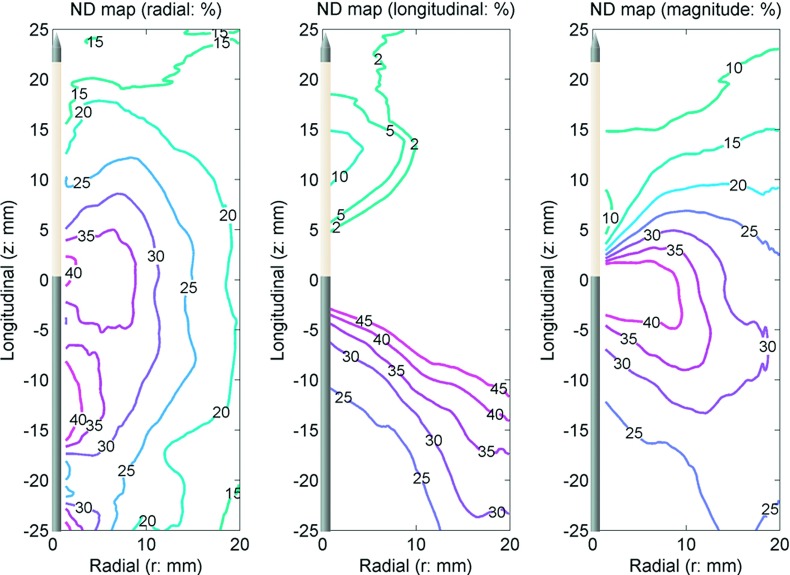
Contrary to total displacement and consistent with the objective of observing displacements relative to initial position, normalized displacements decreased with increasing separation from the ablation center (Fig. 7). The greatest normalized displacement magnitude of 40% occurred near the center of the ablation zone and then decreased to 20% at 15 mm radially from the antenna. Since the normalized displacements metric is relative to initial position, evidence of numerical singularities near r = 0 and z = 0 are evident in the normalized displacement maps.
FIG. 7.
ND in the radial (left) and longitudinal (center) directions with the vector magnitude (right). The antenna was located along the z axis. The origin (r = 0, z = 0) is approximately at the center of the ablation zone. The numbers in the figures show normalized displacement in percent. Positive numbers represent movement toward the origin. Singularities occurred in the longitudinal component near z = 0 so the longitudinal normalized displacement only shows the range from 5% to 45%.
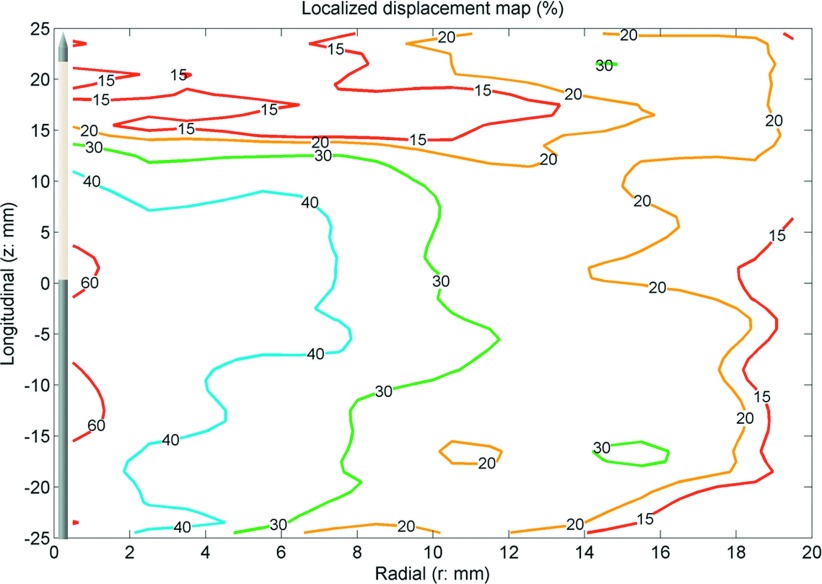
Similar to normalized displacement, the greatest localized displacement magnitude occurred near the center of the ablation zone and decreased in the peripheral ablation zone (Fig. 8). Localized displacement described the local contribution to total tissue contraction. It showed that regions near the center of the ablation zone contracted by approximately 60% while peripheral regions contracted only around 15%.
FIG. 8.
LD. The antenna was located along the z axis. The origin (r = 0, z = 0) is approximately at the center of the ablation zone. The numbers in the figures show localized displacement in percent. Positive numbers represent movement toward the origin. The map showed central regions contracted more than 60%, with a decreasing effect distant to the antenna.
3.C. Temporal analysis
Total displacement was most rapid at beginning of the ablation, with slowing development over time (Fig. 9). After ablation, the total displacement slightly decreased from the peak at 10 min, representing a small amount of tissue expansion (∼0.1–0.2 mm). Approximately 63% of total displacement occurred during the first 4–5 min of ablation (Table I). Accordingly, the total displacement rate peaked early on and decreased over time (Fig. 10). The maximum total displacement rates at radial distances of 5, 10, and 15 mm were 0.36, 0.68, and 0.71 mm/min, respectively. While maximum total displacement rates 5, 15, and 25 mm proximal to the radiating segment were 0.71, 1.22, and 1.21 mm/min, respectively (Table I).
FIG. 9.
TD in the radial (left) and longitudinal directions (right) vs time. Data shown as mean total displacement with error bars representing the standard error of the mean.
TABLE I.
Temporal evolution of tissue contraction during microwave ablation. Data provided as mean ± standard error of the mean.
| Total displacement | Normalized displacements | Total displacement rate | Normalized displacement rate | |||
|---|---|---|---|---|---|---|
| Location (mm) | Peak (mm) | T63% (min)a | Peak (%) | T63% (min) | Peak (mm/min) | Peak (%/min) |
| Radially | ||||||
| r = 5 | 1.90 ± 0.19 | 5.0 | 38.1 ± 3.9 | 5.0 | 0.36 ± 0.29 | 7.12 ± 5.94 |
| r = 10 | 3.34 ± 0.32 | 5.0 | 33.4 ± 3.1 | 5.0 | 0.68 ± 0.40 | 6.82 ± 4.09 |
| r = 15 | 3.83 ± 0.48 | 4.5 | 25.6 ± 3.6 | 5.0 | 0.71 ± 0.49 | 4.77 ± 3.32 |
| Longitudinally | ||||||
| z = − 5 | 1.88 ± 0.35 | 4.5 | 37.6 ± 7.1 | 4.5 | 0.71 ± 0.29 | 14.30 ± 6.74 |
| z = − 15 | 4.05 ± 0.28 | 4.5 | 27.0 ± 1.9 | 4.5 | 1.22 ± 0.33 | 8.14 ± 2.60 |
| z = − 25 | 6.00 ± 0.54 | 4.0 | 23.9 ± 2.1 | 4.0 | 1.21 ± 0.12 | 4.20 ± 1.63 |
T63% is the time to reach 63% of the peak value.
FIG. 10.
TDR in the radial (left) and longitudinal directions (right) vs time. Total displacement rate was acquired from the first order temporal derivative of the total displacements after a smoothing operation. The figure shows total displacement rate peaked at the first minute and decayed over time.
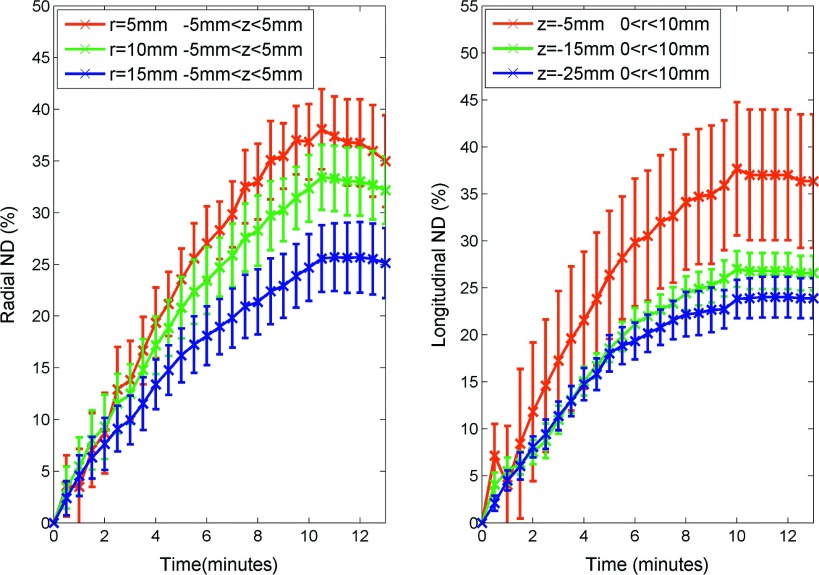
Similar to total displacement, normalized displacement increased rapidly near the beginning of the ablation and slowed over time with a slight expansion after heating ceased (Fig. 11). Again, approximately 63% of normalized displacement occurred during the first 4–5 min (Table I). The rate of normalized displacement followed a similar trend to total displacement rate, which peaked at the beginning and decayed over time (Fig. 12). In contrast to total displacement, the central region had a greater normalized displacement and a greater normalized displacement rate than the peripheral regions. The maximum normalized displacement rates at radial distances of 5, 10, and 15 mm were 7.12, 6.82, and 4.77%/min, respectively. While maximum normalized displacement rates 5, 15, and 25 mm proximal to the radiating segment were 14.30, 8.14, and 4.20%/min, respectively (Table I).
FIG. 11.
ND in the radial (left) and longitudinal directions (right) vs time. Data shown as mean normalized displacement with error bars representing the standard error of the mean.
FIG. 12.
NDR in the radial (left) and longitudinal directions (right) vs time. Normalized displacement rate was acquired from the first order temporal derivative of the normalized displacements after a smoothing operation. It shows total displacement rate peaked in the first minute and decayed over time.
4. DISCUSSION
Tissue contraction can be a substantial factor in ablation growth that may confound the analysis of ablation device performance or clinical results. In the present study, CT imaging was used to evaluate tissue contraction during microwave ablation. Spatial analysis showed that tissue contraction reduced ablation diameter by 8–8.5 mm (20%–22%) and reduced ablation length by 7–8 mm (10%–12%). Therefore, the total ablation volume was reduced from its preablation value by approximately 45%. Tissue contraction was greatest near the center of the ablation zone, while locations at the edge of the ablation zone encountered less contraction in general. Temporal analysis suggested contraction rate peaked in the first 60 s, and then decayed over time.
Collagen shrinkage and water dehydration were believed as the most possible reason that caused tissue contraction.29,30,33,35 Since the liver samples adopted in the study have very low collagen content (1.8%–2.1% in normal liver40) and very high water content (over 70%), water vaporization was assumed to be the dominant factor in tissue contraction. Temperatures measured during high-power microwave ablation can exceed 100 °C, causing local tissue water to transition into a gas phase that was visible on CT images. Vaporization was most prevalent in the central part of the ablation where temperatures are known to be the highest.41 The water vapor then diffused along the temperature gradient into more peripheral regions. Therefore, it is likely that the volume occupied by water vapor collapsed (potentially due to collagen shrinkage), leaving the contracted and dehydrated tissue behind.
The CT imaging technique used in this study allowed more complete analysis of contraction around an ablation zone. Total displacement and normalized displacement were commensurate with similar measurements from previous studies.29,30 Additionally, localized displacement represented the contraction in each unique spatial region in the ablation zone. Put another way, the localized displacement metric was more independent from contraction in neighboring tissues. Therefore, localized displacement was more closely related to apparent water vaporization on CT images, temperature distribution,34 and expected water loss.29,41 Not surprisingly, the maximum localized displacement of around 60% was near the expected volumetric water content of the tissue of around 75%. As heating time increased, most tissue water near the ablation center has been expelled toward the peripheral regions, mainly from high-temperature regions to low-temperature regions.34,42 Support for this explanation can be seen from the decreasing rate of total and normalized displacements over time, and relatively low localized displacements in peripheral regions that experience relatively little dehydration.
Several previous studies have investigated tissue contraction in other models. Chen et al. put forward a phenomenological model based on the study of heat-induced shrinkage on bovine chordae tendineae.32,43 Rossmann et al. set up another model based on the studies of tissue shrinkage during controlled temperature exposure from 60 °C to 95 °C, and suggested 12.3%–21.7% shrinkage after 15 min temperature exposure.35 Both models described time-dependent heating and recovery, but only considered heating at temperatures less than 100 °C. Given the high degree of water vaporization noted on CT images, such a model may be incomplete to describe the contraction observed in this study. On the other hand, Brace et al. described tissue contraction in liver and lung tissue resulting from microwave and radiofrequency ablation, which can heat tissue to 100 °C or more, noting an approximately 25% reduction in ablation zone diameter as a result of contraction.29 Sommer et al. described a similar tissue shrinkage and dehydration caused by microwave ablation, noting an approximately 30% underestimation of effective coagulation in kidneys.30 While those studies lacked analysis of longitudinal contraction and relied on comparing independent samples (i.e., they did not provide direct evaluation of contraction or temporal analysis in each sample), the contraction metrics in the present study are commensurate with those works.
The results of this study should aid interpretation of both numerical and experimental studies of thermal ablation. For example, most previous studies have reported only postablation measurements of the ablation zone, which neglects the influence of contraction and likely underestimates the preablation volume of tissue included in the ablation zone.27,28,44,45 Some studies have considered evaporation procedure in the numerical model, but lacked experimental validation.46,47 Efforts to improve numerical models for thermal ablation may also benefit from incorporating contraction into the prediction of temperatures and cell death.41
This study may also provide additional guidance for clinical ablation treatment planning. While most ablation device manufacturers provide estimated ablation zone sizes based on various time and power combinations, those data are typically collected in an ex vivo model similar to that utilized in the present study.25,26 The results of this study suggest that those power-time tables may actually underestimate the size of tissue included in the ablation zone. As a result, the clinical ablative margin has likely been greater than would be predicted from direct comparison of pre- and postablation lesion dimensions. The results of this study may be used to correct the estimates from ex vivo tissue and help determine the real ablation margin in clinical cases.
There were certain limitations to this study. The 2D analysis technique assumed symmetric contraction in the radial component. The biomechanical properties of liver tissue are not necessarily homogeneous, linear, or isotropic.48 However, microwave ablations in particular have been shown to grow in a relatively predictable and uniform manner, so the assumption of symmetry was considered reasonable.49 The second limitation was that only one kind of antenna was applied, and only one setting of power was selected and thus only one heating rate was considered. Heating and ablation growth patterns differ somewhat between devices, so our results may not generalize to all available devices. However, with a single heating source, we can still make strong conclusions about the distribution and temporal development of contraction. In addition, our results were generally commensurate with previous studies utilizing other devices, indicating that contraction analysis may not be completely unique to each device. The third limitation was that specific tissue types such as vessels and liver capsules were not considered individually. Vessels with more collagen might enhance the local shrinkage (more contraction was anecdotally observed near the vessels); however, our averaging of multiple samples lumped all of these local effects into a single bulk measurement. Moreover, the study only performed ex vivo experiments on normal tissue. It is more likely that tissue with different pathology and blood flow (i.e., tumor, cirrhosis, fibrosis) has different contraction rates and thus different shrinkage characteristics. Additional study is needed to determine the effect of tissue type on contraction.
In summary, tissue contraction during microwave ablation was studied using a CT imaging technique. The results showed the greatest contraction occurred at the ablation zone center. Contraction rate followed a roughly exponential decay curve over time, with the greatest rates occurring in the first 60 s. Future studies will focus on modeling temperature and dehydration mechanisms during tissue contraction.
ACKNOWLEDGMENTS
The authors wish to acknowledge Alice Minx for her assistance in CT data collection, Lisa Sampson for her assistance with experimental setups, and the National Institutes of Health R01CA142379.
REFERENCES
- 1.Goldberg S. N., Gazelle G. S., and Mueller P. R., “Thermal ablation therapy for focal malignancy: A unified approach to underlying principles, techniques, and diagnostic imaging guidance,” AJR, Am. J. Roentgenol. 174, 323–331 (2000). 10.2214/ajr.174.2.1740323 [DOI] [PubMed] [Google Scholar]
- 2.Dupuy D. E. and Goldberg S. N., “Image-guided radiofrequency tumor ablation: Challenges and opportunities–Part II,” J. Vasc. Interv. Radiol. 12, 1135–1148 (2001). 10.1016/S1051-0443(07)61670-4 [DOI] [PubMed] [Google Scholar]
- 3.Dodd G. D. III, Soulen M. C., Kane R. A., Livraghi T., Lees W. R., Yamashita Y., Gillams A. R., Karahan O. I., and Rhim H., “Minimally invasive treatment of malignant hepatic tumors: At the threshold of a major breakthrough,” Radiographics 20, 9–27 (2000). 10.1148/radiographics.20.1.g00ja019 [DOI] [PubMed] [Google Scholar]
- 4.Chen M. H., Yang W., Yan K., Dai Y., Wu W., Fan Z. H., Callstrom M. R., and Charboneau J. W., “The role of contrast-enhanced ultrasound in planning treatment protocols for hepatocellular carcinoma before radiofrequency ablation,” Clin. Radiol. 62, 752–760 (2007). 10.1016/j.crad.2006.12.013 [DOI] [PubMed] [Google Scholar]
- 5.He W., Hu X. D., Wu D. F., Guo L., Zhang L. Z., Xiang D. Y., and Ning B., “Ultrasonography-guided percutaneous microwave ablation of peripheral lung cancer,” Clin. Imaging 30, 234–241 (2006). 10.1016/j.clinimag.2005.10.008 [DOI] [PubMed] [Google Scholar]
- 6.Lo W. K., vansonnenberg E., Shankar S., Morrison P. R., Silverman S. G., Tuncali K., and Rabin M., “Percutaneous CT-guided radiofrequency ablation of symptomatic bilateral adrenal metastases in a single session,” J. Vasc. Interv. Radiol. 17, 175–179 (2006). 10.1097/01.RVI.0000188748.51764.CE [DOI] [PubMed] [Google Scholar]
- 7.Dick E. A., Joarder R., de Jode M., Taylor-Robinson S. D., Thomas H. C., Foster G. R., and Gedroyc W. M., “MR-guided laser thermal ablation of primary and secondary liver tumours,” Clin. Radiol. 58, 112–120 (2003). 10.1053/crad.2002.1129 [DOI] [PubMed] [Google Scholar]
- 8.Rossi S., Di Stasi M., Buscarini E., Quaretti P., Garbagnati F., Squassante L., Paties C. T., Silverman D. E., and Buscarini L., “Percutaneous RF interstitial thermal ablation in the treatment of hepatic cancer,” AJR, Am. J. Roentgenol. 167, 759–768 (1996). 10.2214/ajr.167.3.8751696 [DOI] [PubMed] [Google Scholar]
- 9.Simon C. J., Dupuy D. E., and Mayo-Smith W. W., “Microwave ablation: Principles and applications,” Radiographics 25, S69–S83 (2005). 10.1148/rg.25si055501 [DOI] [PubMed] [Google Scholar]
- 10.Deardorff D. L. and Diederich C. J., “Ultrasound applicators with internal water-cooling for high-powered interstitial thermal therapy,” IEEE Trans. Biomed. Eng. 47, 1356–1365 (2000). 10.1109/10.871409 [DOI] [PubMed] [Google Scholar]
- 11.Vogl T. J., Mack M. G., Roggan A., Straub R., Eichler K. C., Muller P. K., Knappe V., and Felix R., “Internally cooled power laser for MR-guided interstitial laser-induced thermotherapy of liver lesions: Initial clinical results,” Radiology 209, 381–385 (1998). 10.1148/radiology.209.2.9807562 [DOI] [PubMed] [Google Scholar]
- 12.Paganini A. M., Rotundo A., Barchetti L., and Lezoche E., “Cryosurgical ablation of hepatic colorectal metastases,” Surg. Oncol. 16, S137–S140 (2007). 10.1016/j.suronc.2007.10.031 [DOI] [PubMed] [Google Scholar]
- 13.Rose S. C., Thistlethwaite P. A., Sewell P. E., and Vance R. B., “Lung cancer and radiofrequency ablation,” J. Vasc. Interv. Radiol. 17, 927–951 (2006). 10.1097/01.RVI.0000222707.44902.66 [DOI] [PubMed] [Google Scholar]
- 14.Livraghi T., Solbiati L., Meloni M. F., Gazelle G. S., Halpern E. F., and Goldberg S. N., “Treatment of focal liver tumors with percutaneous radio-frequency ablation: Complications encountered in a multicenter study,” Radiology 226, 441–451 (2003). 10.1148/radiol.2262012198 [DOI] [PubMed] [Google Scholar]
- 15.Rhim H., Dodd G. D. III, Chintapalli K. N., Wood B. J., Dupuy D. E., Hvizda J. L., Sewell P. E., and Goldberg S. N., “Radiofrequency thermal ablation of abdominal tumors: Lessons learned from complications,” Radiographics 24, 41–52 (2004). 10.1148/rg.241025144 [DOI] [PubMed] [Google Scholar]
- 16.Liang P., Wang Y., Yu X., and Dong B., “Malignant liver tumors: Treatment with percutaneous microwave ablation-complications among cohort of 1136 patients,” Radiology 251, 933–940 (2009). 10.1148/radiol.2513081740 [DOI] [PubMed] [Google Scholar]
- 17.Livraghi T., Meloni F., Di Stasi M., Rolle E., Solbiati L., Tinelli C., and Rossi S., “Sustained complete response and complications rates after radiofrequency ablation of very early hepatocellular carcinoma in cirrhosis: Is resection still the treatment of choice?,” Hepatology 47, 82–89 (2008). 10.1002/hep.21933 [DOI] [PubMed] [Google Scholar]
- 18.Qian G. J., Wang N., Shen Q., Sheng Y. H., Zhao J. Q., Kuang M., Liu G. J., and Wu M. C., “Efficacy of microwave versus radiofrequency ablation treatment of small hepatocellular carcinoma: Experimental and clinical studies,” Eur. Radiol. 22, 1983–1990 (2012). 10.1007/s00330-012-2442-1 [DOI] [PubMed] [Google Scholar]
- 19.Stattner S., Jones R. P., Yip V. S., Buchanan K., Poston G. J., Malik H. Z., and Fenwick S. W., “Microwave ablation with or without resection for colorectal liver metastases,” Eur. J. Surg. Oncol. 39, 844–849 (2013). 10.1016/j.ejso.2013.04.005 [DOI] [PubMed] [Google Scholar]
- 20.Lorentzen T., Skjoldbye B. O., and Nolsoe C. P., “Microwave ablation of liver metastases guided by contrast-enhanced ultrasound: Experience with 125 metastases in 39 patients,” Ultraschall. Med. 32, 492–496 (2011). 10.1055/s-0029-1246002 [DOI] [PubMed] [Google Scholar]
- 21.Zagoria R. J., Traver M. A., Werle D. M., Perini M., Hayasaka S., and Clark P. E., “Oncologic efficacy of CT-guided percutaneous radiofrequency ablation of renal cell carcinomas,” AJR, Am. J. Roentgenol. 189, 429–436 (2007). 10.2214/AJR.07.2258 [DOI] [PubMed] [Google Scholar]
- 22.Yu J., Liang P., Yu X. L., Cheng Z. G., Han Z. Y., Mu M. J., and Wang X. H., “US-guided percutaneous microwave ablation of renal cell carcinoma: Intermediate-term results,” Radiology 263, 900–908 (2012). 10.1148/radiol.12111209 [DOI] [PubMed] [Google Scholar]
- 23.Muto G., Castelli E., Migliari R., D’Urso L., Coppola P., and Collura D., “Laparoscopic microwave ablation and enucleation of small renal masses: Preliminary experience,” Eur. Urol. 60, 173–176 (2011). 10.1016/j.eururo.2011.04.028 [DOI] [PubMed] [Google Scholar]
- 24.Guan W., Bai J., Liu J., Wang S., Zhuang Q., Ye Z., and Hu Z., “Microwave ablation versus partial nephrectomy for small renal tumors: Intermediate-term results,” J. Surg. Oncol. 106, 316–321 (2012). 10.1002/jso.23071 [DOI] [PubMed] [Google Scholar]
- 25.Zhou W., Liang M., Pan H., Liu X., Jiang Y., Wang Y., Ling L., Ding Q., and Wang S., “Comparison of ablation zones among different tissues using 2450-MHz cooled-shaft microwave antenna: Results in ex vivo porcine models,” PLoS One 8, e71873 (2013). 10.1371/journal.pone.0071873 [DOI] [PMC free article] [PubMed] [Google Scholar]
- 26.Hoffmann R., Rempp H., Erhard L., Blumenstock G., Pereira P. L., Claussen C. D., and Clasen S., “Comparison of four microwave ablation devices: An experimental study in ex vivo bovine liver,” Radiology 268, 89–97 (2013). 10.1148/radiol.13121127 [DOI] [PubMed] [Google Scholar]
- 27.Lubner M. G., Hinshaw J. L., Andreano A., Sampson L., F. T. Lee, Jr., and Brace C. L., “High-powered microwave ablation with a small gauge, gas-cooled antenna: Initial ex vivo and in vivo results,” J. Vasc. Interv. Radiol. 23, 405–411 (2012). 10.1016/j.jvir.2011.11.003 [DOI] [PMC free article] [PubMed] [Google Scholar]
- 28.Hines-Peralta A. U., Pirani N., Clegg P., Cronin N., Ryan T. P., Liu Z., and Goldberg S. N., “Microwave ablation: Results with a 2.45-GHz applicator in ex vivo bovine and in vivo porcine liver,” Radiology 239, 94–102 (2006). 10.1148/radiol.2383050262 [DOI] [PubMed] [Google Scholar]
- 29.Brace C. L., Diaz T. A., Hinshaw J. L., and F. T. Lee, Jr., “Tissue contraction caused by radiofrequency and microwave ablation: A laboratory study in liver and lung,” J. Vasc. Interv. Radiol. 21, 1280–1286 (2010). 10.1016/j.jvir.2010.02.038 [DOI] [PMC free article] [PubMed] [Google Scholar]
- 30.Sommer C. M., Sommer S. A., Mokry T., Gockner T., Gnutzmann D., Bellemann N., Schmitz A., Radeleff B. A., Kauczor H. U., Stampfl U., and Pereira P. L., “Quantification of tissue shrinkage and dehydration caused by microwave ablation: Experimental study in kidneys for the estimation of effective coagulation volume,” J. Vasc. Interv. Radiol. 24, 1241–1248 (2013). 10.1016/j.jvir.2013.04.008 [DOI] [PubMed] [Google Scholar]
- 31.Wall M. S., Deng X. H., Torzilli P. A., Doty S. B., O’Brien S. J., and Warren R. F., “Thermal modification of collagen,” J. Shoulder Elbow. Surg. 8, 339–344 (1999). 10.1016/S1058-2746(99)90157-X [DOI] [PubMed] [Google Scholar]
- 32.Chen S. S., Wright N. T., and Humphrey J. D., “Phenomenological evolution equations for heat-induced shrinkage of a collagenous tissue,” IEEE Trans. Biomed. Eng. 45, 1234–1240 (1998). 10.1109/10.720201 [DOI] [PubMed] [Google Scholar]
- 33.Dueck J., Marashdeh M., and Breiter R., “Experimental investigation and mathematical modeling of the thermal shrinkage of bovine pericardium,” J. Med. Biol. Eng. 31, 193–200 (2011). 10.5405/jmbe.809 [DOI] [Google Scholar]
- 34.Yang D., Converse M. C., Mahvi D. M., and Webster J. G., “Measurement and analysis of tissue temperature during microwave liver ablation,” IEEE Trans. Biomed. Eng. 54, 150–155 (2007). 10.1109/TBME.2006.884647 [DOI] [PubMed] [Google Scholar]
- 35.Rossmann C., Garrett-Mayer E., Rattay F., and Haemmerich D., “Dynamicsof tissue shrinkage during ablative temperature exposures,” Physiol. Meas. 35, 55–67 (2014). 10.1088/0967-3334/35/1/55 [DOI] [PMC free article] [PubMed] [Google Scholar]
- 36.Boas F. E. and Fleischmann D., “Evaluation of two iterative techniques for reducing metal artifacts in computed tomography,” Radiology 259, 894–902 (2011). 10.1148/radiol.11101782 [DOI] [PubMed] [Google Scholar]
- 37.Tsai J.-C., Hsieh C.-H., Weng S.-K., and Lai M.-F., “Block-matching motion estimation using correlation search algorithm,” Signal. Process. Image Commun. 13, 119–133 (1998). 10.1016/S0923-5965(97)00052-0 [DOI] [Google Scholar]
- 38.Cha C. H., F. T. Lee, Jr., Gurney J. M., Markhardt B. K., Warner T. F., Kelcz F., and Mahvi D. M., “CT versus sonography for monitoring radiofrequency ablation in a porcine liver,” AJR, Am. J. Roentgenol. 175, 705–711 (2000). 10.2214/ajr.175.3.1750705 [DOI] [PubMed] [Google Scholar]
- 39.Fallone B. G., Moran P. R., and Podgorsak E. B., “Noninvasive thermometry with a clinical x-ray CT scanner,” Med. Phys. 9, 715–721 (1982). 10.1118/1.595117 [DOI] [PubMed] [Google Scholar]
- 40.Aycock R. S. and Seyer J. M., “Collagens of normal and cirrhotic human liver,” Connect. Tissue Res. 23, 19–31 (1989). 10.3109/03008208909103901 [DOI] [PubMed] [Google Scholar]
- 41.Yang D., Converse M. C., Mahvi D. M., and Webster J. G., “Expanding the bioheat equation to include tissue internal water evaporation during heating,” IEEE Trans. Biomed. Eng. 54, 1382–1388 (2007). 10.1109/TBME.2007.890740 [DOI] [PubMed] [Google Scholar]
- 42.Ji Z. and Brace C. L., “Expanded modeling of temperature-dependent dielectric properties for microwave thermal ablation,” Phys. Med. Biol. 56, 5249–5264 (2011). 10.1088/0031-9155/56/16/011 [DOI] [PMC free article] [PubMed] [Google Scholar]
- 43.Chen S. S., Wright N. T., and Humphrey J. D., “Heat-induced changes in the mechanics of a collagenous tissue: Isothermal, isotonic shrinkage,” J. Biomech. Eng. 120, 382–388 (1998). 10.1115/1.2798005 [DOI] [PubMed] [Google Scholar]
- 44.Brace C. L., Laeseke P. F., van der Weide D. W., and Lee F. T., “Microwave ablation with a triaxial antenna: Results in ex vivo bovine liver,” IEEE Trans. Microwave Theory Tech. 53, 215–220 (2005). 10.1109/TMTT.2004.839308 [DOI] [PMC free article] [PubMed] [Google Scholar]
- 45.Kuang M., Lu M. D., Xie X. Y., Xu H. X., Mo L. Q., Liu G. J., Xu Z. F., Zheng Y. L., and Liang J. Y., “Liver cancer: Increased microwave delivery to ablation zone with cooled-shaft antenna-experimental and clinical studies,” Radiology 242, 914–924 (2007). 10.1148/radiol.2423052028 [DOI] [PubMed] [Google Scholar]
- 46.Pätz T., Kröger T., and Preusser T., “Simulation of radiofrequency ablation including water evaporation,” in IFMBE Proceedings (Springer, Berlin, 2010), pp. 1287–1290 [Google Scholar]
- 47.Zhu Q., Shen Y., Zhang A., and Xu L. X., “Numerical study of the influence of water evaporation on radiofrequency ablation,” Biomed. Eng. Online 12 : 127 (2013). 10.1186/1475-925X-12-127 [DOI] [PMC free article] [PubMed] [Google Scholar]
- 48.Fung Y. C., Biomechanics: Mechanical Properties of Living Tissues, 2nd ed. (Springer, New York, NY, 1993). [Google Scholar]
- 49.Carrafiello G., Lagana D., Mangini M., Fontana F., Dionigi G., Boni L., Rovera F., Cuffari S., and Fugazzola C., “Microwave tumors ablation: Principles, clinical application and review of preliminary experiences,” Int. J. Surg. 6, S65–S69 (2008). 10.1016/j.ijsu.2008.12.028 [DOI] [PubMed] [Google Scholar]


