

Abstract
Purpose
Increased circulating tumor cells (CTCs; five or more CTCs per 7.5 mL of whole blood) are associated with poor prognosis in metastatic breast cancer (MBC). A randomized trial of patients with persistent increase in CTCs tested whether changing chemotherapy after one cycle of first-line chemotherapy would improve the primary outcome of overall survival (OS).
Patients and Methods
Patients with MBC who did not have increased CTCs at baseline remained on initial therapy until progression (arm A). Patients with initially increased CTCs that decreased after 21 days of therapy remained on initial therapy (arm B). Patients with persistently increased CTCs after 21 days of therapy were randomly assigned to continue initial therapy (arm C1) or change to an alternative chemotherapy (arm C2).
Results
Of 595 eligible and evaluable patients, 276 (46%) did not have increased CTCs (arm A). Of those with initially increased CTCs, 31 (10%) were not retested, 165 were assigned to arm B, and 123 were randomly assigned to arm C1 or C2. No difference in median OS was observed between arm C1 and C2 (10.7 and 12.5 months, respectively; P = .98). CTCs were strongly prognostic. Median OS for arms A, B, and C (C1 and C2 combined) were 35 months, 23 months, and 13 months, respectively (P < .001).
Conclusion
This study confirms the prognostic significance of CTCs in patients with MBC receiving first-line chemotherapy. For patients with persistently increased CTCs after 21 days of first-line chemotherapy, early switching to an alternate cytotoxic therapy was not effective in prolonging OS. For this population, there is a need for more effective treatment than standard chemotherapy.
INTRODUCTION
Median survival for patients with metastatic breast cancer (MBC) is approximately 28 months, ranging from a few months to many years, depending on the type and site of disease.1,2 Antineoplastic treatment is generally directed toward symptom management.3 Thus, chemotherapy is usually delivered in a single-agent, sequential fashion, balancing optimal benefit resulting from the reduction of tumor burden with minimal toxicity.4
Increased levels of circulating tumor cells (CTCs) before initiation of a new therapy are associated with worse progression-free survival (PFS) and overall survival (OS) in patients with MBC.5,6 The failure of chemotherapy to reduce CTCs to levels below five CTCs per 7.5 mL whole blood (WB) at first follow-up (3 to 5 weeks) after initiating a new systemic therapy for MBC predicts shorter time to progression and OS compared with not having increased CTCs at baseline or with having increased CTCs at baseline but not at first follow-up.5
Presumably, this poor prognostic outcome reflects resistance to the therapy initiated at baseline. Therefore, we hypothesized that patients with hormone receptor–negative or hormone receptor–positive but endocrine therapy–refractory MBC who have five or more CTCs per 7.5 mL WB at baseline but for whom chemotherapy has failed to reduce CTCs to less than five per 7.5 mL WB by first follow-up after starting a new first-line chemotherapy might benefit from changing early to an alternative chemotherapy regimen. We report the results of a prospective randomized clinical trial to test this hypothesis.
PATIENTS AND METHODS
Protocol Regulatory Issues
SWOG Protocol S0500 was designed, conducted, and analyzed by the National Cancer Institute (NCI) –funded SWOG Cooperative Group with review and collaboration by the other participating cooperative groups and by NCI's Cancer Therapy Evaluation Program. The principal investigator of the study (J.B.S.), senior author (D.F.H.), and statistician (W.E.B.) take full responsibility for the quality of the data and vouch for the analysis. Patients signed written informed consent approved by their participating institutions or the central institutional review board. This study was conducted under an investigational device exemption granted by the Food and Drug Administration (IDE G060096).
Patients, Treatment, and Follow-Up
Female patients were eligible if they had histologically confirmed breast cancer and clinical and/or radiographic evidence of metastatic disease. Patients could have measurable or nonmeasurable but evaluable bone-only disease with a Zubrod (Eastern Cooperative Oncology Group) performance status of 0 to 2. Patients were eligible if they had stable brain metastases for at least 90 days after completing brain radiotherapy, but those with leptomeningeal disease were ineligible.
Patients could not have received any prior chemotherapy for MBC, although prior and concurrent use of hormone, bisphosphonate, trastuzumab, or bevacizumab therapy was allowed. Adjuvant chemotherapy must have been completed at least 12 months before registration. The choice of chemotherapy was at the discretion of the treating physician. To ensure standardized patient treatment, only patients who were to be treated with single-agent chemotherapy were eligible. If the clinician felt that combination chemotherapy was indicated, the patient was not eligible.
Patients were enrolled before initiation of first-line chemotherapy, and CTCs were enumerated (see Appendix Figure A1 [online only] for the study schema). If patients did not have increased CTC levels (defined as less than five CTCs per 7.5 mL WB) at baseline (arm A), they were treated at the physician's discretion. These patients were observed for OS, but no additional blood draws or interventions were mandated by the protocol.
If patients had increased CTCs at baseline (defined as five or more CTCs per 7.5 mL WB), a second CTC level was determined at first follow-up visit, which was approximately 22 days after the first administration of chemotherapy. Assuming the patient had no clinical evidence of progression, she received her second planned cycle of first-line chemotherapy. If the follow-up CTC level was no longer increased (arm B), the patient continued on the chemotherapy regimen that was initially chosen until clinical and/or radiographic evidence of progression. If the CTC level remained increased (arm C), the patient was randomly assigned to either continue on the chemotherapy regimen that was initially chosen until clinical or radiographic evidence of progression (arm C1) or to switch to an alternative chemotherapy of physician's choice (arm C2).
If a patient on arm C had been started on trastuzumab or bevacizumab at baseline, this therapy was continued even if the cytotoxic chemotherapy was changed. Progression was defined by Response Evaluation Criteria in Solid Tumors (RECIST), and all therapy after progression was at the physician's discretion.
All patients were staged at baseline with body imaging (computed tomography [CT] or magnetic resonance imaging) and bone scintigraphy (dedicated bone scintigraphy or positron emission tomography [PET]). If a PET scan was accompanied by a nondiagnostic CT (PET-CT), then additional diagnostic body imaging was required. All patients had to be observed at regular, protocol-mandated intervals by using the same imaging methods as chosen at baseline.
CTC Enumeration
WB was drawn into fixative-containing tubes (CellSave; Janssen Diagnostics, Raritan, NJ) and sent to a central laboratory(Janssen Diagnostics, Huntingdon Valley, PA) for CTC enumeration using the CellSearch system, as previously described,5,7 without knowledge of clinical status, treatment, or outcome. A level of five or more CTCs per 7.5 mL WB was considered an increased level, and it served as the cut point for separation of favorable versus unfavorable prognosis.5,8
Patients and caregivers were blinded to the day-22 CTC results but were informed about the baseline CTC value. Patients and physicians knew that patients directed to stay on current therapy could have been assigned to arm B or randomly assigned to maintain therapy (arm C1), and this knowledge was assumed to reduce potential bias in judging progression.
Biologic Subgroup Determination
Estrogen receptor (ER) and progesterone receptor (PgR) status and human epidermal growth factor receptor 2 (HER2) status were determined locally by routine pathologic evaluation at the patient's treating center according to standard guidelines.
Study Conduct and Statistical Analysis
Initial baseline evaluation of CTCs was performed before beginning chemotherapy. Patients who had increased CTC values at both baseline and day 22 were randomly assigned to change or not change therapy by using a 1:1 allocation with stratification by disease type (measurable v evaluable bone only) and by HER2 status.
Analysis of the sample and randomization occurred within about 4 days of the sample being drawn just before the scheduled start of the second cycle of chemotherapy. Treatment for patients not in arm A was held for a short period to make this determination. If a patient was randomly assigned to switch, the new chemotherapy regimen was initiated soon after day 22. Treatment continued until progression, unacceptable toxicity, or withdrawal from the trial by the patient. Toxicities were measured by using Common Terminology Criteria for Adverse Events (version 3).
Statistical Analysis
Comparison of the two randomly assigned arms C1 and C2 was the primary objective. A secondary objective was the comparison of prognosis across the different arms (A v B v C) classified by CTC values at baseline and first follow-up. The primary outcome was OS defined as time from registration until death as a result of any cause. PFS was a secondary outcome defined as the time from registration until progression or death as a result of any cause. The outcome was censored at the last follow-up visit for which the outcome had not yet been observed. For the randomized segment of this study, the second registration (randomization) was used as the starting point after the day-22 result was known. For the prognostic comparison, the first registration (screen) was used as the starting time because the majority of patients did not undergo random assignment.
Survival curves were estimated by using Kaplan-Meier graphs and were compared by using log-rank test statistics. Cox regression was used to estimate the hazard ratio (HR) and 95% CIs. It was expected that 500 to 700 patients would need to be screened to identify 120 patients for the randomized trial. Power was 81% (two-sided α = .05) to detect a 70% increase in median OS in the arm that was changing therapy (increase from 8 to 13.6 months). Three interim analyses of OS were planned at 25%, 50%, and 75% of the expected 116 deaths. All tests performed were two sided.
RESULTS
Patient Demographic Characteristics and Incidence of Increased CTCs
From October 1, 2006, until March 15, 2012, 624 patients were enrolled onto the study, and 595 met the eligibility criteria and were successfully evaluated for CTC levels (Fig 1). At baseline, 276 (46%) of the 564 eligible patients did not have increased CTC levels (arm A), although 319 (54%) did. Of the patients with increased baseline CTCs, 288 patients (48% of all eligible patients, 90% of patients with increased CTCs at baseline) had CTCs determined at first follow-up. Thirty-one patients did not have a second CTC evaluation because of death or disease progression or because they dropped out of the study.
Fig 1.
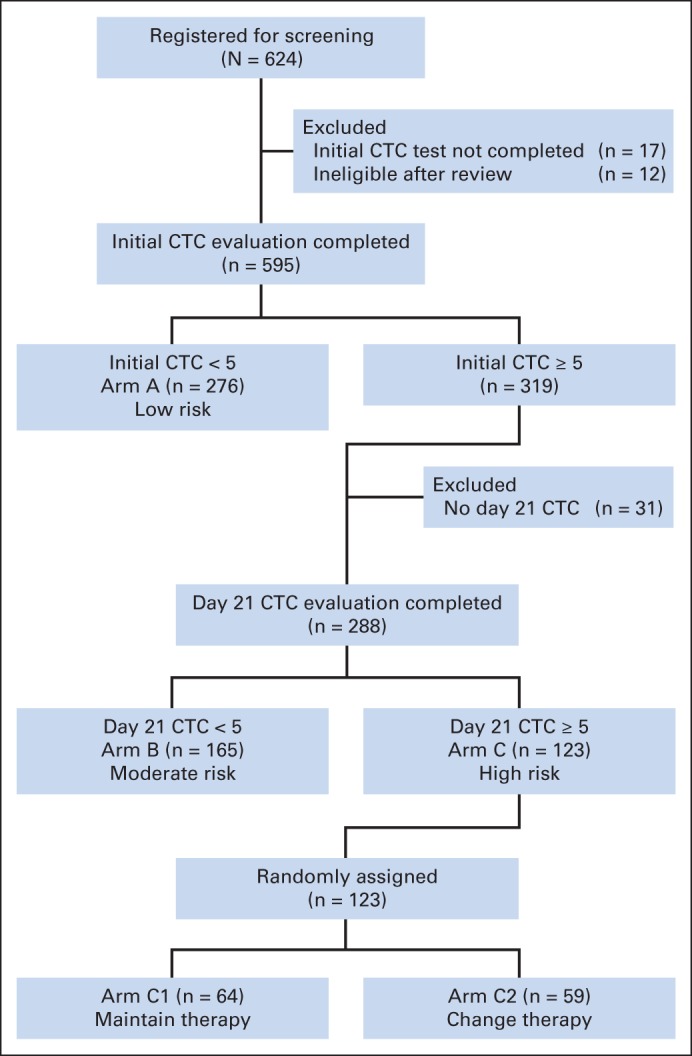
CONSORT diagram of patient entry in the study and distribution. In all, 624 patients with metastatic breast cancer were screened for circulating tumor cells (CTCs) before starting first-line chemotherapy. Of these, treatment failed to reduce CTCs to less than five per 7.5 mL of whole blood after one cycle of chemotherapy for 123 patients, and they were randomly assigned to continue receiving that therapy or switch to alternative chemotherapy.
At first follow-up, 165 patients (57% of eligible patients with increased baseline CTCs who had CTCs determined at first follow-up) had CTC levels that were no longer increased (arm B). The 123 patients (43%) who had persistent increase at baseline and first follow-up (arm C) were randomly assigned to continue initial therapy (arm C1; n = 64) or to switch to alternative therapy (arm C2; n = 59). As of this report, 424 (68%) of the 624 registered patients had died. Of the 123 randomly assigned patients, 107 (87%) had died and 122 (99%) had progressed.
There were no significant differences in demographics or tumor characteristics among the three arms or between the two randomly assigned arms by race, age, or disease type (measurable or not; Table 1. Note that some of the patients enrolled are not included in Table 1, as outlined in Fig 1.). Bone-only (n = 70) and locoregional-only (n = 19) tumors were 12% and 3% of the total, respectively. Patients with bone-only tumors had a similar percentage of increased initial CTC values (51%) compared with patients who had metastatic disease in other sites, with or without bone metastases (52%), although only 26% of patients with locoregional-only tumors had initially increased CTCs (P = .08). Within the eligible population, 59% were ER or PgR positive and HER2 negative (designated “hormone receptor positive”), 17% were HER2 positive (with or without hormone receptor positivity), and 24% were triple negative (ER, PgR, and HER2 negative). The likelihood of having increased CTCs at baseline among the three biologic subtypes (hormone receptor positive and HER2 negative, triple negative, HER2 positive) was 55% (182 of 330), 45% (60 of 134), and 45% (43 of 96), respectively (P = .06; Table 1). Of patients with increased CTCs at baseline, 51% (93 of 182) of ER- and PgR-positive and HER2-negative patients, 55% (33 of 60) of triple-negative patients, and 84% (36 of 43) of HER2-positive patients converted to low CTCs after 22 days of first-line chemotherapy (P = .001; Table 1).
Table 1.
Patient Characteristics and Arm Assignments
| Characteristic | All |
Baseline CTC Comparison |
Follow-Up CTC Comparison |
Randomized Arms |
||||||||||
|---|---|---|---|---|---|---|---|---|---|---|---|---|---|---|
| Arm A (baseline CTC < 5) |
Arms B + C (baseline CTC ≥ 5) |
Arm B (first follow-up CTC < 5) |
Arm C (first follow-up CTC ≥ 5) |
Arm C1 |
Arm C2 |
|||||||||
| No. | % | No. | % | No. | % | No. | % | No. | % | No. | % | No. | % | |
| Sample size | 564* | 276 | 288 | 165 | 123 | 64 | 59 | |||||||
| Age 55 years or older | 333† | 59 | 163 | 59 | 170 | 59 | 94 | 57 | 76‡ | 62 | 38 | 59 | 39 | 66 |
| Black race | 95 | 17 | 50 | 18 | 45 | 16 | 23 | 14 | 22 | 18 | 15 | 23 | 7 | 12 |
| Measurable disease | 455 | 81 | 221 | 81 | 234 | 81 | 137 | 83 | 97 | 79 | 47 | 73 | 50 | 85 |
| No. of patients classified by disease subtype (four missing) | 560 | 275 | 285 | 162 | 123 | 64 | 59 | |||||||
| Hormone receptor positive, HER2 negative | 330§ | 59 | 148 | 54 | 182 | 64 | 93 | 57 | 89 | 72 | 50 | 78 | 39 | 66 |
| Triple negative | 134 | 24 | 74 | 27 | 60 | 21 | 33 | 20 | 27 | 22 | 11 | 17 | 16 | 27 |
| HER2 positive | 96 | 17 | 53 | 19 | 43 | 15 | 36 | 22 | 7 | 6 | 3 | 5 | 4 | 7 |
Abbreviations: CTC, circulating tumor cells; HER2, human epidermal growth factor receptor 2.
Eligible patients for whom baseline and, if initially increased, first follow-up CTC were evaluated.
The percentage reflects the number of patients in the characteristic categories of age, race, and measurable disease divided by the sample size.
One patient became 55 years old between entering the trial and being eligible for random assignment 22 days later. Therefore the number of patients older than age 55 years in arms C1 and C2 is one patient less than the number of total patients in arm C.
The percentage reflects the number of patients in the characteristic categories of hormone receptor positive, HER2 negative, triple negative, and HER2 positive divided by the total number for the disease subtype category.
Patient Outcomes
Outcomes by randomization arm.
There was no difference in either OS or PFS measured from randomization date according to treatment arm (Fig 2; log-rank P = .98; C2 v C1 HR, 1.00; 95% CI, 0.69 to 1.47). The median OS (the primary end point of the trial) was 10.7 months for arm C1 and 12.5 months for arm C2 (Fig 2A). Similarly, there was no significant difference in PFS (log-rank P = .64; C2 v C1 HR, 0.92; 95% CI, 0.64 to 1.32; Fig 2B). Median PFS was 3.5 months for arm C1 and 4.6 months for arm C2. There were no significant differences between arms C1 and C2 in any of the three biologic subgroups (Table 2).
Fig 2.

Overall survival (OS) and progression-free survival (PFS) in patients with metastatic breast cancer for whom therapy failed to reduce circulating tumor cells (CTCs) within 3 weeks of starting first-line chemotherapy; patients were randomly assigned to continue receiving the initial chemotherapy or to switch to an alternative chemotherapy. Outcomes for the primary objective that tested the primary outcome (OS) and the secondary outcome (PFS) are shown. (A) OS and (B) PFS for patients who had increased CTCs (five or more CTCs per 7.5 mL of whole blood) at baseline and for whom therapy failed to reduce CTCs to less than five CTCs per 7.5 mL of whole blood at first follow-up (approximately 21 days after first dose of chemotherapy). Patients were randomly assigned to maintain the original chemotherapy (arm C1) or to switch to an alternative chemotherapy (arm C2). Choice of original and alternative chemotherapy was at physician's discretion. OS and PFS were calculated from the time of random assignment. The Cox model for both outcomes showed no evidence of violating the proportional hazards assumption (OS P = .92; PFS P = .27). Three patients in arm C2 were judged as progressing on day 22 and were excluded from the PFS analysis but were included in the OS analysis. The progression data were not available at the time of random assignment.
Table 2.
OS and PFS in Patients Randomly Assigned to Arms C1 or C2, According to Biologic Subtypes
| Biologic Subtype | OS* |
PFS |
||||||||||
|---|---|---|---|---|---|---|---|---|---|---|---|---|
| Median (months) |
HR† | 95% CI | P | Pint‡ | Median (months) |
HR† | 95% CI | P | Pint‡ | |||
| C1 | C2 | C1 | C2 | |||||||||
| All | 10.7 | 12.5 | 1.00 | 0.69 to 1.47 | .98 | NA | 3.5 | 4.6 | 0.92 | 0.64 to 1.32 | .64 | NA |
| Hormone receptor positive, HER2 negative | 12.4 | 17.4 | 0.80 | 0.50 to 1.28 | .35 | .21 | 4.2 | 5.7 | 0.86 | 0.57 to 1.31 | .51 | .88 |
| Triple negative | 9.1 | 7.9 | 1.19 | 0.52 to 2.73 | .67 | 1.9 | 2.2 | 0.70 | 0.31 to 1.56 | .38 | ||
| HER2 positive | 13.3 | 7.3 | 4.18 | 0.45 to 38.5 | .16 | 4.7 | 7.3 | 1.44 | 0.23 to 8.82 | .69 | ||
Abbreviations: HER2, human epidermal growth factor receptor; HR, hazard ratio; NA, not applicable; OS, overall survival; PFS, progression-free survival.
OS from time of random assignment.
HR for arm C2 v C1.
P for interaction.
Prognosis across arms.
Prognosis for patients who did not have increased CTCs at baseline (arm A), those who had increased CTCs at baseline but not at first follow-up (arm B), and those whose CTCs had not been reduced by first follow-up (arm C) were significantly different overall (global log-rank P < .001). Figure 3 suggests that prognosis for arm A was superior to that for arm B which, in turn, was better than that for arm C. Post hoc pairwise comparisons show highly significant differences adjusted for multiple comparisons (P < .001). Median OS for arms A, B, and C was 35, 23, and 13 months from the baseline CTC evaluation, respectively (Fig 3A; Table 3). The differences among arms remained highly significant after adjusting for hormone receptor and HER2 status in a Cox model (P < .001). Of note, approximately 25% of the patients in arm A were alive at 5 or more years, although fewer than 10% of patients in arm C survived that long. Median PFS for first chemotherapy for arms A and B and for first or switch chemotherapy for arm C was 11.1, 8.9, and 4.9 months, respectively (global log-rank P < .001; Table 3).
Fig 3.

Overall survival (OS) in patients with metastatic breast cancer according to circulating tumor cell (CTC) levels at baseline or first follow-up. Outcomes for the second primary objective that tested the prognostic ability of baseline and follow-up CTC levels by using the primary outcome (OS) are shown. An unplanned analysis of differences by disease subtype is also shown. (A) OS for all patients was determined from trial entry for patients with CTC levels of less than five CTCs per 7.5 mL of whole blood (WB) at baseline (arm A), for patients with CTC levels of five or more CTCs per 7.5 mL WB at baseline but less than five CTCs per 7.5 mL WB at first follow-up (21 days after first dose of chemotherapy; arm B), and for patients with CTC levels of five or more CTCs per 7.5 mL WB at baseline and five or more CTCs per 7.5 mL WB at first follow-up (21 days after first dose of chemotherapy; arm C). (B-D) OS within biologic subgroups. OS for patients with (B) hormone receptor–positive and HER2-negative disease, (C) triple-negative disease (hormone receptor negative and HER2 negative), and (D) HER2-positive disease.
Table 3.
OS and PFS for Arms A, B, and C, According to Biologic Subtypes
| Biologic Subtype | OS* |
PFS* |
||||||||||||
|---|---|---|---|---|---|---|---|---|---|---|---|---|---|---|
| Median (months) |
P | HR† | 95% CI | Pint‡ | Median (months) |
P | HR† | 95% CI | Pint‡ | |||||
| A | B | C | A | B | C | |||||||||
| All | 34.8 | 22.9 | 13.1 | < .001 | 2.13 | 1.63 to 2.79 | NA | 11.1 | 8.9 | 4.9 | < .001 | 1.94 | 1.52 to 2.47 | NA |
| Hormone receptor positive, HER2 negative | 37.3 | 28.1 | 15.0 | < .001 | 1.96 | 1.40 to 2.75 | .30 | 12.4 | 10.6 | 5.5 | < .001 | 1.72 | 1.27 to 2.31 | .02 |
| Triple negative | 22.1 | 12.5 | 9.5 | < .001 | 1.73 | 1.02 to 2.95 | 6.5 | 6.5 | 2.8 | < .001 | 2.89 | 1.63 to 5.10 | ||
| HER2 positive | NE | 33.0 | 14.1 | < .001 | 4.62 | 1.68 to 12.76 | 17.9 | 8.8 | 5.5 | .008 | 2.47 | 1.05 to 5.80 | ||
Abbreviations: HER2, human epidermal growth factor receptor; HR, hazard ratio; NA, not applicable; NE, not estimable; OS, overall survival; PFS, progression-free survival.
From initial circulating tumor cell blood draw.
HR for arm C v B.
P for interaction.
Prognosis by biologic subtype.
OS was analyzed across arms according to the three biologic subtypes (Fig 3B-D and Table 2). In each subgroup, median OS for arm C was lowest and that for arm A was highest. In each subgroup, the difference in OS among the three arms was statistically significant (P < .001).
Overall, within each arm, HER2-negative patients who had hormone receptor–positive compared with hormone receptor–negative disease had superior OS (Fig 3 and Table 3). Patients with triple-negative disease had the worst prognosis in arm A (median OS, 22.1 months), but this was still superior to the OS in hormone receptor–positive HER2-negative patients in arm C (median OS, 15 months).
The prognostic data for HER2-positive patients was particularly striking. Patients with HER2-positive compared with HER2-negative MBC had higher OS in both arms A and B (Fig 3 and Table 3). Indeed, the median OS had not yet been reached for patients with HER2-positive disease in arm A and was 33 months for those in arm B. Arm C had too few HER2-positive patients to evaluate (Fig 3D).
Of greater concern, in arm C, OS in patients with triple-negative MBC, usually considered the worst biologic subtype in regard to outcomes, was particularly poor (Fig 3C and Table 3). Median OS for this group was 9.5 months, and 75% of these patients died within 15 months. Median OS for patients with triple-negative disease in arm B was only 12.5 months, although in contrast, nearly 25% of women with triple-negative disease in arm A were observed to be alive for 3 years or more, again reflecting the prognostic significance of the presence or absence of CTCs.
Toxicity
There was no toxicity associated with the blood draw for CTC analysis. Observed toxicities were consistent with chemotherapy for MBC. There were no therapy-related deaths. Eight women in arm C1 and 13 women in arm C2 suffered grade 4 toxicities, mostly neutropenia and leukopenia.
DISCUSSION
In this prospective clinical trial, we tested whether changing to an alternative chemotherapeutic regimen might improve outcomes for patients with MBC whose CTCs were not reduced after one cycle of first-line chemotherapy. Unfortunately, this strategy did not improve either OS, or surprisingly, even PFS for such patients.
However, this trial validates prior reports of the poor prognosis of patients with MBC whose CTCs were not reduced after initial chemotherapy.5 This study is unique in that carefully controlled patient eligibility produced a reasonably homogeneous population in regard to patient status within the MBC spectrum. Furthermore, OS for patients in arm C was poor, although somewhat better in hormone receptor–positive patients, regardless of biologic subtype. This study was not designed to measure response to therapy or to quantify clinical benefit from individual chemotherapy agents; therefore, we cannot conclude that the patients in arm C derived no benefit from chemotherapy. However, the poor prognosis for the patients in arm C suggests that these patients had little benefit from cytotoxic therapies and that persistently increased CTCs after one cycle of first-line chemotherapy may identify a population of cancers that are relatively, if not absolutely, resistant to several commonly used chemotherapeutic agents. Thus, continued treatment with other chemotherapy regimens is unlikely to provide substantial benefit.
In contrast, all patients in arm A had a reasonably good prognosis. Patients with hormone receptor–positive and those with HER2-positive disease had a median OS that exceeded to 3 years. Even patients with triple-negative disease, now considered to be the least favorable of the biologic subtypes, had a median OS of nearly 2 years, and a reasonable fraction lived for ≥ 3 years. Likewise, patients in arm B also had relatively good prognoses although less favorable than those for arm A. Median OS for triple-negative patients in arm B was only 12.5 months. Nonetheless, these favorable prognoses appear to reflect response to therapy, as indicated by a reduction of CTCs.
Although the switching strategy failed to improve patient outcomes, these data suggest that measurement of CTCs might have clinical utility. Currently, few patients with MBC are enrolled onto phase I or II trials because of the perception that another potentially active chemotherapy option is available when the patient progresses on a prior regimen. Patients who do not have increased CTCs at baseline, or whose CTCs decrease after one cycle of first-line chemotherapy (arm B), do have a relatively favorable prognosis. It is reasonable to continue such patients on the chosen regimen and to consider further types of standard chemotherapy when their disease progresses on the first chemotherapeutic regimen.
Rather than expose a patient whose CTCs have not been reduced after one cycle of first-line chemotherapy to the toxicities of second- or later-line chemotherapy, it might be preferable to prepare that patient for participation in prospective trials of novel therapies. Recent studies have suggested that a research biopsy of metastases for molecular analyses, or even analysis of circulating cell-free DNA, or molecular analysis of CTCs, might be performed to determine whether such a patient is eligible for trials of targeted therapy.9–12 A delay in pursuing such a strategy until the patient is clearly refractory to all lines of chemotherapy may result in her having too poor a performance status to be eligible for novel therapeutic trials.
In summary, these data demonstrate that failure of treatment to reduce CTCs within the first 3 to 4 weeks of starting first-line chemotherapy in patients with MBC portends a poor prognosis. Indeed, this circumstance is indicative of general chemotherapy resistance, and early switching to an alternative chemotherapeutic regimen is of no value. We propose that patients who are found to have increased CTCs after one cycle of chemotherapy should strongly consider participating in trials of novel therapeutic agents at the time of progression, rather than moving on to second or later lines of chemotherapy.
Supplementary Material
Appendix
Fig A1.

SWOG Protocol S0500 study schema.
Processed as a Rapid Communication manuscript.
Support information appears at the end of this article.
Presented in part as an oral presentation at the San Antonio Breast Cancer Symposium, San Antonio, TX, December 10-14, 2013.
Authors' disclosures of potential conflicts of interest and author contributions are found at the end of this article.
Clinical trial information: NCT00382018.
Support
Supported in part by Public Health Service Cooperative Agreement Grants No. CA32102, CA38926, CA 63848, CA27057, CA67663, CA58416, CA22433, CA 95860, CA04919, CA16385, CA 63844, CA45808, CA20319, CA58882, CA35192, CA14028, CA45807, CA74647, CA37981, CA46441, CA42777, CA35178, CA86780, CA58861, CA67575, CA45560, CA12644, CA45377, CA35281, CA35431, CA76447, CA46368, CA73590, CA105409, CA46113, CA48723, CA31946, CA21115, and CA35103 from the National Cancer Institute, Department of Health and Human Services, and by Immunicon and Veridex. Circulating tumor cell assays were performed by Janssen Diagnostics at no charge to the clinical sponsor (SWOG).
AUTHORS' DISCLOSURES OF POTENTIAL CONFLICTS OF INTEREST
Although all authors completed the disclosure declaration, the following author(s) and/or an author's immediate family member(s) indicated a financial or other interest that is relevant to the subject matter under consideration in this article. Certain relationships marked with a “U” are those for which no compensation was received; those relationships marked with a “C” were compensated. For a detailed description of the disclosure categories, or for more information about ASCO's conflict of interest policy, please refer to the Author Disclosure Declaration and the Disclosures of Potential Conflicts of Interest section in Information for Contributors.
Employment or Leadership Position: Gerald V. Doyle, Immunicon (C) Consultant or Advisory Role: Julie R. Gralow, Novartis (C), Roche/Genentech (C) Stock Ownership: None Honoraria: Jeffrey B. Smerage, Veridex Research Funding: Jeffrey B. Smerage, Immunicon; Julie R. Gralow, Novartis, Roche/Genentech, Amgen; Daniel F. Hayes, Veridex/Janssen Diagnostics Expert Testimony: None Patents, Royalties, and Licenses: Gerald V. Doyle, 05725638.0-1223-US2005008602; Daniel F. Hayes, 05725638.0-1223-US2005008602 Other Remuneration: None
AUTHOR CONTRIBUTIONS
Conception and design: Jeffrey B. Smerage, William E. Barlow, Eric P. Winer, Brian Leyland-Jones, Gordan Srkalovic, Sheela Tejwani, Anne F. Schott, Mark A. O'Rourke, Danika L. Lew, Gerald V. Doyle, Julie R. Gralow, Robert B. Livingston, Daniel F. Hayes
Provision of study materials or patients: Jeffrey B. Smerage, Gabriel N. Hortobagyi, Brian Leyland-Jones, Sheela Tejwani, Anne F. Schott, Mark A. O'Rourke, Julie R. Gralow, Daniel F. Hayes
Collection and assembly of data: Jeffrey B. Smerage, William E. Barlow, Danika L. Lew
Data analysis and interpretation: Jeffrey B. Smerage, William E. Barlow, Gabriel N. Hortobagyi, Danika L. Lew, Daniel F. Hayes
Manuscript writing: All authors
Final approval of manuscript: All authors
REFERENCES
- 1.Clark GM, Sledge GW, Jr, Osborne CK, et al. Survival from first recurrence: Relative importance of prognostic factors in 1,015 breast cancer patients. J Clin Oncol. 1987;5:55–61. doi: 10.1200/JCO.1987.5.1.55. [DOI] [PubMed] [Google Scholar]
- 2.Chia SK, Speers CH, D'yachkova Y, et al. The impact of new chemotherapeutic and hormone agents on survival in a population-based cohort of women with metastatic breast cancer. Cancer. 2007;110:973–979. doi: 10.1002/cncr.22867. [DOI] [PubMed] [Google Scholar]
- 3.Lin NU, Thomssen C, Cardoso F, et al. International guidelines for management of metastatic breast cancer (MBC) from the European School of Oncology (ESO)-MBC Task Force: Surveillance, staging, and evaluation of patients with early-stage and metastatic breast cancer. Breast. 2013;22:203–210. doi: 10.1016/j.breast.2013.03.006. [DOI] [PubMed] [Google Scholar]
- 4.Miles D, von Minckwitz G, Seidman AD. Combination versus sequential single-agent therapy in metastatic breast cancer. Oncologist. 2002;6:13–19. [PubMed] [Google Scholar]
- 5.Cristofanilli M, Budd GT, Ellis MJ, et al. Circulating tumor cells, disease progression, and survival in metastatic breast cancer. N Engl J Med. 2004;351:781–791. doi: 10.1056/NEJMoa040766. [DOI] [PubMed] [Google Scholar]
- 6.Paoletti C, Smerage J, Hayes DF. Circulating tumor cells as a marker of prognosis. In: DeVita VT Jr, Lawrence TS, Rosenberg SA, editors. Principles and Practice of Oncology Updates. New York, NY: Wolters Kluwer Health; 2012. pp. 1–8. [Google Scholar]
- 7.Allard WJ, Matera J, Miller MC, et al. Tumor cells circulate in the peripheral blood of all major carcinomas but not in healthy subjects or patients with nonmalignant diseases. Clin Cancer Res. 2004;10:6897–6904. doi: 10.1158/1078-0432.CCR-04-0378. [DOI] [PubMed] [Google Scholar]
- 8.Liu MC, Shields PG, Warren RD, et al. Circulating tumor cells: A useful predictor of treatment efficacy in metastatic breast cancer. J Clin Oncol. 2009;27:5153–5159. doi: 10.1200/JCO.2008.20.6664. [DOI] [PMC free article] [PubMed] [Google Scholar]
- 9.Roychowdhury S, Iyer MK, Robinson DR, et al. Personalized oncology through integrative high-throughput sequencing: A pilot study. Sci Transl Med. 2011;3:111ra121. doi: 10.1126/scitranslmed.3003161. [DOI] [PMC free article] [PubMed] [Google Scholar]
- 10.Dawson SJ, Tsui DW, Murtaza M, et al. Analysis of circulating tumor DNA to monitor metastatic breast cancer. N Engl J Med. 2013;368:1199–1209. doi: 10.1056/NEJMoa1213261. [DOI] [PubMed] [Google Scholar]
- 11.Peeters DJ, De Laere B, Van den Eynden GG, et al. Semiautomated isolation and molecular characterisation of single or highly purified tumour cells from CellSearch enriched blood samples using dielectrophoretic cell sorting. Br J Cancer. 2013;108:1358–1367. doi: 10.1038/bjc.2013.92. [DOI] [PMC free article] [PubMed] [Google Scholar]
- 12.Wan L, Pantel K, Kang Y. Tumor metastasis: Moving new biological insights into the clinic. Nat Med. 2013;19:1450–1464. doi: 10.1038/nm.3391. [DOI] [PubMed] [Google Scholar]
Associated Data
This section collects any data citations, data availability statements, or supplementary materials included in this article.